
Key Insights
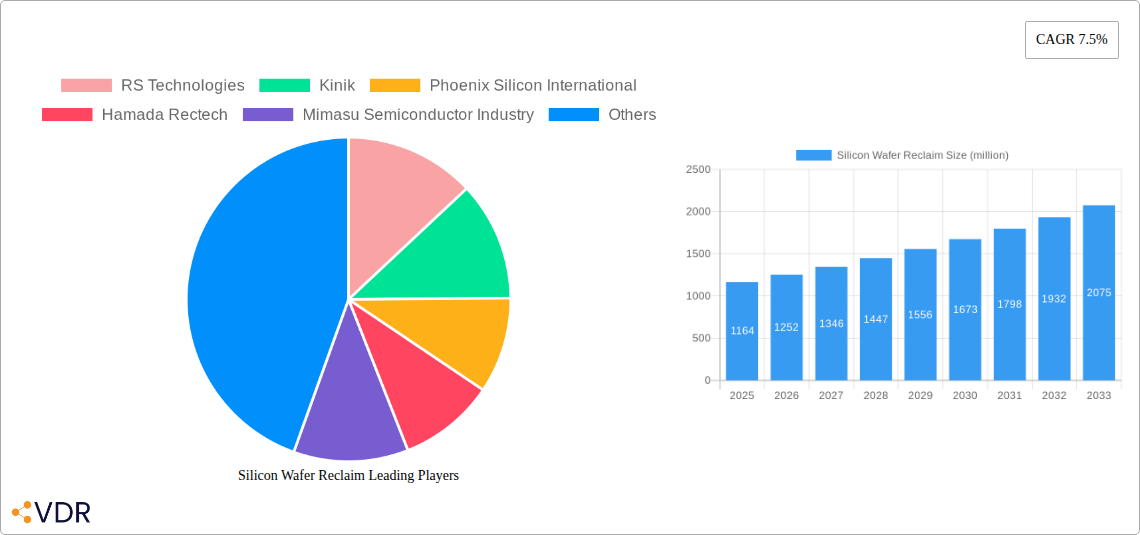
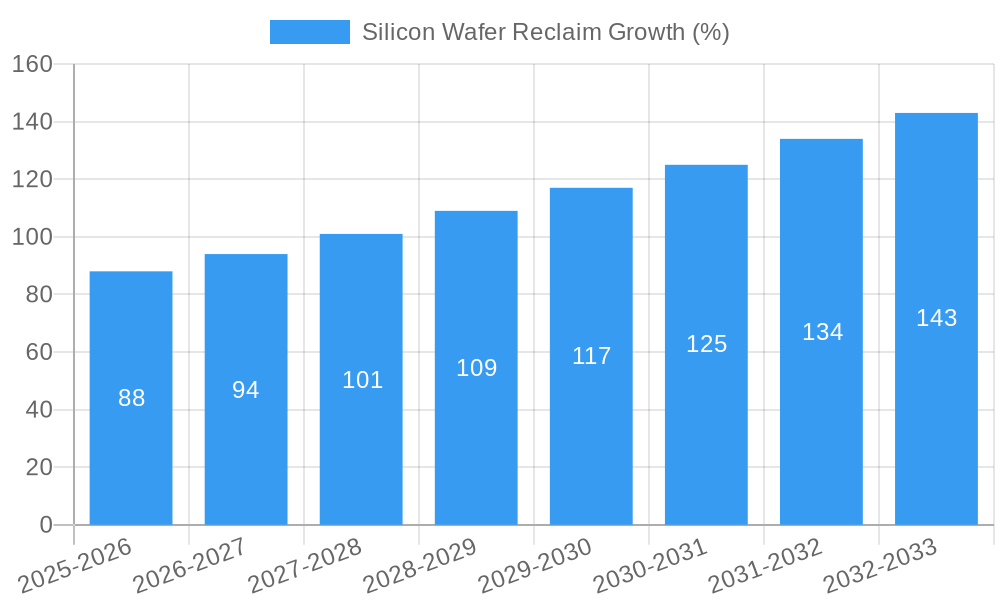
The silicon wafer reclaim market, valued at $1164 million in 2025, is projected to experience robust growth, driven by increasing demand for recycled silicon wafers within the semiconductor industry. The rising cost of raw silicon and growing environmental concerns are key factors fueling this market expansion. A Compound Annual Growth Rate (CAGR) of 7.5% from 2025 to 2033 indicates a significant market opportunity. This growth is further propelled by technological advancements in reclaim processes, leading to higher yield rates and improved wafer quality. Major players like RS Technologies, Kinik, and Phoenix Silicon International are actively shaping the market landscape through strategic investments in research and development, capacity expansion, and acquisitions. The market segmentation, while not explicitly provided, can be logically inferred to include various wafer sizes, materials (e.g., monocrystalline, polycrystalline), and reclaim technologies (e.g., chemical mechanical polishing (CMP) slurry recycling). Regional variations in market growth are expected, with regions possessing strong semiconductor manufacturing bases likely to experience faster growth. However, potential restraints include the complexity of the reclaim process, stringent quality requirements for recycled wafers, and the need for substantial capital investment in advanced reclaim technologies. Despite these challenges, the long-term outlook remains positive, driven by the inherent sustainability and cost-effectiveness of silicon wafer reclaim.
The competitive landscape is characterized by both established players and emerging companies, reflecting diverse technological approaches and market strategies. Companies are focusing on collaborations, partnerships, and mergers and acquisitions to gain a competitive edge and expand their market share. Future growth will depend on overcoming technological limitations, expanding the applications of reclaimed wafers, and developing robust supply chains to meet the increasing demand for sustainable semiconductor manufacturing practices. Furthermore, industry consolidation and strategic alliances are expected to continue shaping the market dynamics in the coming years. The market is expected to reach approximately $2150 million by 2033, based on the projected CAGR. This projection considers the positive growth drivers and potential mitigating factors within the industry.
Silicon Wafer Reclaim Market Report: 2019-2033
This comprehensive report provides an in-depth analysis of the Silicon Wafer Reclaim market, encompassing market dynamics, growth trends, regional analysis, product landscape, key players, and future outlook. The study period covers 2019-2033, with 2025 as the base and estimated year. The forecast period spans 2025-2033, and the historical period covers 2019-2024. This report is crucial for semiconductor manufacturers, reclaim companies, investors, and industry analysts seeking a detailed understanding of this rapidly evolving market.
Silicon Wafer Reclaim Market Dynamics & Structure
The silicon wafer reclaim market is characterized by a moderately concentrated landscape with several key players vying for market share. Technological innovation, primarily driven by advancements in wet chemical etching and plasma cleaning techniques, is a key driver. Stringent environmental regulations concerning silicon waste disposal are shaping industry practices. Competitive substitutes, such as using virgin silicon, exist but are often economically less viable. End-users span across various segments of the semiconductor industry, from integrated circuit (IC) manufacturers to photovoltaic (PV) cell producers. Mergers and acquisitions (M&A) activity has been moderate, with a total estimated deal value of $xx million in the historical period.
- Market Concentration: Moderately concentrated, with top 5 players holding an estimated xx% market share in 2025.
- Technological Innovation: Focus on improving reclaim yield, reducing processing time, and minimizing environmental impact.
- Regulatory Framework: Growing emphasis on sustainable waste management influences reclaim technologies.
- Competitive Substitutes: Virgin silicon remains a competitor, but cost and environmental concerns favor reclaim.
- End-User Demographics: Diverse, including IC manufacturers, PV manufacturers, and research institutions.
- M&A Trends: Moderate activity observed, with an estimated xx number of deals completed in 2019-2024, valued at $xx million. Increased consolidation expected in the forecast period.
Silicon Wafer Reclaim Growth Trends & Insights
The global silicon wafer reclaim market is witnessing robust growth, driven by increasing demand for silicon wafers, rising environmental awareness, and the economic benefits of reclaiming valuable materials. The market size experienced a Compound Annual Growth Rate (CAGR) of xx% during the historical period (2019-2024), reaching $xx million in 2024. This growth is projected to continue at a CAGR of xx% during the forecast period (2025-2033), reaching an estimated $xx million by 2033. Market penetration remains relatively low, offering significant opportunities for expansion. Technological advancements, particularly in automated reclaim processes and improved material recovery rates, further contribute to market expansion. The shift toward sustainable manufacturing practices within the semiconductor industry fuels adoption rates, leading to substantial market growth.
Dominant Regions, Countries, or Segments in Silicon Wafer Reclaim
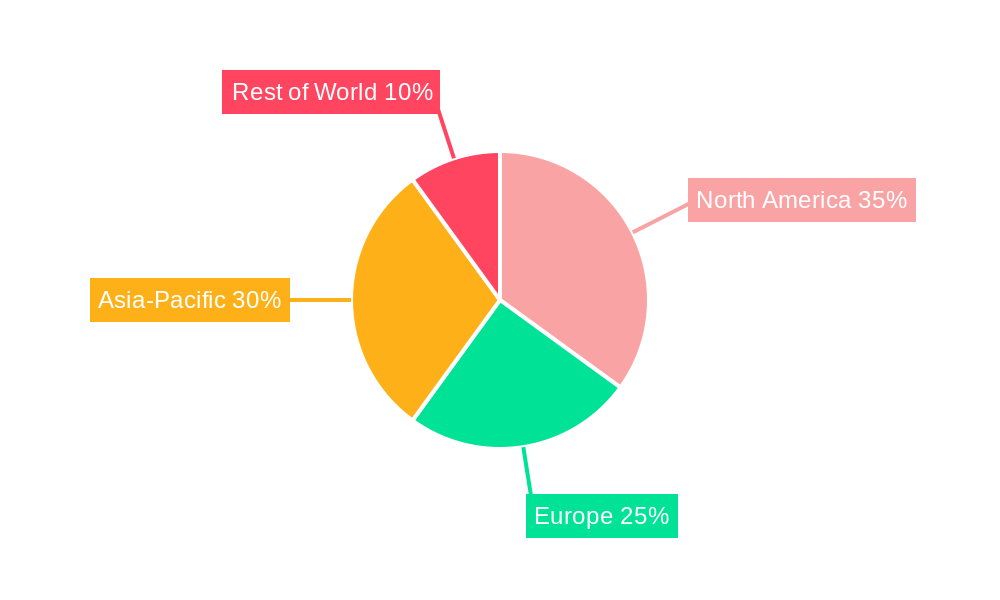
East Asia, particularly countries like China, Japan, South Korea, and Taiwan, currently dominate the silicon wafer reclaim market, owing to their strong presence in the semiconductor manufacturing sector and supportive government policies promoting sustainable practices. These regions have a well-established infrastructure for reclaim operations and a high concentration of end-users. The strong economic growth and substantial investments in semiconductor manufacturing further augment market growth within these regions.
- Key Drivers:
- High concentration of semiconductor manufacturing facilities.
- Supportive government policies and environmental regulations.
- Robust technological advancements within the region.
- High demand for silicon wafers across various applications.
The dominance of East Asia is expected to persist throughout the forecast period, although other regions, particularly North America and Europe, are expected to experience gradual market growth due to increased awareness of sustainable manufacturing and the growing presence of semiconductor production facilities.
Silicon Wafer Reclaim Product Landscape
The silicon wafer reclaim market offers a range of services tailored to different wafer types, sizes, and contamination levels. Reclaim processes typically involve sophisticated wet chemical cleaning, plasma etching, and meticulous inspection to ensure high yield and quality of the reclaimed wafers. Recent advancements focus on automating these processes and improving yield rates, thereby reducing costs and enhancing efficiency. The key selling proposition lies in the cost savings compared to sourcing virgin silicon, along with environmental benefits related to reduced waste disposal.
Key Drivers, Barriers & Challenges in Silicon Wafer Reclaim
Key Drivers: The rising demand for silicon wafers across electronics and solar energy sectors, coupled with the growing awareness of environmental sustainability and stringent regulations on silicon waste disposal, are major drivers. Cost savings compared to using virgin silicon are also compelling.
Key Challenges: Maintaining consistent quality in reclaimed wafers, handling complex contamination issues, and navigating fluctuating silicon prices pose significant challenges. Technological limitations in reclaiming heavily contaminated wafers also affect market expansion. Moreover, establishing cost-effective and efficient reclaim processes for various wafer types and sizes remains a key hurdle.
Emerging Opportunities in Silicon Wafer Reclaim
Untapped markets in emerging economies offer significant growth potential. Further innovation in reclaim technologies focusing on handling more complex contamination and improving yield rates presents substantial opportunities. Expansion into new applications, such as using reclaimed silicon for less demanding applications, could significantly broaden the market.
Growth Accelerators in the Silicon Wafer Reclaim Industry
Technological breakthroughs in automation, improving reclaim yield rates, and developing more environmentally friendly processes are key catalysts. Strategic partnerships between reclaim companies and semiconductor manufacturers can also expedite market expansion. Government initiatives supporting sustainable manufacturing contribute to long-term growth.
Key Players Shaping the Silicon Wafer Reclaim Market
- RS Technologies
- Kinik
- Phoenix Silicon International
- Hamada Rectech
- Mimasu Semiconductor Industry
- GST
- Scientech
- Pure Wafer
- TOPCO Scientific Co. LTD
- Ferrotec
- Xtek semiconductor (Huangshi)
- Shinryo
- KST World
- Vatech Co., Ltd.
- OPTIM Wafer Services
- Nippon Chemi-Con
- NanoSILICON
- KU WEI TECHNOLOGY
- Hua Hsu Silicon Materials
- Hwatsing Technology
- Fine Silicon Manufacturing (shanghai)
- PNC Process Systems
- Silicon Valley Microelectronics
Notable Milestones in Silicon Wafer Reclaim Sector
- 2020: Introduction of automated cleaning systems by RS Technologies.
- 2022: Merger between Scientech and Pure Wafer, expanding market reach.
- 2023: Launch of a new plasma etching technology by Hamada Rectech, significantly improving reclaim yield. (Further milestones can be added based on available data)
In-Depth Silicon Wafer Reclaim Market Outlook
The silicon wafer reclaim market is poised for robust growth fueled by technological advancements, rising environmental concerns, and cost advantages. Strategic investments in automation, R&D, and expansion into new markets present significant opportunities for companies to enhance market share and profitability. The market's future trajectory hinges on the ongoing development of efficient and sustainable reclaim technologies.
Silicon Wafer Reclaim Segmentation
-
1. Application
- 1.1. IDM
- 1.2. Foundry
- 1.3. Others
-
2. Type
- 2.1. Monitor Wafers
- 2.2. Dummy Wafers
Silicon Wafer Reclaim Segmentation By Geography
-
1. North America
- 1.1. United States
- 1.2. Canada
- 1.3. Mexico
-
2. South America
- 2.1. Brazil
- 2.2. Argentina
- 2.3. Rest of South America
-
3. Europe
- 3.1. United Kingdom
- 3.2. Germany
- 3.3. France
- 3.4. Italy
- 3.5. Spain
- 3.6. Russia
- 3.7. Benelux
- 3.8. Nordics
- 3.9. Rest of Europe
-
4. Middle East & Africa
- 4.1. Turkey
- 4.2. Israel
- 4.3. GCC
- 4.4. North Africa
- 4.5. South Africa
- 4.6. Rest of Middle East & Africa
-
5. Asia Pacific
- 5.1. China
- 5.2. India
- 5.3. Japan
- 5.4. South Korea
- 5.5. ASEAN
- 5.6. Oceania
- 5.7. Rest of Asia Pacific
Silicon Wafer Reclaim REPORT HIGHLIGHTS
| Aspects | Details |
|---|---|
| Study Period | 2019-2033 |
| Base Year | 2024 |
| Estimated Year | 2025 |
| Forecast Period | 2025-2033 |
| Historical Period | 2019-2024 |
| Growth Rate | CAGR of 7.5% from 2019-2033 |
| Segmentation |
|
Table of Contents
- 1. Introduction
- 1.1. Research Scope
- 1.2. Market Segmentation
- 1.3. Research Methodology
- 1.4. Definitions and Assumptions
- 2. Executive Summary
- 2.1. Introduction
- 3. Market Dynamics
- 3.1. Introduction
- 3.2. Market Drivers
- 3.3. Market Restrains
- 3.4. Market Trends
- 4. Market Factor Analysis
- 4.1. Porters Five Forces
- 4.2. Supply/Value Chain
- 4.3. PESTEL analysis
- 4.4. Market Entropy
- 4.5. Patent/Trademark Analysis
- 5. Global Silicon Wafer Reclaim Analysis, Insights and Forecast, 2019-2031
- 5.1. Market Analysis, Insights and Forecast - by Application
- 5.1.1. IDM
- 5.1.2. Foundry
- 5.1.3. Others
- 5.2. Market Analysis, Insights and Forecast - by Type
- 5.2.1. Monitor Wafers
- 5.2.2. Dummy Wafers
- 5.3. Market Analysis, Insights and Forecast - by Region
- 5.3.1. North America
- 5.3.2. South America
- 5.3.3. Europe
- 5.3.4. Middle East & Africa
- 5.3.5. Asia Pacific
- 5.1. Market Analysis, Insights and Forecast - by Application
- 6. North America Silicon Wafer Reclaim Analysis, Insights and Forecast, 2019-2031
- 6.1. Market Analysis, Insights and Forecast - by Application
- 6.1.1. IDM
- 6.1.2. Foundry
- 6.1.3. Others
- 6.2. Market Analysis, Insights and Forecast - by Type
- 6.2.1. Monitor Wafers
- 6.2.2. Dummy Wafers
- 6.1. Market Analysis, Insights and Forecast - by Application
- 7. South America Silicon Wafer Reclaim Analysis, Insights and Forecast, 2019-2031
- 7.1. Market Analysis, Insights and Forecast - by Application
- 7.1.1. IDM
- 7.1.2. Foundry
- 7.1.3. Others
- 7.2. Market Analysis, Insights and Forecast - by Type
- 7.2.1. Monitor Wafers
- 7.2.2. Dummy Wafers
- 7.1. Market Analysis, Insights and Forecast - by Application
- 8. Europe Silicon Wafer Reclaim Analysis, Insights and Forecast, 2019-2031
- 8.1. Market Analysis, Insights and Forecast - by Application
- 8.1.1. IDM
- 8.1.2. Foundry
- 8.1.3. Others
- 8.2. Market Analysis, Insights and Forecast - by Type
- 8.2.1. Monitor Wafers
- 8.2.2. Dummy Wafers
- 8.1. Market Analysis, Insights and Forecast - by Application
- 9. Middle East & Africa Silicon Wafer Reclaim Analysis, Insights and Forecast, 2019-2031
- 9.1. Market Analysis, Insights and Forecast - by Application
- 9.1.1. IDM
- 9.1.2. Foundry
- 9.1.3. Others
- 9.2. Market Analysis, Insights and Forecast - by Type
- 9.2.1. Monitor Wafers
- 9.2.2. Dummy Wafers
- 9.1. Market Analysis, Insights and Forecast - by Application
- 10. Asia Pacific Silicon Wafer Reclaim Analysis, Insights and Forecast, 2019-2031
- 10.1. Market Analysis, Insights and Forecast - by Application
- 10.1.1. IDM
- 10.1.2. Foundry
- 10.1.3. Others
- 10.2. Market Analysis, Insights and Forecast - by Type
- 10.2.1. Monitor Wafers
- 10.2.2. Dummy Wafers
- 10.1. Market Analysis, Insights and Forecast - by Application
- 11. Competitive Analysis
- 11.1. Global Market Share Analysis 2024
- 11.2. Company Profiles
- 11.2.1 RS Technologies
- 11.2.1.1. Overview
- 11.2.1.2. Products
- 11.2.1.3. SWOT Analysis
- 11.2.1.4. Recent Developments
- 11.2.1.5. Financials (Based on Availability)
- 11.2.2 Kinik
- 11.2.2.1. Overview
- 11.2.2.2. Products
- 11.2.2.3. SWOT Analysis
- 11.2.2.4. Recent Developments
- 11.2.2.5. Financials (Based on Availability)
- 11.2.3 Phoenix Silicon International
- 11.2.3.1. Overview
- 11.2.3.2. Products
- 11.2.3.3. SWOT Analysis
- 11.2.3.4. Recent Developments
- 11.2.3.5. Financials (Based on Availability)
- 11.2.4 Hamada Rectech
- 11.2.4.1. Overview
- 11.2.4.2. Products
- 11.2.4.3. SWOT Analysis
- 11.2.4.4. Recent Developments
- 11.2.4.5. Financials (Based on Availability)
- 11.2.5 Mimasu Semiconductor Industry
- 11.2.5.1. Overview
- 11.2.5.2. Products
- 11.2.5.3. SWOT Analysis
- 11.2.5.4. Recent Developments
- 11.2.5.5. Financials (Based on Availability)
- 11.2.6 GST
- 11.2.6.1. Overview
- 11.2.6.2. Products
- 11.2.6.3. SWOT Analysis
- 11.2.6.4. Recent Developments
- 11.2.6.5. Financials (Based on Availability)
- 11.2.7 Scientech
- 11.2.7.1. Overview
- 11.2.7.2. Products
- 11.2.7.3. SWOT Analysis
- 11.2.7.4. Recent Developments
- 11.2.7.5. Financials (Based on Availability)
- 11.2.8 Pure Wafer
- 11.2.8.1. Overview
- 11.2.8.2. Products
- 11.2.8.3. SWOT Analysis
- 11.2.8.4. Recent Developments
- 11.2.8.5. Financials (Based on Availability)
- 11.2.9 TOPCO Scientific Co. LTD
- 11.2.9.1. Overview
- 11.2.9.2. Products
- 11.2.9.3. SWOT Analysis
- 11.2.9.4. Recent Developments
- 11.2.9.5. Financials (Based on Availability)
- 11.2.10 Ferrotec
- 11.2.10.1. Overview
- 11.2.10.2. Products
- 11.2.10.3. SWOT Analysis
- 11.2.10.4. Recent Developments
- 11.2.10.5. Financials (Based on Availability)
- 11.2.11 Xtek semiconductor (Huangshi)
- 11.2.11.1. Overview
- 11.2.11.2. Products
- 11.2.11.3. SWOT Analysis
- 11.2.11.4. Recent Developments
- 11.2.11.5. Financials (Based on Availability)
- 11.2.12 Shinryo
- 11.2.12.1. Overview
- 11.2.12.2. Products
- 11.2.12.3. SWOT Analysis
- 11.2.12.4. Recent Developments
- 11.2.12.5. Financials (Based on Availability)
- 11.2.13 KST World
- 11.2.13.1. Overview
- 11.2.13.2. Products
- 11.2.13.3. SWOT Analysis
- 11.2.13.4. Recent Developments
- 11.2.13.5. Financials (Based on Availability)
- 11.2.14 Vatech Co. Ltd.
- 11.2.14.1. Overview
- 11.2.14.2. Products
- 11.2.14.3. SWOT Analysis
- 11.2.14.4. Recent Developments
- 11.2.14.5. Financials (Based on Availability)
- 11.2.15 OPTIM Wafer Services
- 11.2.15.1. Overview
- 11.2.15.2. Products
- 11.2.15.3. SWOT Analysis
- 11.2.15.4. Recent Developments
- 11.2.15.5. Financials (Based on Availability)
- 11.2.16 Nippon Chemi-Con
- 11.2.16.1. Overview
- 11.2.16.2. Products
- 11.2.16.3. SWOT Analysis
- 11.2.16.4. Recent Developments
- 11.2.16.5. Financials (Based on Availability)
- 11.2.17 NanoSILICON
- 11.2.17.1. Overview
- 11.2.17.2. Products
- 11.2.17.3. SWOT Analysis
- 11.2.17.4. Recent Developments
- 11.2.17.5. Financials (Based on Availability)
- 11.2.18 KU WEI TECHNOLOGY
- 11.2.18.1. Overview
- 11.2.18.2. Products
- 11.2.18.3. SWOT Analysis
- 11.2.18.4. Recent Developments
- 11.2.18.5. Financials (Based on Availability)
- 11.2.19 Hua Hsu Silicon Materials
- 11.2.19.1. Overview
- 11.2.19.2. Products
- 11.2.19.3. SWOT Analysis
- 11.2.19.4. Recent Developments
- 11.2.19.5. Financials (Based on Availability)
- 11.2.20 Hwatsing Technology
- 11.2.20.1. Overview
- 11.2.20.2. Products
- 11.2.20.3. SWOT Analysis
- 11.2.20.4. Recent Developments
- 11.2.20.5. Financials (Based on Availability)
- 11.2.21 Fine Silicon Manufacturing (shanghai)
- 11.2.21.1. Overview
- 11.2.21.2. Products
- 11.2.21.3. SWOT Analysis
- 11.2.21.4. Recent Developments
- 11.2.21.5. Financials (Based on Availability)
- 11.2.22 PNC Process Systems
- 11.2.22.1. Overview
- 11.2.22.2. Products
- 11.2.22.3. SWOT Analysis
- 11.2.22.4. Recent Developments
- 11.2.22.5. Financials (Based on Availability)
- 11.2.23 Silicon Valley Microelectronics
- 11.2.23.1. Overview
- 11.2.23.2. Products
- 11.2.23.3. SWOT Analysis
- 11.2.23.4. Recent Developments
- 11.2.23.5. Financials (Based on Availability)
- 11.2.1 RS Technologies
List of Figures
- Figure 1: Global Silicon Wafer Reclaim Revenue Breakdown (million, %) by Region 2024 & 2032
- Figure 2: North America Silicon Wafer Reclaim Revenue (million), by Application 2024 & 2032
- Figure 3: North America Silicon Wafer Reclaim Revenue Share (%), by Application 2024 & 2032
- Figure 4: North America Silicon Wafer Reclaim Revenue (million), by Type 2024 & 2032
- Figure 5: North America Silicon Wafer Reclaim Revenue Share (%), by Type 2024 & 2032
- Figure 6: North America Silicon Wafer Reclaim Revenue (million), by Country 2024 & 2032
- Figure 7: North America Silicon Wafer Reclaim Revenue Share (%), by Country 2024 & 2032
- Figure 8: South America Silicon Wafer Reclaim Revenue (million), by Application 2024 & 2032
- Figure 9: South America Silicon Wafer Reclaim Revenue Share (%), by Application 2024 & 2032
- Figure 10: South America Silicon Wafer Reclaim Revenue (million), by Type 2024 & 2032
- Figure 11: South America Silicon Wafer Reclaim Revenue Share (%), by Type 2024 & 2032
- Figure 12: South America Silicon Wafer Reclaim Revenue (million), by Country 2024 & 2032
- Figure 13: South America Silicon Wafer Reclaim Revenue Share (%), by Country 2024 & 2032
- Figure 14: Europe Silicon Wafer Reclaim Revenue (million), by Application 2024 & 2032
- Figure 15: Europe Silicon Wafer Reclaim Revenue Share (%), by Application 2024 & 2032
- Figure 16: Europe Silicon Wafer Reclaim Revenue (million), by Type 2024 & 2032
- Figure 17: Europe Silicon Wafer Reclaim Revenue Share (%), by Type 2024 & 2032
- Figure 18: Europe Silicon Wafer Reclaim Revenue (million), by Country 2024 & 2032
- Figure 19: Europe Silicon Wafer Reclaim Revenue Share (%), by Country 2024 & 2032
- Figure 20: Middle East & Africa Silicon Wafer Reclaim Revenue (million), by Application 2024 & 2032
- Figure 21: Middle East & Africa Silicon Wafer Reclaim Revenue Share (%), by Application 2024 & 2032
- Figure 22: Middle East & Africa Silicon Wafer Reclaim Revenue (million), by Type 2024 & 2032
- Figure 23: Middle East & Africa Silicon Wafer Reclaim Revenue Share (%), by Type 2024 & 2032
- Figure 24: Middle East & Africa Silicon Wafer Reclaim Revenue (million), by Country 2024 & 2032
- Figure 25: Middle East & Africa Silicon Wafer Reclaim Revenue Share (%), by Country 2024 & 2032
- Figure 26: Asia Pacific Silicon Wafer Reclaim Revenue (million), by Application 2024 & 2032
- Figure 27: Asia Pacific Silicon Wafer Reclaim Revenue Share (%), by Application 2024 & 2032
- Figure 28: Asia Pacific Silicon Wafer Reclaim Revenue (million), by Type 2024 & 2032
- Figure 29: Asia Pacific Silicon Wafer Reclaim Revenue Share (%), by Type 2024 & 2032
- Figure 30: Asia Pacific Silicon Wafer Reclaim Revenue (million), by Country 2024 & 2032
- Figure 31: Asia Pacific Silicon Wafer Reclaim Revenue Share (%), by Country 2024 & 2032
List of Tables
- Table 1: Global Silicon Wafer Reclaim Revenue million Forecast, by Region 2019 & 2032
- Table 2: Global Silicon Wafer Reclaim Revenue million Forecast, by Application 2019 & 2032
- Table 3: Global Silicon Wafer Reclaim Revenue million Forecast, by Type 2019 & 2032
- Table 4: Global Silicon Wafer Reclaim Revenue million Forecast, by Region 2019 & 2032
- Table 5: Global Silicon Wafer Reclaim Revenue million Forecast, by Application 2019 & 2032
- Table 6: Global Silicon Wafer Reclaim Revenue million Forecast, by Type 2019 & 2032
- Table 7: Global Silicon Wafer Reclaim Revenue million Forecast, by Country 2019 & 2032
- Table 8: United States Silicon Wafer Reclaim Revenue (million) Forecast, by Application 2019 & 2032
- Table 9: Canada Silicon Wafer Reclaim Revenue (million) Forecast, by Application 2019 & 2032
- Table 10: Mexico Silicon Wafer Reclaim Revenue (million) Forecast, by Application 2019 & 2032
- Table 11: Global Silicon Wafer Reclaim Revenue million Forecast, by Application 2019 & 2032
- Table 12: Global Silicon Wafer Reclaim Revenue million Forecast, by Type 2019 & 2032
- Table 13: Global Silicon Wafer Reclaim Revenue million Forecast, by Country 2019 & 2032
- Table 14: Brazil Silicon Wafer Reclaim Revenue (million) Forecast, by Application 2019 & 2032
- Table 15: Argentina Silicon Wafer Reclaim Revenue (million) Forecast, by Application 2019 & 2032
- Table 16: Rest of South America Silicon Wafer Reclaim Revenue (million) Forecast, by Application 2019 & 2032
- Table 17: Global Silicon Wafer Reclaim Revenue million Forecast, by Application 2019 & 2032
- Table 18: Global Silicon Wafer Reclaim Revenue million Forecast, by Type 2019 & 2032
- Table 19: Global Silicon Wafer Reclaim Revenue million Forecast, by Country 2019 & 2032
- Table 20: United Kingdom Silicon Wafer Reclaim Revenue (million) Forecast, by Application 2019 & 2032
- Table 21: Germany Silicon Wafer Reclaim Revenue (million) Forecast, by Application 2019 & 2032
- Table 22: France Silicon Wafer Reclaim Revenue (million) Forecast, by Application 2019 & 2032
- Table 23: Italy Silicon Wafer Reclaim Revenue (million) Forecast, by Application 2019 & 2032
- Table 24: Spain Silicon Wafer Reclaim Revenue (million) Forecast, by Application 2019 & 2032
- Table 25: Russia Silicon Wafer Reclaim Revenue (million) Forecast, by Application 2019 & 2032
- Table 26: Benelux Silicon Wafer Reclaim Revenue (million) Forecast, by Application 2019 & 2032
- Table 27: Nordics Silicon Wafer Reclaim Revenue (million) Forecast, by Application 2019 & 2032
- Table 28: Rest of Europe Silicon Wafer Reclaim Revenue (million) Forecast, by Application 2019 & 2032
- Table 29: Global Silicon Wafer Reclaim Revenue million Forecast, by Application 2019 & 2032
- Table 30: Global Silicon Wafer Reclaim Revenue million Forecast, by Type 2019 & 2032
- Table 31: Global Silicon Wafer Reclaim Revenue million Forecast, by Country 2019 & 2032
- Table 32: Turkey Silicon Wafer Reclaim Revenue (million) Forecast, by Application 2019 & 2032
- Table 33: Israel Silicon Wafer Reclaim Revenue (million) Forecast, by Application 2019 & 2032
- Table 34: GCC Silicon Wafer Reclaim Revenue (million) Forecast, by Application 2019 & 2032
- Table 35: North Africa Silicon Wafer Reclaim Revenue (million) Forecast, by Application 2019 & 2032
- Table 36: South Africa Silicon Wafer Reclaim Revenue (million) Forecast, by Application 2019 & 2032
- Table 37: Rest of Middle East & Africa Silicon Wafer Reclaim Revenue (million) Forecast, by Application 2019 & 2032
- Table 38: Global Silicon Wafer Reclaim Revenue million Forecast, by Application 2019 & 2032
- Table 39: Global Silicon Wafer Reclaim Revenue million Forecast, by Type 2019 & 2032
- Table 40: Global Silicon Wafer Reclaim Revenue million Forecast, by Country 2019 & 2032
- Table 41: China Silicon Wafer Reclaim Revenue (million) Forecast, by Application 2019 & 2032
- Table 42: India Silicon Wafer Reclaim Revenue (million) Forecast, by Application 2019 & 2032
- Table 43: Japan Silicon Wafer Reclaim Revenue (million) Forecast, by Application 2019 & 2032
- Table 44: South Korea Silicon Wafer Reclaim Revenue (million) Forecast, by Application 2019 & 2032
- Table 45: ASEAN Silicon Wafer Reclaim Revenue (million) Forecast, by Application 2019 & 2032
- Table 46: Oceania Silicon Wafer Reclaim Revenue (million) Forecast, by Application 2019 & 2032
- Table 47: Rest of Asia Pacific Silicon Wafer Reclaim Revenue (million) Forecast, by Application 2019 & 2032
Frequently Asked Questions
1. What is the projected Compound Annual Growth Rate (CAGR) of the Silicon Wafer Reclaim?
The projected CAGR is approximately 7.5%.
2. Which companies are prominent players in the Silicon Wafer Reclaim?
Key companies in the market include RS Technologies, Kinik, Phoenix Silicon International, Hamada Rectech, Mimasu Semiconductor Industry, GST, Scientech, Pure Wafer, TOPCO Scientific Co. LTD, Ferrotec, Xtek semiconductor (Huangshi), Shinryo, KST World, Vatech Co., Ltd., OPTIM Wafer Services, Nippon Chemi-Con, NanoSILICON, KU WEI TECHNOLOGY, Hua Hsu Silicon Materials, Hwatsing Technology, Fine Silicon Manufacturing (shanghai), PNC Process Systems, Silicon Valley Microelectronics.
3. What are the main segments of the Silicon Wafer Reclaim?
The market segments include Application, Type.
4. Can you provide details about the market size?
The market size is estimated to be USD 1164 million as of 2022.
5. What are some drivers contributing to market growth?
N/A
6. What are the notable trends driving market growth?
N/A
7. Are there any restraints impacting market growth?
N/A
8. Can you provide examples of recent developments in the market?
N/A
9. What pricing options are available for accessing the report?
Pricing options include single-user, multi-user, and enterprise licenses priced at USD 4900.00, USD 7350.00, and USD 9800.00 respectively.
10. Is the market size provided in terms of value or volume?
The market size is provided in terms of value, measured in million.
11. Are there any specific market keywords associated with the report?
Yes, the market keyword associated with the report is "Silicon Wafer Reclaim," which aids in identifying and referencing the specific market segment covered.
12. How do I determine which pricing option suits my needs best?
The pricing options vary based on user requirements and access needs. Individual users may opt for single-user licenses, while businesses requiring broader access may choose multi-user or enterprise licenses for cost-effective access to the report.
13. Are there any additional resources or data provided in the Silicon Wafer Reclaim report?
While the report offers comprehensive insights, it's advisable to review the specific contents or supplementary materials provided to ascertain if additional resources or data are available.
14. How can I stay updated on further developments or reports in the Silicon Wafer Reclaim?
To stay informed about further developments, trends, and reports in the Silicon Wafer Reclaim, consider subscribing to industry newsletters, following relevant companies and organizations, or regularly checking reputable industry news sources and publications.
Methodology
Step 1 - Identification of Relevant Samples Size from Population Database


Step 2 - Approaches for Defining Global Market Size (Value, Volume* & Price*)

Note*: In applicable scenarios
Step 3 - Data Sources
Primary Research
- Web Analytics
- Survey Reports
- Research Institute
- Latest Research Reports
- Opinion Leaders
Secondary Research
- Annual Reports
- White Paper
- Latest Press Release
- Industry Association
- Paid Database
- Investor Presentations

Step 4 - Data Triangulation
Involves using different sources of information in order to increase the validity of a study
These sources are likely to be stakeholders in a program - participants, other researchers, program staff, other community members, and so on.
Then we put all data in single framework & apply various statistical tools to find out the dynamic on the market.
During the analysis stage, feedback from the stakeholder groups would be compared to determine areas of agreement as well as areas of divergence


