

Key Insights
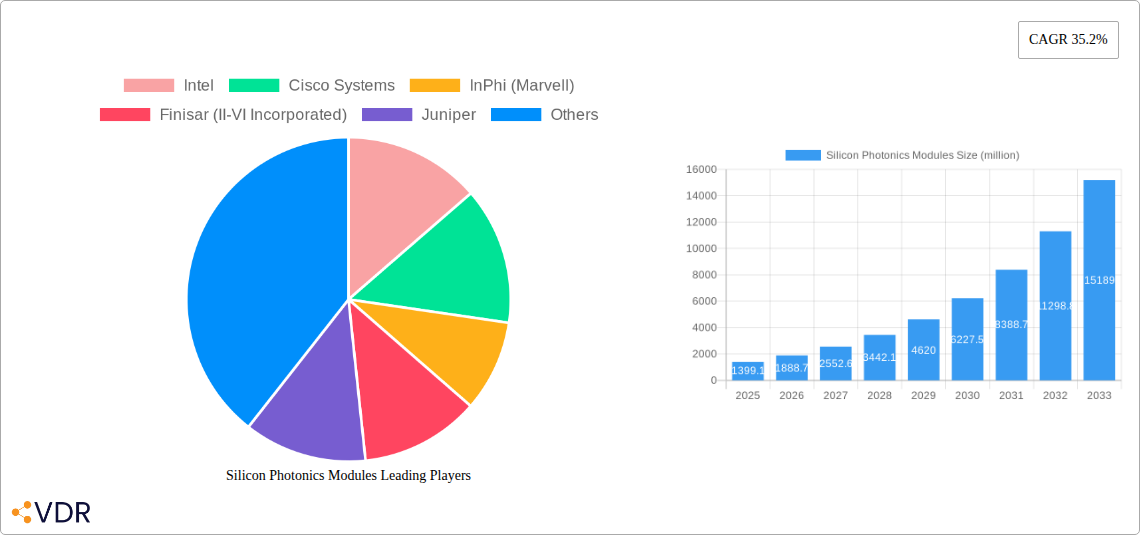
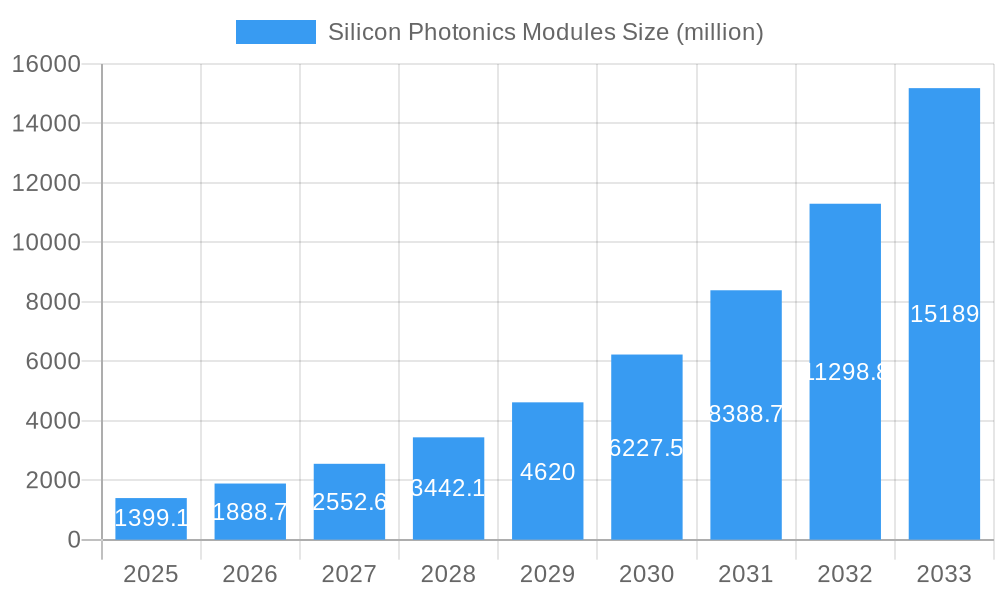
The silicon photonics modules market is experiencing explosive growth, projected to reach $1399.1 million in 2025 and exhibiting a remarkable Compound Annual Growth Rate (CAGR) of 35.2% from 2025 to 2033. This rapid expansion is driven by several key factors. The increasing demand for higher bandwidth and lower latency in data centers, fueled by the proliferation of cloud computing and big data applications, is a major catalyst. Furthermore, the ongoing miniaturization of electronic components and the need for more energy-efficient data transmission solutions are compelling businesses to adopt silicon photonics. Advancements in manufacturing processes, leading to reduced costs and improved performance, further contribute to the market's growth trajectory. Key players like Intel, Cisco Systems, and Marvell (through its acquisition of InPhi) are heavily investing in research and development, driving innovation and competition within the sector. The market is segmented by application (data centers, high-performance computing, telecommunications) and geographic regions, with North America and Asia-Pacific expected to be leading markets. However, challenges remain, including the high initial investment costs associated with silicon photonics technology adoption and the need for further standardization across different platforms.
Silicon Photonics Modules Market Size (In Billion)
Despite these challenges, the long-term outlook for the silicon photonics modules market remains exceptionally positive. The continuous increase in data traffic and the limitations of traditional copper-based interconnects will necessitate the wider adoption of silicon photonics solutions. As the technology matures and costs decrease, we anticipate an even more accelerated growth phase, particularly in emerging markets. The ongoing development of integrated circuits incorporating silicon photonics will further enhance performance and reduce costs, further solidifying its position as a transformative technology for next-generation data communication and networking infrastructure. Strategic partnerships and mergers and acquisitions will also play a crucial role in shaping the competitive landscape and accelerating market penetration.
Silicon Photonics Modules Company Market Share
Silicon Photonics Modules Market Report: 2019-2033
This comprehensive report provides an in-depth analysis of the Silicon Photonics Modules market, encompassing market dynamics, growth trends, regional dominance, product landscape, challenges, opportunities, and key players. The report covers the period from 2019 to 2033, with a focus on the forecast period from 2025 to 2033 and a base year of 2025. The study delves into the parent market of optical communication modules and the child market of high-speed data transmission, providing crucial insights for industry professionals, investors, and strategic decision-makers. The market size is projected to reach xx million units by 2033.
Silicon Photonics Modules Market Dynamics & Structure
The Silicon Photonics Modules market is characterized by a moderately concentrated structure with key players like Intel, Cisco Systems, InPhi (Marvell), Finisar (II-VI Incorporated), Juniper, Rockley Photonics, and FUJITSU holding significant market share. Technological innovation, driven by the demand for higher bandwidth and lower latency, is a major driver. Stringent regulatory frameworks concerning data security and transmission standards also influence market growth. Competitive product substitutes, such as traditional optical modules, pose a challenge, while the increasing adoption of cloud computing and 5G networks fuels market expansion. Mergers and acquisitions (M&A) activity is significant, with xx M&A deals recorded between 2019 and 2024, resulting in market consolidation and technological integration.
- Market Concentration: Moderately concentrated, with top 5 players holding approximately xx% market share in 2025.
- Technological Innovation: Focus on higher data rates (400G, 800G, and beyond), lower power consumption, and cost reduction.
- Regulatory Landscape: Compliance with international standards (e.g., IEEE, OIF) and data privacy regulations.
- Competitive Substitutes: Traditional optical modules based on other technologies.
- End-User Demographics: Data centers, telecommunication companies, high-performance computing (HPC) centers.
- M&A Trends: Consolidation through acquisitions of smaller players by larger corporations.
Silicon Photonics Modules Growth Trends & Insights
The Silicon Photonics Modules market experienced significant growth during the historical period (2019-2024), with a CAGR of xx%. This growth is primarily attributed to the increasing demand for high-bandwidth data transmission in data centers, telecommunications, and HPC. The market is expected to continue its expansion during the forecast period (2025-2033), driven by the widespread adoption of 5G networks, cloud computing, and the Internet of Things (IoT). Technological advancements such as the development of advanced packaging and integration techniques further enhance the market growth. Market penetration is expected to reach xx% by 2033, driven primarily by cost reductions and performance improvements in silicon photonics technology.
The adoption rate has accelerated due to increased demand for high-speed data transfer in the aforementioned sectors. Consumer behavior, driven by the increasing reliance on data-intensive applications and services, further stimulates demand. Technological disruptions, such as the development of coherent optical technologies, continuously improve performance and efficiency.
Dominant Regions, Countries, or Segments in Silicon Photonics Modules
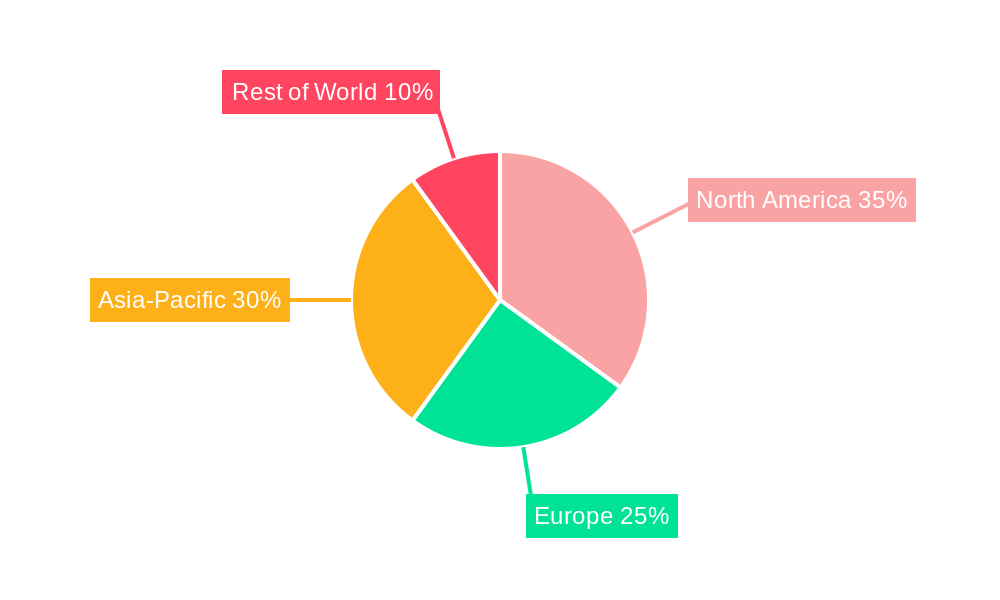
North America currently holds the largest market share in the Silicon Photonics Modules market, driven by significant investments in data centers and advanced telecommunication infrastructure. Asia-Pacific is experiencing rapid growth, fueled by expanding 5G infrastructure deployments and increasing demand for high-speed internet connectivity. Europe shows steady growth, driven by the increasing demand for data centers and cloud services.
- North America: High adoption rate in data centers and strong presence of major technology companies.
- Asia-Pacific: Rapid expansion of 5G networks and increasing data center investments.
- Europe: Steady growth driven by robust telecom infrastructure and expanding cloud services.
- Key Drivers: Government initiatives supporting digital infrastructure development and investments in R&D.
Silicon Photonics Modules Product Landscape
Silicon photonics modules offer a range of products catering to different bandwidth and reach requirements. These include transceivers supporting various data rates (e.g., 100G, 200G, 400G, 800G), featuring diverse form factors optimized for different applications. Key advancements focus on improved integration, reduced power consumption, and enhanced thermal management. Unique selling propositions include higher bandwidth density, lower latency, and reduced costs compared to traditional optical modules.
Key Drivers, Barriers & Challenges in Silicon Photonics Modules
Key Drivers: Increased demand for higher bandwidth and lower latency in data centers and telecommunications, advancements in silicon photonics technology, and government initiatives promoting digital infrastructure development.
Key Challenges: High manufacturing costs, potential supply chain disruptions, and competition from traditional optical technologies. Regulatory hurdles related to standardization and interoperability can also impact market growth. The predicted impact of these challenges on market growth is a reduction of xx% in projected growth by 2033 if not resolved effectively.
Emerging Opportunities in Silicon Photonics Modules
Emerging opportunities include the expansion into new markets, such as automotive and industrial automation, and the development of new applications like high-speed optical interconnects for HPC systems. The growing demand for advanced optical communication solutions in these sectors presents significant potential for market growth. Further innovation in packaging and integration technologies will open new avenues for market expansion.
Growth Accelerators in the Silicon Photonics Modules Industry
Technological breakthroughs in silicon photonics, coupled with strategic partnerships between component manufacturers and system integrators, are crucial accelerators for long-term growth. The expansion of 5G and cloud computing infrastructures worldwide creates significant market expansion opportunities. Increased adoption of advanced packaging and integration techniques further drives market expansion.
Key Players Shaping the Silicon Photonics Modules Market
Notable Milestones in Silicon Photonics Modules Sector
- 2020: Introduction of xx Gbps silicon photonics transceivers by several major players.
- 2021: Significant investments in R&D for next-generation silicon photonics technologies.
- 2022: Merger and acquisition activities further consolidating market players.
- 2023: Several new product launches focused on 800G and beyond.
- 2024: Growing adoption of silicon photonics solutions in data centers across the globe.
In-Depth Silicon Photonics Modules Market Outlook
The future of the Silicon Photonics Modules market is bright, with substantial growth potential driven by ongoing technological advancements and expanding applications across various sectors. Continued innovation in areas such as advanced packaging, improved integration, and lower power consumption will further propel market growth. Strategic partnerships and investments in R&D will enhance market competitiveness and expand market reach, leading to significant market expansion in the coming years.
Silicon Photonics Modules Segmentation
-
1. Application
- 1.1. Data Center
- 1.2. Non-Data Center
-
2. Types
- 2.1. 100G Silicon Photonic Transceiver
- 2.2. 200G/400G Silicon Photonic Transceiver
- 2.3. Others
Silicon Photonics Modules Segmentation By Geography
-
1. North America
- 1.1. United States
- 1.2. Canada
- 1.3. Mexico
-
2. South America
- 2.1. Brazil
- 2.2. Argentina
- 2.3. Rest of South America
-
3. Europe
- 3.1. United Kingdom
- 3.2. Germany
- 3.3. France
- 3.4. Italy
- 3.5. Spain
- 3.6. Russia
- 3.7. Benelux
- 3.8. Nordics
- 3.9. Rest of Europe
-
4. Middle East & Africa
- 4.1. Turkey
- 4.2. Israel
- 4.3. GCC
- 4.4. North Africa
- 4.5. South Africa
- 4.6. Rest of Middle East & Africa
-
5. Asia Pacific
- 5.1. China
- 5.2. India
- 5.3. Japan
- 5.4. South Korea
- 5.5. ASEAN
- 5.6. Oceania
- 5.7. Rest of Asia Pacific
Silicon Photonics Modules Regional Market Share
Geographic Coverage of Silicon Photonics Modules
Silicon Photonics Modules REPORT HIGHLIGHTS
| Aspects | Details |
|---|---|
| Study Period | 2020-2034 |
| Base Year | 2025 |
| Estimated Year | 2026 |
| Forecast Period | 2026-2034 |
| Historical Period | 2020-2025 |
| Growth Rate | CAGR of 25.3% from 2020-2034 |
| Segmentation |
|
Table of Contents
- 1. Introduction
- 1.1. Research Scope
- 1.2. Market Segmentation
- 1.3. Research Objective
- 1.4. Definitions and Assumptions
- 2. Executive Summary
- 2.1. Market Snapshot
- 3. Market Dynamics
- 3.1. Market Drivers
- 3.2. Market Restrains
- 3.3. Market Trends
- 3.4. Market Opportunities
- 4. Market Factor Analysis
- 4.1. Porters Five Forces
- 4.1.1. Bargaining Power of Suppliers
- 4.1.2. Bargaining Power of Buyers
- 4.1.3. Threat of New Entrants
- 4.1.4. Threat of Substitutes
- 4.1.5. Competitive Rivalry
- 4.2. PESTEL analysis
- 4.3. BCG Analysis
- 4.3.1. Stars (High Growth, High Market Share)
- 4.3.2. Cash Cows (Low Growth, High Market Share)
- 4.3.3. Question Mark (High Growth, Low Market Share)
- 4.3.4. Dogs (Low Growth, Low Market Share)
- 4.4. Ansoff Matrix Analysis
- 4.5. Supply Chain Analysis
- 4.6. Regulatory Landscape
- 4.7. Current Market Potential and Opportunity Assessment (TAM–SAM–SOM Framework)
- 4.8. VDR Analyst Note
- 4.1. Porters Five Forces
- 5. Market Analysis, Insights and Forecast 2021-2033
- 5.1. Market Analysis, Insights and Forecast - by Application
- 5.1.1. Data Center
- 5.1.2. Non-Data Center
- 5.2. Market Analysis, Insights and Forecast - by Types
- 5.2.1. 100G Silicon Photonic Transceiver
- 5.2.2. 200G/400G Silicon Photonic Transceiver
- 5.2.3. Others
- 5.3. Market Analysis, Insights and Forecast - by Region
- 5.3.1. North America
- 5.3.2. South America
- 5.3.3. Europe
- 5.3.4. Middle East & Africa
- 5.3.5. Asia Pacific
- 5.1. Market Analysis, Insights and Forecast - by Application
- 6. Global Silicon Photonics Modules Analysis, Insights and Forecast, 2021-2033
- 6.1. Market Analysis, Insights and Forecast - by Application
- 6.1.1. Data Center
- 6.1.2. Non-Data Center
- 6.2. Market Analysis, Insights and Forecast - by Types
- 6.2.1. 100G Silicon Photonic Transceiver
- 6.2.2. 200G/400G Silicon Photonic Transceiver
- 6.2.3. Others
- 6.1. Market Analysis, Insights and Forecast - by Application
- 7. North America Silicon Photonics Modules Analysis, Insights and Forecast, 2021-2033
- 7.1. Market Analysis, Insights and Forecast - by Application
- 7.1.1. Data Center
- 7.1.2. Non-Data Center
- 7.2. Market Analysis, Insights and Forecast - by Types
- 7.2.1. 100G Silicon Photonic Transceiver
- 7.2.2. 200G/400G Silicon Photonic Transceiver
- 7.2.3. Others
- 7.1. Market Analysis, Insights and Forecast - by Application
- 8. South America Silicon Photonics Modules Analysis, Insights and Forecast, 2021-2033
- 8.1. Market Analysis, Insights and Forecast - by Application
- 8.1.1. Data Center
- 8.1.2. Non-Data Center
- 8.2. Market Analysis, Insights and Forecast - by Types
- 8.2.1. 100G Silicon Photonic Transceiver
- 8.2.2. 200G/400G Silicon Photonic Transceiver
- 8.2.3. Others
- 8.1. Market Analysis, Insights and Forecast - by Application
- 9. Europe Silicon Photonics Modules Analysis, Insights and Forecast, 2021-2033
- 9.1. Market Analysis, Insights and Forecast - by Application
- 9.1.1. Data Center
- 9.1.2. Non-Data Center
- 9.2. Market Analysis, Insights and Forecast - by Types
- 9.2.1. 100G Silicon Photonic Transceiver
- 9.2.2. 200G/400G Silicon Photonic Transceiver
- 9.2.3. Others
- 9.1. Market Analysis, Insights and Forecast - by Application
- 10. Middle East & Africa Silicon Photonics Modules Analysis, Insights and Forecast, 2021-2033
- 10.1. Market Analysis, Insights and Forecast - by Application
- 10.1.1. Data Center
- 10.1.2. Non-Data Center
- 10.2. Market Analysis, Insights and Forecast - by Types
- 10.2.1. 100G Silicon Photonic Transceiver
- 10.2.2. 200G/400G Silicon Photonic Transceiver
- 10.2.3. Others
- 10.1. Market Analysis, Insights and Forecast - by Application
- 11. Asia Pacific Silicon Photonics Modules Analysis, Insights and Forecast, 2021-2033
- 11.1. Market Analysis, Insights and Forecast - by Application
- 11.1.1. Data Center
- 11.1.2. Non-Data Center
- 11.2. Market Analysis, Insights and Forecast - by Types
- 11.2.1. 100G Silicon Photonic Transceiver
- 11.2.2. 200G/400G Silicon Photonic Transceiver
- 11.2.3. Others
- 11.1. Market Analysis, Insights and Forecast - by Application
- 12. Competitive Analysis
- 12.1. Company Profiles
- 12.1.1 Intel
- 12.1.1.1. Company Overview
- 12.1.1.2. Products
- 12.1.1.3. Company Financials
- 12.1.1.4. SWOT Analysis
- 12.1.2 Cisco Systems
- 12.1.2.1. Company Overview
- 12.1.2.2. Products
- 12.1.2.3. Company Financials
- 12.1.2.4. SWOT Analysis
- 12.1.3 InPhi (Marvell)
- 12.1.3.1. Company Overview
- 12.1.3.2. Products
- 12.1.3.3. Company Financials
- 12.1.3.4. SWOT Analysis
- 12.1.4 Finisar (II-VI Incorporated)
- 12.1.4.1. Company Overview
- 12.1.4.2. Products
- 12.1.4.3. Company Financials
- 12.1.4.4. SWOT Analysis
- 12.1.5 Juniper
- 12.1.5.1. Company Overview
- 12.1.5.2. Products
- 12.1.5.3. Company Financials
- 12.1.5.4. SWOT Analysis
- 12.1.6 Rockley Photonics
- 12.1.6.1. Company Overview
- 12.1.6.2. Products
- 12.1.6.3. Company Financials
- 12.1.6.4. SWOT Analysis
- 12.1.7 FUJITSU
- 12.1.7.1. Company Overview
- 12.1.7.2. Products
- 12.1.7.3. Company Financials
- 12.1.7.4. SWOT Analysis
- 12.1.1 Intel
- 12.2. Market Entropy
- 12.2.1 Company's Key Areas Served
- 12.2.2 Recent Developments
- 12.3. Company Market Share Analysis 2025
- 12.3.1 Top 5 Companies Market Share Analysis
- 12.3.2 Top 3 Companies Market Share Analysis
- 12.4. List of Potential Customers
- 13. Research Methodology
List of Figures
- Figure 1: Global Silicon Photonics Modules Revenue Breakdown (undefined, %) by Region 2025 & 2033
- Figure 2: North America Silicon Photonics Modules Revenue (undefined), by Application 2025 & 2033
- Figure 3: North America Silicon Photonics Modules Revenue Share (%), by Application 2025 & 2033
- Figure 4: North America Silicon Photonics Modules Revenue (undefined), by Types 2025 & 2033
- Figure 5: North America Silicon Photonics Modules Revenue Share (%), by Types 2025 & 2033
- Figure 6: North America Silicon Photonics Modules Revenue (undefined), by Country 2025 & 2033
- Figure 7: North America Silicon Photonics Modules Revenue Share (%), by Country 2025 & 2033
- Figure 8: South America Silicon Photonics Modules Revenue (undefined), by Application 2025 & 2033
- Figure 9: South America Silicon Photonics Modules Revenue Share (%), by Application 2025 & 2033
- Figure 10: South America Silicon Photonics Modules Revenue (undefined), by Types 2025 & 2033
- Figure 11: South America Silicon Photonics Modules Revenue Share (%), by Types 2025 & 2033
- Figure 12: South America Silicon Photonics Modules Revenue (undefined), by Country 2025 & 2033
- Figure 13: South America Silicon Photonics Modules Revenue Share (%), by Country 2025 & 2033
- Figure 14: Europe Silicon Photonics Modules Revenue (undefined), by Application 2025 & 2033
- Figure 15: Europe Silicon Photonics Modules Revenue Share (%), by Application 2025 & 2033
- Figure 16: Europe Silicon Photonics Modules Revenue (undefined), by Types 2025 & 2033
- Figure 17: Europe Silicon Photonics Modules Revenue Share (%), by Types 2025 & 2033
- Figure 18: Europe Silicon Photonics Modules Revenue (undefined), by Country 2025 & 2033
- Figure 19: Europe Silicon Photonics Modules Revenue Share (%), by Country 2025 & 2033
- Figure 20: Middle East & Africa Silicon Photonics Modules Revenue (undefined), by Application 2025 & 2033
- Figure 21: Middle East & Africa Silicon Photonics Modules Revenue Share (%), by Application 2025 & 2033
- Figure 22: Middle East & Africa Silicon Photonics Modules Revenue (undefined), by Types 2025 & 2033
- Figure 23: Middle East & Africa Silicon Photonics Modules Revenue Share (%), by Types 2025 & 2033
- Figure 24: Middle East & Africa Silicon Photonics Modules Revenue (undefined), by Country 2025 & 2033
- Figure 25: Middle East & Africa Silicon Photonics Modules Revenue Share (%), by Country 2025 & 2033
- Figure 26: Asia Pacific Silicon Photonics Modules Revenue (undefined), by Application 2025 & 2033
- Figure 27: Asia Pacific Silicon Photonics Modules Revenue Share (%), by Application 2025 & 2033
- Figure 28: Asia Pacific Silicon Photonics Modules Revenue (undefined), by Types 2025 & 2033
- Figure 29: Asia Pacific Silicon Photonics Modules Revenue Share (%), by Types 2025 & 2033
- Figure 30: Asia Pacific Silicon Photonics Modules Revenue (undefined), by Country 2025 & 2033
- Figure 31: Asia Pacific Silicon Photonics Modules Revenue Share (%), by Country 2025 & 2033
List of Tables
- Table 1: Global Silicon Photonics Modules Revenue undefined Forecast, by Application 2020 & 2033
- Table 2: Global Silicon Photonics Modules Revenue undefined Forecast, by Types 2020 & 2033
- Table 3: Global Silicon Photonics Modules Revenue undefined Forecast, by Region 2020 & 2033
- Table 4: Global Silicon Photonics Modules Revenue undefined Forecast, by Application 2020 & 2033
- Table 5: Global Silicon Photonics Modules Revenue undefined Forecast, by Types 2020 & 2033
- Table 6: Global Silicon Photonics Modules Revenue undefined Forecast, by Country 2020 & 2033
- Table 7: United States Silicon Photonics Modules Revenue (undefined) Forecast, by Application 2020 & 2033
- Table 8: Canada Silicon Photonics Modules Revenue (undefined) Forecast, by Application 2020 & 2033
- Table 9: Mexico Silicon Photonics Modules Revenue (undefined) Forecast, by Application 2020 & 2033
- Table 10: Global Silicon Photonics Modules Revenue undefined Forecast, by Application 2020 & 2033
- Table 11: Global Silicon Photonics Modules Revenue undefined Forecast, by Types 2020 & 2033
- Table 12: Global Silicon Photonics Modules Revenue undefined Forecast, by Country 2020 & 2033
- Table 13: Brazil Silicon Photonics Modules Revenue (undefined) Forecast, by Application 2020 & 2033
- Table 14: Argentina Silicon Photonics Modules Revenue (undefined) Forecast, by Application 2020 & 2033
- Table 15: Rest of South America Silicon Photonics Modules Revenue (undefined) Forecast, by Application 2020 & 2033
- Table 16: Global Silicon Photonics Modules Revenue undefined Forecast, by Application 2020 & 2033
- Table 17: Global Silicon Photonics Modules Revenue undefined Forecast, by Types 2020 & 2033
- Table 18: Global Silicon Photonics Modules Revenue undefined Forecast, by Country 2020 & 2033
- Table 19: United Kingdom Silicon Photonics Modules Revenue (undefined) Forecast, by Application 2020 & 2033
- Table 20: Germany Silicon Photonics Modules Revenue (undefined) Forecast, by Application 2020 & 2033
- Table 21: France Silicon Photonics Modules Revenue (undefined) Forecast, by Application 2020 & 2033
- Table 22: Italy Silicon Photonics Modules Revenue (undefined) Forecast, by Application 2020 & 2033
- Table 23: Spain Silicon Photonics Modules Revenue (undefined) Forecast, by Application 2020 & 2033
- Table 24: Russia Silicon Photonics Modules Revenue (undefined) Forecast, by Application 2020 & 2033
- Table 25: Benelux Silicon Photonics Modules Revenue (undefined) Forecast, by Application 2020 & 2033
- Table 26: Nordics Silicon Photonics Modules Revenue (undefined) Forecast, by Application 2020 & 2033
- Table 27: Rest of Europe Silicon Photonics Modules Revenue (undefined) Forecast, by Application 2020 & 2033
- Table 28: Global Silicon Photonics Modules Revenue undefined Forecast, by Application 2020 & 2033
- Table 29: Global Silicon Photonics Modules Revenue undefined Forecast, by Types 2020 & 2033
- Table 30: Global Silicon Photonics Modules Revenue undefined Forecast, by Country 2020 & 2033
- Table 31: Turkey Silicon Photonics Modules Revenue (undefined) Forecast, by Application 2020 & 2033
- Table 32: Israel Silicon Photonics Modules Revenue (undefined) Forecast, by Application 2020 & 2033
- Table 33: GCC Silicon Photonics Modules Revenue (undefined) Forecast, by Application 2020 & 2033
- Table 34: North Africa Silicon Photonics Modules Revenue (undefined) Forecast, by Application 2020 & 2033
- Table 35: South Africa Silicon Photonics Modules Revenue (undefined) Forecast, by Application 2020 & 2033
- Table 36: Rest of Middle East & Africa Silicon Photonics Modules Revenue (undefined) Forecast, by Application 2020 & 2033
- Table 37: Global Silicon Photonics Modules Revenue undefined Forecast, by Application 2020 & 2033
- Table 38: Global Silicon Photonics Modules Revenue undefined Forecast, by Types 2020 & 2033
- Table 39: Global Silicon Photonics Modules Revenue undefined Forecast, by Country 2020 & 2033
- Table 40: China Silicon Photonics Modules Revenue (undefined) Forecast, by Application 2020 & 2033
- Table 41: India Silicon Photonics Modules Revenue (undefined) Forecast, by Application 2020 & 2033
- Table 42: Japan Silicon Photonics Modules Revenue (undefined) Forecast, by Application 2020 & 2033
- Table 43: South Korea Silicon Photonics Modules Revenue (undefined) Forecast, by Application 2020 & 2033
- Table 44: ASEAN Silicon Photonics Modules Revenue (undefined) Forecast, by Application 2020 & 2033
- Table 45: Oceania Silicon Photonics Modules Revenue (undefined) Forecast, by Application 2020 & 2033
- Table 46: Rest of Asia Pacific Silicon Photonics Modules Revenue (undefined) Forecast, by Application 2020 & 2033
Frequently Asked Questions
1. What is the projected Compound Annual Growth Rate (CAGR) of the Silicon Photonics Modules?
The projected CAGR is approximately 25.3%.
2. Which companies are prominent players in the Silicon Photonics Modules?
Key companies in the market include Intel, Cisco Systems, InPhi (Marvell), Finisar (II-VI Incorporated), Juniper, Rockley Photonics, FUJITSU.
3. What are the main segments of the Silicon Photonics Modules?
The market segments include Application, Types.
4. Can you provide details about the market size?
The market size is estimated to be USD XXX N/A as of 2022.
5. What are some drivers contributing to market growth?
N/A
6. What are the notable trends driving market growth?
N/A
7. Are there any restraints impacting market growth?
N/A
8. Can you provide examples of recent developments in the market?
N/A
9. What pricing options are available for accessing the report?
Pricing options include single-user, multi-user, and enterprise licenses priced at USD 5900.00, USD 8850.00, and USD 11800.00 respectively.
10. Is the market size provided in terms of value or volume?
The market size is provided in terms of value, measured in N/A.
11. Are there any specific market keywords associated with the report?
Yes, the market keyword associated with the report is "Silicon Photonics Modules," which aids in identifying and referencing the specific market segment covered.
12. How do I determine which pricing option suits my needs best?
The pricing options vary based on user requirements and access needs. Individual users may opt for single-user licenses, while businesses requiring broader access may choose multi-user or enterprise licenses for cost-effective access to the report.
13. Are there any additional resources or data provided in the Silicon Photonics Modules report?
While the report offers comprehensive insights, it's advisable to review the specific contents or supplementary materials provided to ascertain if additional resources or data are available.
14. How can I stay updated on further developments or reports in the Silicon Photonics Modules?
To stay informed about further developments, trends, and reports in the Silicon Photonics Modules, consider subscribing to industry newsletters, following relevant companies and organizations, or regularly checking reputable industry news sources and publications.
Methodology
Step 1 - Identification of Relevant Samples Size from Population Database


Step 2 - Approaches for Defining Global Market Size (Value, Volume* & Price*)

Note*: In applicable scenarios
Step 3 - Data Sources
Primary Research
- Web Analytics
- Survey Reports
- Research Institute
- Latest Research Reports
- Opinion Leaders
Secondary Research
- Annual Reports
- White Paper
- Latest Press Release
- Industry Association
- Paid Database
- Investor Presentations

Step 4 - Data Triangulation
Involves using different sources of information in order to increase the validity of a study
These sources are likely to be stakeholders in a program - participants, other researchers, program staff, other community members, and so on.
Then we put all data in single framework & apply various statistical tools to find out the dynamic on the market.
During the analysis stage, feedback from the stakeholder groups would be compared to determine areas of agreement as well as areas of divergence