
Key Insights
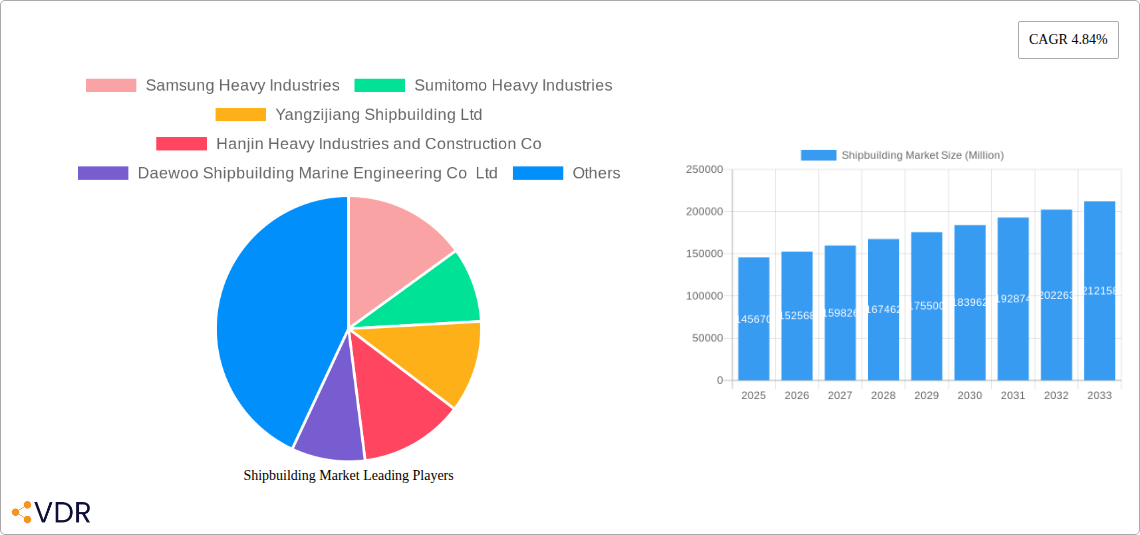
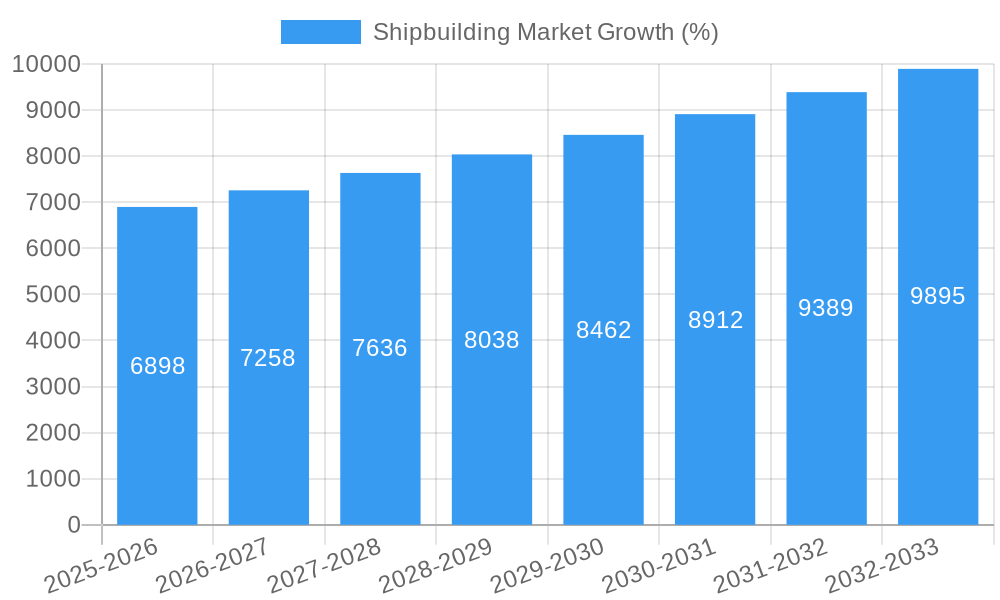
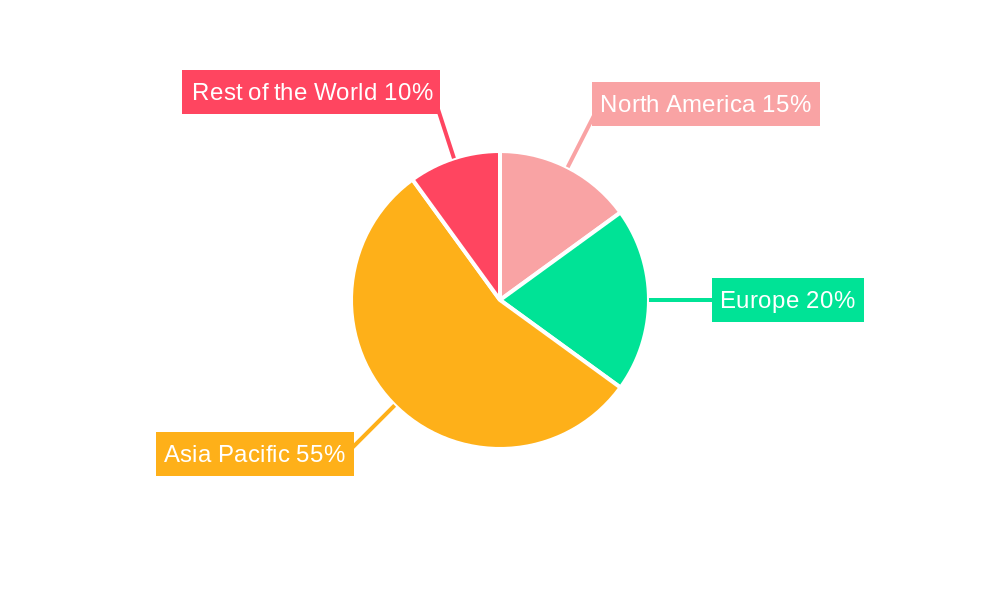
The global shipbuilding market, valued at $145.67 billion in 2025, is projected to experience robust growth, driven by increasing global trade volumes necessitating larger and more efficient vessels, and rising demand for specialized ships in sectors like offshore energy and cruise tourism. A compound annual growth rate (CAGR) of 4.84% from 2025 to 2033 indicates a significant expansion of the market, reaching an estimated value exceeding $220 billion by 2033. Key drivers include advancements in shipbuilding technology leading to improved fuel efficiency and reduced emissions, coupled with government investments in port infrastructure and maritime security. The market is segmented by vessel type (vessel, container, passenger, other) and end-user (transport companies, military, other), with container ships and transport companies currently dominating market share. However, growing concerns regarding environmental regulations and fluctuations in global commodity prices pose challenges to sustained growth. Asia-Pacific, particularly China, South Korea, and Japan, currently holds the largest market share, owing to established manufacturing capabilities and cost advantages. However, regions like North America and Europe are expected to show gradual growth driven by investments in renewable energy infrastructure and cruise tourism. Competition is intense, with major players like Samsung Heavy Industries, Hyundai Heavy Industries, and China State Shipbuilding Corporation vying for market leadership through technological innovation and strategic partnerships.
The shipbuilding industry faces both opportunities and challenges in the coming years. The demand for liquefied natural gas (LNG) carriers and other specialized vessels for the energy sector presents lucrative prospects. Furthermore, the increasing focus on sustainable shipbuilding practices—incorporating greener technologies and materials—will reshape the competitive landscape. Conversely, the market is vulnerable to geopolitical instability, which can disrupt global trade routes and impact demand. Supply chain disruptions and fluctuations in steel prices also present significant risks to profitability. Navigating these complexities effectively will be crucial for shipbuilding companies to maintain profitability and market share in the long term. Successful companies will be those that strategically adapt to evolving regulatory environments, embrace innovative technologies, and effectively manage operational costs.
Shipbuilding Market: A Comprehensive Report (2019-2033)
This comprehensive report provides an in-depth analysis of the global shipbuilding market, encompassing historical data (2019-2024), current estimates (2025), and future forecasts (2025-2033). It delves into market dynamics, growth trends, regional dominance, product landscapes, and key players, offering valuable insights for industry professionals, investors, and stakeholders. The report covers parent markets (Shipbuilding) and child markets (Vessel types: Container, Passenger, Other; End-users: Transport, Military, Other). The total market value in 2025 is estimated at xx Million.
Shipbuilding Market Dynamics & Structure
The shipbuilding market is characterized by a moderately concentrated structure, with key players like Samsung Heavy Industries, Sumitomo Heavy Industries, and Hyundai Heavy Industries holding significant market share (estimated at xx% combined in 2025). Technological innovation, particularly in areas like automation, green technologies (e.g., hydrogen-powered vessels), and advanced materials, is a major driver. Stringent regulatory frameworks concerning emissions and safety standards significantly influence market dynamics. Competitive pressures stem from substitute technologies in cargo transport (e.g., pipelines, air freight) and varying end-user preferences. Mergers and acquisitions (M&A) activity has been moderate in recent years, with approximately xx deals recorded between 2019 and 2024.
- Market Concentration: Oligopolistic, with top 5 players controlling xx% of market share in 2025.
- Technological Innovation: Focus on automation, AI, green technologies (e.g., LNG, hydrogen fuel cells), and digital twins.
- Regulatory Framework: IMO 2020, MARPOL Annex VI, and other environmental regulations drive technological change.
- Competitive Substitutes: Air freight, rail transport, and pipelines pose competition for certain cargo types.
- End-User Demographics: Growth driven by expanding global trade, rising demand for container ships, and military modernization programs.
- M&A Trends: Moderate activity, with a focus on consolidating capacity and gaining technological advantages (xx deals between 2019-2024).
Shipbuilding Market Growth Trends & Insights
The global shipbuilding market experienced a CAGR of xx% during the historical period (2019-2024), reaching an estimated value of xx Million in 2025. The forecast period (2025-2033) projects continued growth, driven by increased global trade volume, investments in naval modernization, and the transition towards environmentally friendly vessels. Market penetration of green technologies is expected to accelerate, with a projected xx% adoption rate by 2033. Consumer behavior shifts towards sustainability and efficiency will continue to influence vessel design and construction. Technological disruptions, such as the integration of AI and IoT, are streamlining operations and enhancing vessel performance.
Dominant Regions, Countries, or Segments in Shipbuilding Market
Asia continues to dominate the shipbuilding market, driven by strong manufacturing capacity in countries like China, South Korea, and Japan. The container vessel segment enjoys the highest market share (xx% in 2025), fueled by robust global trade growth. The military segment also contributes significantly, particularly due to increased defense spending in several countries.
Key Drivers:
- Asia's Manufacturing Hub: Cost-effective labor, robust infrastructure, and technological advancements in China, South Korea, and Japan.
- Global Trade Growth: Increased demand for container vessels to transport goods across continents.
- Military Modernization: Significant investments in naval capabilities by various countries.
- Government Policies: Subsidies and incentives promoting shipbuilding industries in certain regions.
Dominant Segments:
- Container Vessels: Largest market share due to increasing global trade volume.
- Military Vessels: Strong growth driven by increased defense spending worldwide.
- Asia: Dominates in terms of production volume and manufacturing capabilities.
Shipbuilding Market Product Landscape
The shipbuilding industry is witnessing a significant shift towards environmentally friendly vessels, incorporating advanced technologies such as LNG and hydrogen fuel cells. Automation is improving efficiency and reducing operational costs. Unique selling propositions center around fuel efficiency, reduced emissions, and advanced navigation systems. The use of lightweight and high-strength materials is enhancing performance and reducing overall weight.
Key Drivers, Barriers & Challenges in Shipbuilding Market
Key Drivers:
- Growing global trade and containerization.
- Increased military spending and naval modernization programs.
- Transition towards sustainable and environmentally friendly vessels.
- Technological advancements in shipbuilding and vessel operations.
Key Challenges:
- Fluctuations in commodity prices (steel, fuel).
- Supply chain disruptions and material shortages.
- Stringent environmental regulations and emission standards.
- Intense competition and price pressure.
Emerging Opportunities in Shipbuilding Market
- The growth of the offshore wind energy sector presents opportunities for specialized vessels.
- Demand for environmentally friendly vessels is driving innovation in alternative fuel technologies.
- Developing countries present untapped markets for shipbuilding and infrastructure projects.
- Advancements in automation and digitalization are creating opportunities for enhanced efficiency and safety.
Growth Accelerators in the Shipbuilding Market Industry
Technological breakthroughs in alternative fuel sources and automation are driving long-term growth. Strategic partnerships between shipbuilders, technology providers, and end-users foster innovation and market expansion. Government incentives and policies supporting green shipping further accelerate market development. Expansion into new markets, such as offshore wind and aquaculture, opens additional avenues for growth.
Key Players Shaping the Shipbuilding Market Market
- Samsung Heavy Industries
- Sumitomo Heavy Industries
- Yangzijiang Shipbuilding Ltd
- Hanjin Heavy Industries and Construction Co
- Daewoo Shipbuilding Marine Engineering Co Ltd
- Hyundai Heavy Industries Co Ltd
- China State Shipbuilding Corporation
- United Shipbuilding Corporation
- STX Group
- Mitsubishi Heavy Industries Ltd
Notable Milestones in Shipbuilding Market Sector
- August 2023: CAD 463 million (USD 345 million) investment by the Canadian government in shipbuilding infrastructure for the Surface Combatant (CSC) program (15 new warships).
- May 2023: Unveiling of the Vigilance Offshore Patrol Vessel by Vard Marine Inc. and partners.
- May 2023: Establishment of the GRSE Accelerated Innovation Nurturing Scheme (GAINS) by Garden Reach Shipbuilders and Engineers Ltd.
- March 2023: Launch of the 'Green Tug Transition Programme' (GTTP) by the Ministry of Ports, Shipping, and Waterways (MoPSW) in India.
In-Depth Shipbuilding Market Market Outlook
The shipbuilding market is poised for substantial growth over the next decade, driven by technological advancements, increased global trade, and a growing focus on sustainability. Strategic partnerships and investments in research and development will play a crucial role in shaping the future of the industry. The market presents significant opportunities for companies that can innovate, adapt to evolving regulations, and meet the growing demand for efficient and environmentally friendly vessels.
Shipbuilding Market Segmentation
-
1. Type
- 1.1. Vessel
- 1.2. Container
- 1.3. Passenger
- 1.4. Other Types
-
2. End User
- 2.1. Transport Companies
- 2.2. Military
- 2.3. Other End Users
Shipbuilding Market Segmentation By Geography
-
1. North America
- 1.1. United States
- 1.2. Canada
- 1.3. Rest of North America
-
2. Europe
- 2.1. Germany
- 2.2. United Kingdom
- 2.3. France
- 2.4. Rest of Europe
-
3. Asia Pacific
- 3.1. China
- 3.2. India
- 3.3. Japan
- 3.4. South Korea
- 3.5. Rest of Asia Pacific
-
4. Rest of the World
- 4.1. Brazil
- 4.2. Mexico
- 4.3. United Arab Emirates
- 4.4. Other Countries
Shipbuilding Market REPORT HIGHLIGHTS
| Aspects | Details |
|---|---|
| Study Period | 2019-2033 |
| Base Year | 2024 |
| Estimated Year | 2025 |
| Forecast Period | 2025-2033 |
| Historical Period | 2019-2024 |
| Growth Rate | CAGR of 4.84% from 2019-2033 |
| Segmentation |
|
Table of Contents
- 1. Introduction
- 1.1. Research Scope
- 1.2. Market Segmentation
- 1.3. Research Methodology
- 1.4. Definitions and Assumptions
- 2. Executive Summary
- 2.1. Introduction
- 3. Market Dynamics
- 3.1. Introduction
- 3.2. Market Drivers
- 3.2.1. Increasing Trade Activities Between Countries to Drive the Market
- 3.3. Market Restrains
- 3.3.1. Fluctuation in Transportation and Inventory Cost May Hamper the Growth of the Market
- 3.4. Market Trends
- 3.4.1. Increasing Trade and Naval Activities Between Countries to Drive the Market
- 4. Market Factor Analysis
- 4.1. Porters Five Forces
- 4.2. Supply/Value Chain
- 4.3. PESTEL analysis
- 4.4. Market Entropy
- 4.5. Patent/Trademark Analysis
- 5. Global Shipbuilding Market Analysis, Insights and Forecast, 2019-2031
- 5.1. Market Analysis, Insights and Forecast - by Type
- 5.1.1. Vessel
- 5.1.2. Container
- 5.1.3. Passenger
- 5.1.4. Other Types
- 5.2. Market Analysis, Insights and Forecast - by End User
- 5.2.1. Transport Companies
- 5.2.2. Military
- 5.2.3. Other End Users
- 5.3. Market Analysis, Insights and Forecast - by Region
- 5.3.1. North America
- 5.3.2. Europe
- 5.3.3. Asia Pacific
- 5.3.4. Rest of the World
- 5.1. Market Analysis, Insights and Forecast - by Type
- 6. North America Shipbuilding Market Analysis, Insights and Forecast, 2019-2031
- 6.1. Market Analysis, Insights and Forecast - by Type
- 6.1.1. Vessel
- 6.1.2. Container
- 6.1.3. Passenger
- 6.1.4. Other Types
- 6.2. Market Analysis, Insights and Forecast - by End User
- 6.2.1. Transport Companies
- 6.2.2. Military
- 6.2.3. Other End Users
- 6.1. Market Analysis, Insights and Forecast - by Type
- 7. Europe Shipbuilding Market Analysis, Insights and Forecast, 2019-2031
- 7.1. Market Analysis, Insights and Forecast - by Type
- 7.1.1. Vessel
- 7.1.2. Container
- 7.1.3. Passenger
- 7.1.4. Other Types
- 7.2. Market Analysis, Insights and Forecast - by End User
- 7.2.1. Transport Companies
- 7.2.2. Military
- 7.2.3. Other End Users
- 7.1. Market Analysis, Insights and Forecast - by Type
- 8. Asia Pacific Shipbuilding Market Analysis, Insights and Forecast, 2019-2031
- 8.1. Market Analysis, Insights and Forecast - by Type
- 8.1.1. Vessel
- 8.1.2. Container
- 8.1.3. Passenger
- 8.1.4. Other Types
- 8.2. Market Analysis, Insights and Forecast - by End User
- 8.2.1. Transport Companies
- 8.2.2. Military
- 8.2.3. Other End Users
- 8.1. Market Analysis, Insights and Forecast - by Type
- 9. Rest of the World Shipbuilding Market Analysis, Insights and Forecast, 2019-2031
- 9.1. Market Analysis, Insights and Forecast - by Type
- 9.1.1. Vessel
- 9.1.2. Container
- 9.1.3. Passenger
- 9.1.4. Other Types
- 9.2. Market Analysis, Insights and Forecast - by End User
- 9.2.1. Transport Companies
- 9.2.2. Military
- 9.2.3. Other End Users
- 9.1. Market Analysis, Insights and Forecast - by Type
- 10. North America Shipbuilding Market Analysis, Insights and Forecast, 2019-2031
- 10.1. Market Analysis, Insights and Forecast - By Country/Sub-region
- 10.1.1 United States
- 10.1.2 Canada
- 10.1.3 Rest of North America
- 11. Europe Shipbuilding Market Analysis, Insights and Forecast, 2019-2031
- 11.1. Market Analysis, Insights and Forecast - By Country/Sub-region
- 11.1.1 Germany
- 11.1.2 United Kingdom
- 11.1.3 France
- 11.1.4 Rest of Europe
- 12. Asia Pacific Shipbuilding Market Analysis, Insights and Forecast, 2019-2031
- 12.1. Market Analysis, Insights and Forecast - By Country/Sub-region
- 12.1.1 China
- 12.1.2 India
- 12.1.3 Japan
- 12.1.4 South Korea
- 12.1.5 Rest of Asia Pacific
- 13. Rest of the World Shipbuilding Market Analysis, Insights and Forecast, 2019-2031
- 13.1. Market Analysis, Insights and Forecast - By Country/Sub-region
- 13.1.1 Brazil
- 13.1.2 Mexico
- 13.1.3 United Arab Emirates
- 13.1.4 Other Countries
- 14. Competitive Analysis
- 14.1. Global Market Share Analysis 2024
- 14.2. Company Profiles
- 14.2.1 Samsung Heavy Industries
- 14.2.1.1. Overview
- 14.2.1.2. Products
- 14.2.1.3. SWOT Analysis
- 14.2.1.4. Recent Developments
- 14.2.1.5. Financials (Based on Availability)
- 14.2.2 Sumitomo Heavy Industries
- 14.2.2.1. Overview
- 14.2.2.2. Products
- 14.2.2.3. SWOT Analysis
- 14.2.2.4. Recent Developments
- 14.2.2.5. Financials (Based on Availability)
- 14.2.3 Yangzijiang Shipbuilding Ltd
- 14.2.3.1. Overview
- 14.2.3.2. Products
- 14.2.3.3. SWOT Analysis
- 14.2.3.4. Recent Developments
- 14.2.3.5. Financials (Based on Availability)
- 14.2.4 Hanjin Heavy Industries and Construction Co
- 14.2.4.1. Overview
- 14.2.4.2. Products
- 14.2.4.3. SWOT Analysis
- 14.2.4.4. Recent Developments
- 14.2.4.5. Financials (Based on Availability)
- 14.2.5 Daewoo Shipbuilding Marine Engineering Co Ltd
- 14.2.5.1. Overview
- 14.2.5.2. Products
- 14.2.5.3. SWOT Analysis
- 14.2.5.4. Recent Developments
- 14.2.5.5. Financials (Based on Availability)
- 14.2.6 Hyundai Heavy Industries Co Ltd
- 14.2.6.1. Overview
- 14.2.6.2. Products
- 14.2.6.3. SWOT Analysis
- 14.2.6.4. Recent Developments
- 14.2.6.5. Financials (Based on Availability)
- 14.2.7 China State Shipbuilding Corporation
- 14.2.7.1. Overview
- 14.2.7.2. Products
- 14.2.7.3. SWOT Analysis
- 14.2.7.4. Recent Developments
- 14.2.7.5. Financials (Based on Availability)
- 14.2.8 United Shipbuilding Corporation
- 14.2.8.1. Overview
- 14.2.8.2. Products
- 14.2.8.3. SWOT Analysis
- 14.2.8.4. Recent Developments
- 14.2.8.5. Financials (Based on Availability)
- 14.2.9 STX Group*List Not Exhaustive
- 14.2.9.1. Overview
- 14.2.9.2. Products
- 14.2.9.3. SWOT Analysis
- 14.2.9.4. Recent Developments
- 14.2.9.5. Financials (Based on Availability)
- 14.2.10 Mitsubishi Heavy Industries Ltd
- 14.2.10.1. Overview
- 14.2.10.2. Products
- 14.2.10.3. SWOT Analysis
- 14.2.10.4. Recent Developments
- 14.2.10.5. Financials (Based on Availability)
- 14.2.1 Samsung Heavy Industries
List of Figures
- Figure 1: Global Shipbuilding Market Revenue Breakdown (Million, %) by Region 2024 & 2032
- Figure 2: North America Shipbuilding Market Revenue (Million), by Country 2024 & 2032
- Figure 3: North America Shipbuilding Market Revenue Share (%), by Country 2024 & 2032
- Figure 4: Europe Shipbuilding Market Revenue (Million), by Country 2024 & 2032
- Figure 5: Europe Shipbuilding Market Revenue Share (%), by Country 2024 & 2032
- Figure 6: Asia Pacific Shipbuilding Market Revenue (Million), by Country 2024 & 2032
- Figure 7: Asia Pacific Shipbuilding Market Revenue Share (%), by Country 2024 & 2032
- Figure 8: Rest of the World Shipbuilding Market Revenue (Million), by Country 2024 & 2032
- Figure 9: Rest of the World Shipbuilding Market Revenue Share (%), by Country 2024 & 2032
- Figure 10: North America Shipbuilding Market Revenue (Million), by Type 2024 & 2032
- Figure 11: North America Shipbuilding Market Revenue Share (%), by Type 2024 & 2032
- Figure 12: North America Shipbuilding Market Revenue (Million), by End User 2024 & 2032
- Figure 13: North America Shipbuilding Market Revenue Share (%), by End User 2024 & 2032
- Figure 14: North America Shipbuilding Market Revenue (Million), by Country 2024 & 2032
- Figure 15: North America Shipbuilding Market Revenue Share (%), by Country 2024 & 2032
- Figure 16: Europe Shipbuilding Market Revenue (Million), by Type 2024 & 2032
- Figure 17: Europe Shipbuilding Market Revenue Share (%), by Type 2024 & 2032
- Figure 18: Europe Shipbuilding Market Revenue (Million), by End User 2024 & 2032
- Figure 19: Europe Shipbuilding Market Revenue Share (%), by End User 2024 & 2032
- Figure 20: Europe Shipbuilding Market Revenue (Million), by Country 2024 & 2032
- Figure 21: Europe Shipbuilding Market Revenue Share (%), by Country 2024 & 2032
- Figure 22: Asia Pacific Shipbuilding Market Revenue (Million), by Type 2024 & 2032
- Figure 23: Asia Pacific Shipbuilding Market Revenue Share (%), by Type 2024 & 2032
- Figure 24: Asia Pacific Shipbuilding Market Revenue (Million), by End User 2024 & 2032
- Figure 25: Asia Pacific Shipbuilding Market Revenue Share (%), by End User 2024 & 2032
- Figure 26: Asia Pacific Shipbuilding Market Revenue (Million), by Country 2024 & 2032
- Figure 27: Asia Pacific Shipbuilding Market Revenue Share (%), by Country 2024 & 2032
- Figure 28: Rest of the World Shipbuilding Market Revenue (Million), by Type 2024 & 2032
- Figure 29: Rest of the World Shipbuilding Market Revenue Share (%), by Type 2024 & 2032
- Figure 30: Rest of the World Shipbuilding Market Revenue (Million), by End User 2024 & 2032
- Figure 31: Rest of the World Shipbuilding Market Revenue Share (%), by End User 2024 & 2032
- Figure 32: Rest of the World Shipbuilding Market Revenue (Million), by Country 2024 & 2032
- Figure 33: Rest of the World Shipbuilding Market Revenue Share (%), by Country 2024 & 2032
List of Tables
- Table 1: Global Shipbuilding Market Revenue Million Forecast, by Region 2019 & 2032
- Table 2: Global Shipbuilding Market Revenue Million Forecast, by Type 2019 & 2032
- Table 3: Global Shipbuilding Market Revenue Million Forecast, by End User 2019 & 2032
- Table 4: Global Shipbuilding Market Revenue Million Forecast, by Region 2019 & 2032
- Table 5: Global Shipbuilding Market Revenue Million Forecast, by Country 2019 & 2032
- Table 6: United States Shipbuilding Market Revenue (Million) Forecast, by Application 2019 & 2032
- Table 7: Canada Shipbuilding Market Revenue (Million) Forecast, by Application 2019 & 2032
- Table 8: Rest of North America Shipbuilding Market Revenue (Million) Forecast, by Application 2019 & 2032
- Table 9: Global Shipbuilding Market Revenue Million Forecast, by Country 2019 & 2032
- Table 10: Germany Shipbuilding Market Revenue (Million) Forecast, by Application 2019 & 2032
- Table 11: United Kingdom Shipbuilding Market Revenue (Million) Forecast, by Application 2019 & 2032
- Table 12: France Shipbuilding Market Revenue (Million) Forecast, by Application 2019 & 2032
- Table 13: Rest of Europe Shipbuilding Market Revenue (Million) Forecast, by Application 2019 & 2032
- Table 14: Global Shipbuilding Market Revenue Million Forecast, by Country 2019 & 2032
- Table 15: China Shipbuilding Market Revenue (Million) Forecast, by Application 2019 & 2032
- Table 16: India Shipbuilding Market Revenue (Million) Forecast, by Application 2019 & 2032
- Table 17: Japan Shipbuilding Market Revenue (Million) Forecast, by Application 2019 & 2032
- Table 18: South Korea Shipbuilding Market Revenue (Million) Forecast, by Application 2019 & 2032
- Table 19: Rest of Asia Pacific Shipbuilding Market Revenue (Million) Forecast, by Application 2019 & 2032
- Table 20: Global Shipbuilding Market Revenue Million Forecast, by Country 2019 & 2032
- Table 21: Brazil Shipbuilding Market Revenue (Million) Forecast, by Application 2019 & 2032
- Table 22: Mexico Shipbuilding Market Revenue (Million) Forecast, by Application 2019 & 2032
- Table 23: United Arab Emirates Shipbuilding Market Revenue (Million) Forecast, by Application 2019 & 2032
- Table 24: Other Countries Shipbuilding Market Revenue (Million) Forecast, by Application 2019 & 2032
- Table 25: Global Shipbuilding Market Revenue Million Forecast, by Type 2019 & 2032
- Table 26: Global Shipbuilding Market Revenue Million Forecast, by End User 2019 & 2032
- Table 27: Global Shipbuilding Market Revenue Million Forecast, by Country 2019 & 2032
- Table 28: United States Shipbuilding Market Revenue (Million) Forecast, by Application 2019 & 2032
- Table 29: Canada Shipbuilding Market Revenue (Million) Forecast, by Application 2019 & 2032
- Table 30: Rest of North America Shipbuilding Market Revenue (Million) Forecast, by Application 2019 & 2032
- Table 31: Global Shipbuilding Market Revenue Million Forecast, by Type 2019 & 2032
- Table 32: Global Shipbuilding Market Revenue Million Forecast, by End User 2019 & 2032
- Table 33: Global Shipbuilding Market Revenue Million Forecast, by Country 2019 & 2032
- Table 34: Germany Shipbuilding Market Revenue (Million) Forecast, by Application 2019 & 2032
- Table 35: United Kingdom Shipbuilding Market Revenue (Million) Forecast, by Application 2019 & 2032
- Table 36: France Shipbuilding Market Revenue (Million) Forecast, by Application 2019 & 2032
- Table 37: Rest of Europe Shipbuilding Market Revenue (Million) Forecast, by Application 2019 & 2032
- Table 38: Global Shipbuilding Market Revenue Million Forecast, by Type 2019 & 2032
- Table 39: Global Shipbuilding Market Revenue Million Forecast, by End User 2019 & 2032
- Table 40: Global Shipbuilding Market Revenue Million Forecast, by Country 2019 & 2032
- Table 41: China Shipbuilding Market Revenue (Million) Forecast, by Application 2019 & 2032
- Table 42: India Shipbuilding Market Revenue (Million) Forecast, by Application 2019 & 2032
- Table 43: Japan Shipbuilding Market Revenue (Million) Forecast, by Application 2019 & 2032
- Table 44: South Korea Shipbuilding Market Revenue (Million) Forecast, by Application 2019 & 2032
- Table 45: Rest of Asia Pacific Shipbuilding Market Revenue (Million) Forecast, by Application 2019 & 2032
- Table 46: Global Shipbuilding Market Revenue Million Forecast, by Type 2019 & 2032
- Table 47: Global Shipbuilding Market Revenue Million Forecast, by End User 2019 & 2032
- Table 48: Global Shipbuilding Market Revenue Million Forecast, by Country 2019 & 2032
- Table 49: Brazil Shipbuilding Market Revenue (Million) Forecast, by Application 2019 & 2032
- Table 50: Mexico Shipbuilding Market Revenue (Million) Forecast, by Application 2019 & 2032
- Table 51: United Arab Emirates Shipbuilding Market Revenue (Million) Forecast, by Application 2019 & 2032
- Table 52: Other Countries Shipbuilding Market Revenue (Million) Forecast, by Application 2019 & 2032
Frequently Asked Questions
1. What is the projected Compound Annual Growth Rate (CAGR) of the Shipbuilding Market?
The projected CAGR is approximately 4.84%.
2. Which companies are prominent players in the Shipbuilding Market?
Key companies in the market include Samsung Heavy Industries, Sumitomo Heavy Industries, Yangzijiang Shipbuilding Ltd, Hanjin Heavy Industries and Construction Co, Daewoo Shipbuilding Marine Engineering Co Ltd, Hyundai Heavy Industries Co Ltd, China State Shipbuilding Corporation, United Shipbuilding Corporation, STX Group*List Not Exhaustive, Mitsubishi Heavy Industries Ltd.
3. What are the main segments of the Shipbuilding Market?
The market segments include Type, End User.
4. Can you provide details about the market size?
The market size is estimated to be USD 145.67 Million as of 2022.
5. What are some drivers contributing to market growth?
Increasing Trade Activities Between Countries to Drive the Market.
6. What are the notable trends driving market growth?
Increasing Trade and Naval Activities Between Countries to Drive the Market.
7. Are there any restraints impacting market growth?
Fluctuation in Transportation and Inventory Cost May Hamper the Growth of the Market.
8. Can you provide examples of recent developments in the market?
August 2023: The Canadian government announced that it would invest CAD 463 million (USD 345 million) in shipbuilding infrastructure to move forward with the Surface Combatant (CSC) program. It calls for the construction of 15 new warships that will be a key component of the future Royal Canadian Navy. The funds will be used to prepare the Irving Shipyard and adjacent facilities in Nova Scotia for construction, which is now slated to begin next year for the program.
9. What pricing options are available for accessing the report?
Pricing options include single-user, multi-user, and enterprise licenses priced at USD 4750, USD 5250, and USD 8750 respectively.
10. Is the market size provided in terms of value or volume?
The market size is provided in terms of value, measured in Million.
11. Are there any specific market keywords associated with the report?
Yes, the market keyword associated with the report is "Shipbuilding Market," which aids in identifying and referencing the specific market segment covered.
12. How do I determine which pricing option suits my needs best?
The pricing options vary based on user requirements and access needs. Individual users may opt for single-user licenses, while businesses requiring broader access may choose multi-user or enterprise licenses for cost-effective access to the report.
13. Are there any additional resources or data provided in the Shipbuilding Market report?
While the report offers comprehensive insights, it's advisable to review the specific contents or supplementary materials provided to ascertain if additional resources or data are available.
14. How can I stay updated on further developments or reports in the Shipbuilding Market?
To stay informed about further developments, trends, and reports in the Shipbuilding Market, consider subscribing to industry newsletters, following relevant companies and organizations, or regularly checking reputable industry news sources and publications.
Methodology
Step 1 - Identification of Relevant Samples Size from Population Database


Step 2 - Approaches for Defining Global Market Size (Value, Volume* & Price*)

Note*: In applicable scenarios
Step 3 - Data Sources
Primary Research
- Web Analytics
- Survey Reports
- Research Institute
- Latest Research Reports
- Opinion Leaders
Secondary Research
- Annual Reports
- White Paper
- Latest Press Release
- Industry Association
- Paid Database
- Investor Presentations

Step 4 - Data Triangulation
Involves using different sources of information in order to increase the validity of a study
These sources are likely to be stakeholders in a program - participants, other researchers, program staff, other community members, and so on.
Then we put all data in single framework & apply various statistical tools to find out the dynamic on the market.
During the analysis stage, feedback from the stakeholder groups would be compared to determine areas of agreement as well as areas of divergence


