

Key Insights
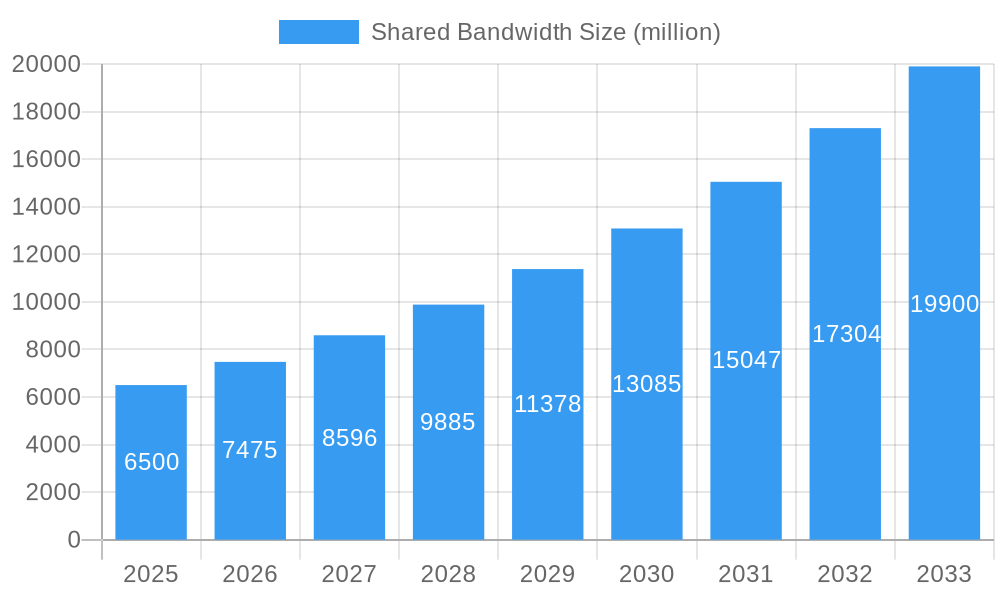
The Shared Bandwidth market is experiencing robust growth, projected to reach approximately $6,500 million by 2025, with an anticipated Compound Annual Growth Rate (CAGR) of 15% through 2033. This upward trajectory is primarily fueled by the escalating demand for scalable and cost-effective internet solutions across diverse business sectors. The increasing adoption of cloud computing services, the proliferation of data-intensive applications, and the growing need for reliable connectivity for remote workforces are significant drivers. Small and Medium Enterprises (SMEs) are increasingly leveraging shared bandwidth solutions to access high-speed internet without the substantial capital expenditure associated with dedicated lines, making it an attractive option for their growth and operational efficiency. Furthermore, the continuous evolution of digital infrastructure and the expanding digital economy are creating new avenues for shared bandwidth services to support burgeoning online activities.
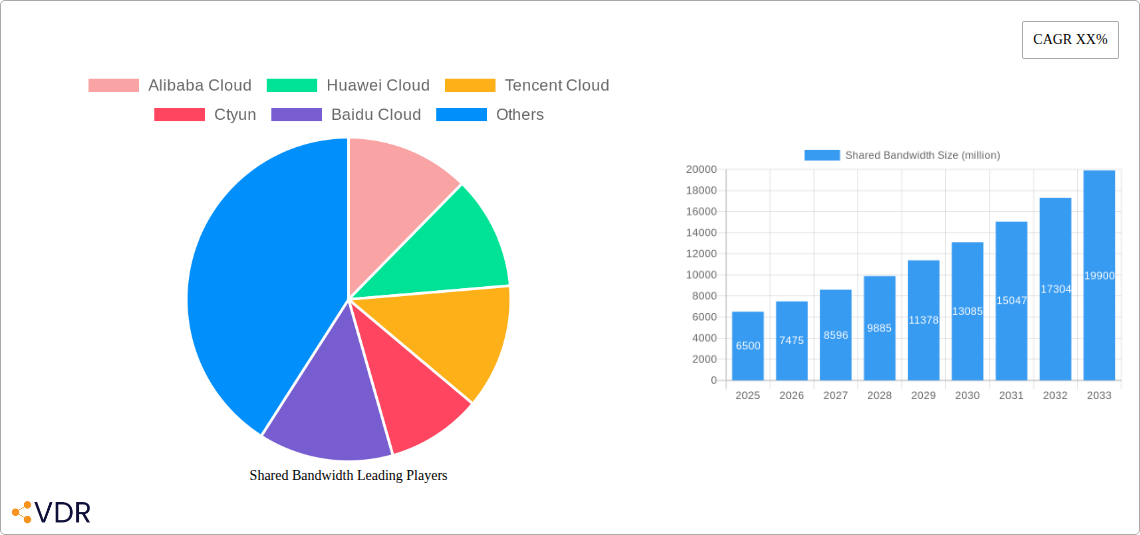
Shared Bandwidth Market Size (In Billion)
The market's expansion is further bolstered by key trends such as the integration of AI and machine learning for network optimization, leading to enhanced performance and resource allocation. The rise of edge computing also necessitates efficient bandwidth management, which shared solutions are well-equipped to provide. Prepaid and postpaid models are catering to a wide spectrum of user preferences, from flexible pay-as-you-go options to structured, long-term commitments, thereby broadening the market's reach. While the market presents a dynamic landscape, potential restraints include concerns regarding service quality consistency and security in highly shared environments, as well as the competitive pressure from dedicated bandwidth providers for larger enterprises. Nonetheless, the inherent cost-effectiveness and scalability of shared bandwidth position it for sustained dominance in serving a broad range of businesses.
Shared Bandwidth Company Market Share
Shared Bandwidth Market Dynamics & Structure
The global shared bandwidth market exhibits a moderately concentrated structure, with a blend of established cloud giants and emerging specialized providers vying for market share. Technological innovation remains a pivotal driver, fueled by advancements in network virtualization, Software-Defined Networking (SDN), and edge computing, enabling more efficient resource allocation and dynamic bandwidth provisioning. Regulatory frameworks, while evolving, are largely supportive of infrastructure development and data localization requirements, indirectly influencing shared bandwidth adoption. Competitive product substitutes, primarily dedicated bandwidth solutions, cater to specific high-demand niches, yet the cost-effectiveness and flexibility of shared bandwidth continue to attract a broad user base. End-user demographics are expanding beyond traditional large enterprises to include a significant surge in Small and Medium-sized Enterprises (SMEs) leveraging shared solutions for cost-efficient scalability. Mergers and acquisitions (M&A) activity, while not at peak levels, remains a strategic tool for consolidation and service diversification.
- Market Concentration: Dominated by a few large cloud providers, with increasing presence of specialized shared bandwidth vendors.
- Technological Innovation: Driven by SDN, network function virtualization (NFV), and edge computing technologies.
- Regulatory Landscape: Generally supportive of digital infrastructure, with varying data residency mandates influencing service delivery.
- Competitive Substitutes: Dedicated bandwidth, VPNs, and private networks present alternatives for specific use cases.
- End-User Demographics: Expanding from large enterprises to a significant influx of SMEs.
- M&A Trends: Ongoing, focused on expanding service portfolios and geographic reach.
Shared Bandwidth Growth Trends & Insights
The shared bandwidth market is poised for substantial expansion, driven by escalating digital transformation initiatives across industries and the burgeoning demand for scalable, cost-effective internet connectivity. The market size is projected to witness a robust Compound Annual Growth Rate (CAGR) of 15.8% from 2025 to 2033, culminating in a market value of $85,500 million by the end of the forecast period. This impressive growth is underpinned by increasing adoption rates, particularly among SMEs who find shared bandwidth solutions to be an accessible entry point into robust online operations without prohibitive upfront investments. Technological disruptions are actively reshaping the landscape; the widespread adoption of cloud-native applications, the proliferation of IoT devices, and the increasing reliance on real-time data processing necessitate agile and on-demand bandwidth provisioning, which shared solutions excel at delivering. Consumer behavior shifts are also playing a crucial role. Businesses are increasingly prioritizing flexibility and operational agility, opting for service models that allow for rapid scaling of resources in response to fluctuating demand. The continuous improvement in network infrastructure, including the rollout of 5G and advancements in fiber optics, further enhances the performance and reliability of shared bandwidth, making it a more attractive proposition. Market penetration is expected to deepen as more organizations recognize the economic benefits and operational efficiencies offered by shared bandwidth. The study period from 2019 to 2033, with a base year of 2025, provides a comprehensive view of this evolution, from initial adoption trends in the historical period (2019-2024) to the projected accelerated growth in the forecast period. The estimated market size for 2025 stands at $28,500 million, setting a strong foundation for the subsequent expansion. This growth trajectory signifies a fundamental shift in how organizations approach network connectivity, prioritizing dynamic resource management over fixed infrastructure.
Dominant Regions, Countries, or Segments in Shared Bandwidth
The Asia Pacific region is emerging as the dominant force in the global shared bandwidth market, driven by a confluence of rapid economic development, burgeoning digital economies, and significant government investments in digital infrastructure. Within this region, China stands out as a key country, propelled by its massive domestic market, the presence of major cloud service providers, and aggressive promotion of digital transformation across its industrial sectors. The Application segment of Large Enterprises currently represents a substantial portion of market share, benefiting from their extensive IT infrastructure and the critical need for scalable, reliable bandwidth to support complex operations, global collaborations, and massive data flows. However, the SMEs segment is exhibiting the fastest growth rate, as these businesses increasingly leverage shared bandwidth to compete effectively in the digital marketplace without the burden of high capital expenditure. In terms of Types, the Postpaid model is gaining significant traction, offering businesses predictable monthly costs and the ability to scale services as needed, aligning with flexible operational budgeting. Prepaid options remain relevant for smaller, more sporadic usage needs. Key drivers of dominance in this region and within these segments include strong economic policies fostering technology adoption, robust telecommunications infrastructure development, and a growing pool of digitally-savvy businesses. The sheer volume of internet users and the rapid adoption of cloud services contribute significantly to the market's expansion. Furthermore, the competitive landscape, while intense, fosters innovation, leading to more competitive pricing and advanced service offerings in shared bandwidth solutions. The market share of the Asia Pacific region is projected to exceed 40% by 2033, with China alone accounting for nearly 20%. The growth potential in the SMEs segment is particularly noteworthy, as many of these businesses are still in the early stages of digital integration, presenting a vast untapped market for shared bandwidth providers. The increasing adoption of advanced analytics, AI, and IoT applications by large enterprises further solidifies their reliance on robust and scalable bandwidth solutions, thus contributing to their sustained market presence.
- Leading Region: Asia Pacific, driven by rapid economic growth and digital adoption.
- Key Country: China, with its vast market and strong government support for digital transformation.
- Dominant Application Segment: Large Enterprises, due to extensive IT needs.
- Fastest Growing Application Segment: SMEs, attracted by cost-effectiveness and scalability.
- Preferred Type: Postpaid, offering flexible pricing and scalability for businesses.
- Key Drivers: Favorable economic policies, advanced telecommunications infrastructure, government initiatives for digital transformation.
Shared Bandwidth Product Landscape
Shared bandwidth solutions are characterized by their dynamic provisioning capabilities and cost-effectiveness, offering scalable internet access without the need for dedicated infrastructure. Innovations focus on enhancing performance through advanced Quality of Service (QoS) mechanisms, intelligent traffic management, and seamless integration with cloud platforms. Performance metrics such as latency reduction and throughput optimization are key differentiators. Unique selling propositions include the ability for users to scale bandwidth up or down in real-time, adapting to fluctuating demand, and the pay-as-you-go pricing models that significantly reduce operational expenses for businesses. Technological advancements are leading to more intelligent self-healing network capabilities and enhanced security features within shared bandwidth offerings, ensuring reliability and data protection.
Key Drivers, Barriers & Challenges in Shared Bandwidth
Key Drivers: The shared bandwidth market is propelled by the imperative for cost-effective scalability, enabling businesses of all sizes to access robust internet connectivity without significant upfront capital investment. The accelerating pace of digital transformation, the widespread adoption of cloud services, and the burgeoning demand for real-time data processing and collaboration are significant technological and economic drivers. Government initiatives promoting digital infrastructure and innovation further fuel market growth.
Key Barriers & Challenges: Supply chain disruptions, though less prominent now than in previous years, can still impact the deployment of underlying network infrastructure. Regulatory hurdles, particularly those related to data sovereignty and cross-border data flow, can add complexity. Fierce competitive pressures from dedicated bandwidth providers and the ongoing need to demonstrate the reliability and security of shared solutions are also significant challenges. For instance, ensuring consistent performance for latency-sensitive applications remains a concern for some enterprise users, requiring sophisticated network management techniques.
Emerging Opportunities in Shared Bandwidth
Emerging opportunities in the shared bandwidth sector lie in the increasing demand for edge computing infrastructure, which requires localized and responsive bandwidth solutions. The expansion of the Internet of Things (IoT) ecosystem presents a vast market for connecting a multitude of devices efficiently. Furthermore, the development of specialized shared bandwidth offerings tailored for specific industries, such as healthcare (telemedicine) or remote education, presents untapped markets. Evolving consumer preferences for seamless digital experiences also create opportunities for providers who can guarantee consistent and high-quality bandwidth.
Growth Accelerators in the Shared Bandwidth Industry
Growth accelerators in the shared bandwidth industry are primarily centered around technological breakthroughs and strategic market expansion. The continuous evolution of network virtualization technologies, including advancements in 5G network slicing, allows for more granular control and dedicated performance within shared environments, effectively blurring the lines with dedicated services. Strategic partnerships between cloud providers, telecommunications companies, and content delivery networks (CDNs) are crucial for expanding reach and offering bundled solutions that enhance value proposition. Furthermore, the aggressive expansion of digital infrastructure in emerging economies and the increasing adoption of hybrid and multi-cloud strategies by enterprises will significantly drive the demand for flexible and scalable shared bandwidth.
Key Players Shaping the Shared Bandwidth Market
- Alibaba Cloud
- Huawei Cloud
- Tencent Cloud
- Ctyun
- Baidu Cloud
- Kacific
- Volcano Engine (ByteDance)
- AWS (Amazon Web Services)
- Microsoft Azure
- China Unicom Cloud
- Mobile Cloud
Notable Milestones in Shared Bandwidth Sector
- 2020 - Q3: Alibaba Cloud launches enhanced shared bandwidth offerings for SMEs, focusing on simplified management and tiered pricing.
- 2021 - Q1: AWS introduces new bandwidth optimization features for its cloud services, indirectly benefiting shared bandwidth users.
- 2021 - Q4: Huawei Cloud expands its shared bandwidth services across Southeast Asia, targeting growing digital economies.
- 2022 - Q2: Tencent Cloud announces strategic partnerships with regional ISPs to bolster its shared bandwidth infrastructure.
- 2023 - Q1: Volcano Engine (ByteDance) intensifies its focus on shared bandwidth solutions for enterprise clients in the gaming and media sectors.
- 2023 - Q4: Kacific expands its satellite-based shared bandwidth services to remote regions in the Pacific.
- 2024 - Q2: Ctyun and Baidu Cloud announce joint efforts to improve inter-cloud shared bandwidth capabilities.
In-Depth Shared Bandwidth Market Outlook
The future of the shared bandwidth market is exceptionally bright, driven by the sustained global push towards digitalization and the inherent advantages of flexible, cost-effective connectivity. Growth accelerators such as the maturation of 5G network slicing technologies and the increasing reliance on edge computing will empower providers to offer near-dedicated performance levels within shared frameworks. Strategic partnerships between key industry players will continue to expand market reach and service integration, creating more comprehensive solutions for businesses. The ongoing digital transformation in emerging markets represents a significant untapped potential, promising robust demand for scalable bandwidth. Overall, the market outlook is characterized by innovation, strategic alliances, and a continuous expansion of accessible, high-performance bandwidth solutions for a diverse range of end-users.
Shared Bandwidth Segmentation
-
1. Application
- 1.1. Large Enterprises
- 1.2. SMEs
-
2. Types
- 2.1. Prepaid
- 2.2. Postpaid
Shared Bandwidth Segmentation By Geography
-
1. North America
- 1.1. United States
- 1.2. Canada
- 1.3. Mexico
-
2. South America
- 2.1. Brazil
- 2.2. Argentina
- 2.3. Rest of South America
-
3. Europe
- 3.1. United Kingdom
- 3.2. Germany
- 3.3. France
- 3.4. Italy
- 3.5. Spain
- 3.6. Russia
- 3.7. Benelux
- 3.8. Nordics
- 3.9. Rest of Europe
-
4. Middle East & Africa
- 4.1. Turkey
- 4.2. Israel
- 4.3. GCC
- 4.4. North Africa
- 4.5. South Africa
- 4.6. Rest of Middle East & Africa
-
5. Asia Pacific
- 5.1. China
- 5.2. India
- 5.3. Japan
- 5.4. South Korea
- 5.5. ASEAN
- 5.6. Oceania
- 5.7. Rest of Asia Pacific
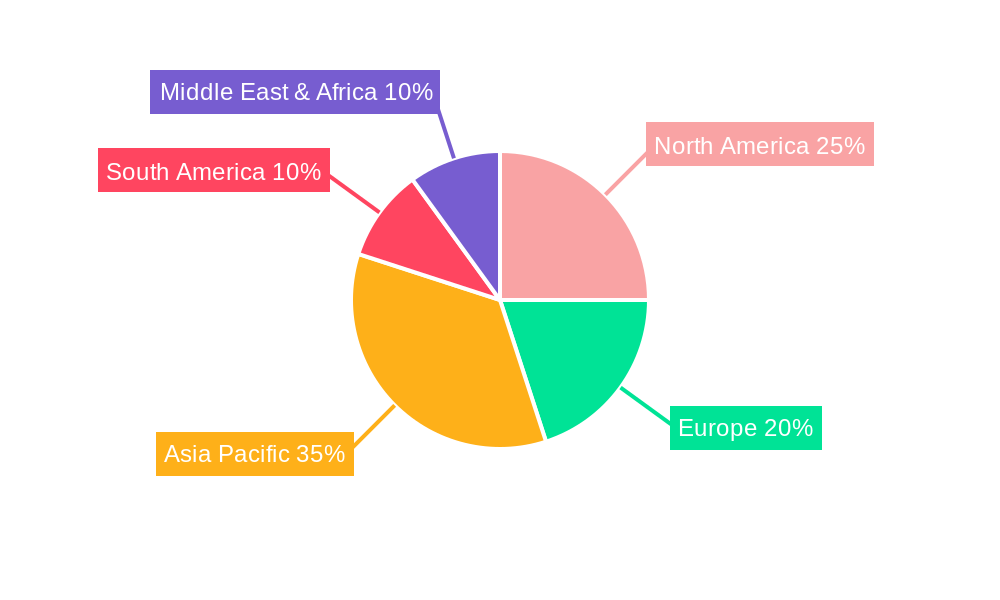
Shared Bandwidth Regional Market Share
Geographic Coverage of Shared Bandwidth
Shared Bandwidth REPORT HIGHLIGHTS
| Aspects | Details |
|---|---|
| Study Period | 2020-2034 |
| Base Year | 2025 |
| Estimated Year | 2026 |
| Forecast Period | 2026-2034 |
| Historical Period | 2020-2025 |
| Growth Rate | CAGR of 18.1% from 2020-2034 |
| Segmentation |
|
Table of Contents
- 1. Introduction
- 1.1. Research Scope
- 1.2. Market Segmentation
- 1.3. Research Objective
- 1.4. Definitions and Assumptions
- 2. Executive Summary
- 2.1. Market Snapshot
- 3. Market Dynamics
- 3.1. Market Drivers
- 3.2. Market Restrains
- 3.3. Market Trends
- 3.4. Market Opportunities
- 4. Market Factor Analysis
- 4.1. Porters Five Forces
- 4.1.1. Bargaining Power of Suppliers
- 4.1.2. Bargaining Power of Buyers
- 4.1.3. Threat of New Entrants
- 4.1.4. Threat of Substitutes
- 4.1.5. Competitive Rivalry
- 4.2. PESTEL analysis
- 4.3. BCG Analysis
- 4.3.1. Stars (High Growth, High Market Share)
- 4.3.2. Cash Cows (Low Growth, High Market Share)
- 4.3.3. Question Mark (High Growth, Low Market Share)
- 4.3.4. Dogs (Low Growth, Low Market Share)
- 4.4. Ansoff Matrix Analysis
- 4.5. Supply Chain Analysis
- 4.6. Regulatory Landscape
- 4.7. Current Market Potential and Opportunity Assessment (TAM–SAM–SOM Framework)
- 4.8. VDR Analyst Note
- 4.1. Porters Five Forces
- 5. Market Analysis, Insights and Forecast 2021-2033
- 5.1. Market Analysis, Insights and Forecast - by Application
- 5.1.1. Large Enterprises
- 5.1.2. SMEs
- 5.2. Market Analysis, Insights and Forecast - by Types
- 5.2.1. Prepaid
- 5.2.2. Postpaid
- 5.3. Market Analysis, Insights and Forecast - by Region
- 5.3.1. North America
- 5.3.2. South America
- 5.3.3. Europe
- 5.3.4. Middle East & Africa
- 5.3.5. Asia Pacific
- 5.1. Market Analysis, Insights and Forecast - by Application
- 6. Global Shared Bandwidth Analysis, Insights and Forecast, 2021-2033
- 6.1. Market Analysis, Insights and Forecast - by Application
- 6.1.1. Large Enterprises
- 6.1.2. SMEs
- 6.2. Market Analysis, Insights and Forecast - by Types
- 6.2.1. Prepaid
- 6.2.2. Postpaid
- 6.1. Market Analysis, Insights and Forecast - by Application
- 7. North America Shared Bandwidth Analysis, Insights and Forecast, 2021-2033
- 7.1. Market Analysis, Insights and Forecast - by Application
- 7.1.1. Large Enterprises
- 7.1.2. SMEs
- 7.2. Market Analysis, Insights and Forecast - by Types
- 7.2.1. Prepaid
- 7.2.2. Postpaid
- 7.1. Market Analysis, Insights and Forecast - by Application
- 8. South America Shared Bandwidth Analysis, Insights and Forecast, 2021-2033
- 8.1. Market Analysis, Insights and Forecast - by Application
- 8.1.1. Large Enterprises
- 8.1.2. SMEs
- 8.2. Market Analysis, Insights and Forecast - by Types
- 8.2.1. Prepaid
- 8.2.2. Postpaid
- 8.1. Market Analysis, Insights and Forecast - by Application
- 9. Europe Shared Bandwidth Analysis, Insights and Forecast, 2021-2033
- 9.1. Market Analysis, Insights and Forecast - by Application
- 9.1.1. Large Enterprises
- 9.1.2. SMEs
- 9.2. Market Analysis, Insights and Forecast - by Types
- 9.2.1. Prepaid
- 9.2.2. Postpaid
- 9.1. Market Analysis, Insights and Forecast - by Application
- 10. Middle East & Africa Shared Bandwidth Analysis, Insights and Forecast, 2021-2033
- 10.1. Market Analysis, Insights and Forecast - by Application
- 10.1.1. Large Enterprises
- 10.1.2. SMEs
- 10.2. Market Analysis, Insights and Forecast - by Types
- 10.2.1. Prepaid
- 10.2.2. Postpaid
- 10.1. Market Analysis, Insights and Forecast - by Application
- 11. Asia Pacific Shared Bandwidth Analysis, Insights and Forecast, 2021-2033
- 11.1. Market Analysis, Insights and Forecast - by Application
- 11.1.1. Large Enterprises
- 11.1.2. SMEs
- 11.2. Market Analysis, Insights and Forecast - by Types
- 11.2.1. Prepaid
- 11.2.2. Postpaid
- 11.1. Market Analysis, Insights and Forecast - by Application
- 12. Competitive Analysis
- 12.1. Company Profiles
- 12.1.1 Alibaba Cloud
- 12.1.1.1. Company Overview
- 12.1.1.2. Products
- 12.1.1.3. Company Financials
- 12.1.1.4. SWOT Analysis
- 12.1.2 Huawei Cloud
- 12.1.2.1. Company Overview
- 12.1.2.2. Products
- 12.1.2.3. Company Financials
- 12.1.2.4. SWOT Analysis
- 12.1.3 Tencent Cloud
- 12.1.3.1. Company Overview
- 12.1.3.2. Products
- 12.1.3.3. Company Financials
- 12.1.3.4. SWOT Analysis
- 12.1.4 Ctyun
- 12.1.4.1. Company Overview
- 12.1.4.2. Products
- 12.1.4.3. Company Financials
- 12.1.4.4. SWOT Analysis
- 12.1.5 Baidu Cloud
- 12.1.5.1. Company Overview
- 12.1.5.2. Products
- 12.1.5.3. Company Financials
- 12.1.5.4. SWOT Analysis
- 12.1.6 Kacific
- 12.1.6.1. Company Overview
- 12.1.6.2. Products
- 12.1.6.3. Company Financials
- 12.1.6.4. SWOT Analysis
- 12.1.7 Volcano Engine(ByteDance)
- 12.1.7.1. Company Overview
- 12.1.7.2. Products
- 12.1.7.3. Company Financials
- 12.1.7.4. SWOT Analysis
- 12.1.8 AWS(Amazon Web Services)
- 12.1.8.1. Company Overview
- 12.1.8.2. Products
- 12.1.8.3. Company Financials
- 12.1.8.4. SWOT Analysis
- 12.1.9 Microsoft Azure
- 12.1.9.1. Company Overview
- 12.1.9.2. Products
- 12.1.9.3. Company Financials
- 12.1.9.4. SWOT Analysis
- 12.1.10 China Unicom Cloud
- 12.1.10.1. Company Overview
- 12.1.10.2. Products
- 12.1.10.3. Company Financials
- 12.1.10.4. SWOT Analysis
- 12.1.11 Mobile Cloud
- 12.1.11.1. Company Overview
- 12.1.11.2. Products
- 12.1.11.3. Company Financials
- 12.1.11.4. SWOT Analysis
- 12.1.1 Alibaba Cloud
- 12.2. Market Entropy
- 12.2.1 Company's Key Areas Served
- 12.2.2 Recent Developments
- 12.3. Company Market Share Analysis 2025
- 12.3.1 Top 5 Companies Market Share Analysis
- 12.3.2 Top 3 Companies Market Share Analysis
- 12.4. List of Potential Customers
- 13. Research Methodology
List of Figures
- Figure 1: Global Shared Bandwidth Revenue Breakdown (undefined, %) by Region 2025 & 2033
- Figure 2: North America Shared Bandwidth Revenue (undefined), by Application 2025 & 2033
- Figure 3: North America Shared Bandwidth Revenue Share (%), by Application 2025 & 2033
- Figure 4: North America Shared Bandwidth Revenue (undefined), by Types 2025 & 2033
- Figure 5: North America Shared Bandwidth Revenue Share (%), by Types 2025 & 2033
- Figure 6: North America Shared Bandwidth Revenue (undefined), by Country 2025 & 2033
- Figure 7: North America Shared Bandwidth Revenue Share (%), by Country 2025 & 2033
- Figure 8: South America Shared Bandwidth Revenue (undefined), by Application 2025 & 2033
- Figure 9: South America Shared Bandwidth Revenue Share (%), by Application 2025 & 2033
- Figure 10: South America Shared Bandwidth Revenue (undefined), by Types 2025 & 2033
- Figure 11: South America Shared Bandwidth Revenue Share (%), by Types 2025 & 2033
- Figure 12: South America Shared Bandwidth Revenue (undefined), by Country 2025 & 2033
- Figure 13: South America Shared Bandwidth Revenue Share (%), by Country 2025 & 2033
- Figure 14: Europe Shared Bandwidth Revenue (undefined), by Application 2025 & 2033
- Figure 15: Europe Shared Bandwidth Revenue Share (%), by Application 2025 & 2033
- Figure 16: Europe Shared Bandwidth Revenue (undefined), by Types 2025 & 2033
- Figure 17: Europe Shared Bandwidth Revenue Share (%), by Types 2025 & 2033
- Figure 18: Europe Shared Bandwidth Revenue (undefined), by Country 2025 & 2033
- Figure 19: Europe Shared Bandwidth Revenue Share (%), by Country 2025 & 2033
- Figure 20: Middle East & Africa Shared Bandwidth Revenue (undefined), by Application 2025 & 2033
- Figure 21: Middle East & Africa Shared Bandwidth Revenue Share (%), by Application 2025 & 2033
- Figure 22: Middle East & Africa Shared Bandwidth Revenue (undefined), by Types 2025 & 2033
- Figure 23: Middle East & Africa Shared Bandwidth Revenue Share (%), by Types 2025 & 2033
- Figure 24: Middle East & Africa Shared Bandwidth Revenue (undefined), by Country 2025 & 2033
- Figure 25: Middle East & Africa Shared Bandwidth Revenue Share (%), by Country 2025 & 2033
- Figure 26: Asia Pacific Shared Bandwidth Revenue (undefined), by Application 2025 & 2033
- Figure 27: Asia Pacific Shared Bandwidth Revenue Share (%), by Application 2025 & 2033
- Figure 28: Asia Pacific Shared Bandwidth Revenue (undefined), by Types 2025 & 2033
- Figure 29: Asia Pacific Shared Bandwidth Revenue Share (%), by Types 2025 & 2033
- Figure 30: Asia Pacific Shared Bandwidth Revenue (undefined), by Country 2025 & 2033
- Figure 31: Asia Pacific Shared Bandwidth Revenue Share (%), by Country 2025 & 2033
List of Tables
- Table 1: Global Shared Bandwidth Revenue undefined Forecast, by Application 2020 & 2033
- Table 2: Global Shared Bandwidth Revenue undefined Forecast, by Types 2020 & 2033
- Table 3: Global Shared Bandwidth Revenue undefined Forecast, by Region 2020 & 2033
- Table 4: Global Shared Bandwidth Revenue undefined Forecast, by Application 2020 & 2033
- Table 5: Global Shared Bandwidth Revenue undefined Forecast, by Types 2020 & 2033
- Table 6: Global Shared Bandwidth Revenue undefined Forecast, by Country 2020 & 2033
- Table 7: United States Shared Bandwidth Revenue (undefined) Forecast, by Application 2020 & 2033
- Table 8: Canada Shared Bandwidth Revenue (undefined) Forecast, by Application 2020 & 2033
- Table 9: Mexico Shared Bandwidth Revenue (undefined) Forecast, by Application 2020 & 2033
- Table 10: Global Shared Bandwidth Revenue undefined Forecast, by Application 2020 & 2033
- Table 11: Global Shared Bandwidth Revenue undefined Forecast, by Types 2020 & 2033
- Table 12: Global Shared Bandwidth Revenue undefined Forecast, by Country 2020 & 2033
- Table 13: Brazil Shared Bandwidth Revenue (undefined) Forecast, by Application 2020 & 2033
- Table 14: Argentina Shared Bandwidth Revenue (undefined) Forecast, by Application 2020 & 2033
- Table 15: Rest of South America Shared Bandwidth Revenue (undefined) Forecast, by Application 2020 & 2033
- Table 16: Global Shared Bandwidth Revenue undefined Forecast, by Application 2020 & 2033
- Table 17: Global Shared Bandwidth Revenue undefined Forecast, by Types 2020 & 2033
- Table 18: Global Shared Bandwidth Revenue undefined Forecast, by Country 2020 & 2033
- Table 19: United Kingdom Shared Bandwidth Revenue (undefined) Forecast, by Application 2020 & 2033
- Table 20: Germany Shared Bandwidth Revenue (undefined) Forecast, by Application 2020 & 2033
- Table 21: France Shared Bandwidth Revenue (undefined) Forecast, by Application 2020 & 2033
- Table 22: Italy Shared Bandwidth Revenue (undefined) Forecast, by Application 2020 & 2033
- Table 23: Spain Shared Bandwidth Revenue (undefined) Forecast, by Application 2020 & 2033
- Table 24: Russia Shared Bandwidth Revenue (undefined) Forecast, by Application 2020 & 2033
- Table 25: Benelux Shared Bandwidth Revenue (undefined) Forecast, by Application 2020 & 2033
- Table 26: Nordics Shared Bandwidth Revenue (undefined) Forecast, by Application 2020 & 2033
- Table 27: Rest of Europe Shared Bandwidth Revenue (undefined) Forecast, by Application 2020 & 2033
- Table 28: Global Shared Bandwidth Revenue undefined Forecast, by Application 2020 & 2033
- Table 29: Global Shared Bandwidth Revenue undefined Forecast, by Types 2020 & 2033
- Table 30: Global Shared Bandwidth Revenue undefined Forecast, by Country 2020 & 2033
- Table 31: Turkey Shared Bandwidth Revenue (undefined) Forecast, by Application 2020 & 2033
- Table 32: Israel Shared Bandwidth Revenue (undefined) Forecast, by Application 2020 & 2033
- Table 33: GCC Shared Bandwidth Revenue (undefined) Forecast, by Application 2020 & 2033
- Table 34: North Africa Shared Bandwidth Revenue (undefined) Forecast, by Application 2020 & 2033
- Table 35: South Africa Shared Bandwidth Revenue (undefined) Forecast, by Application 2020 & 2033
- Table 36: Rest of Middle East & Africa Shared Bandwidth Revenue (undefined) Forecast, by Application 2020 & 2033
- Table 37: Global Shared Bandwidth Revenue undefined Forecast, by Application 2020 & 2033
- Table 38: Global Shared Bandwidth Revenue undefined Forecast, by Types 2020 & 2033
- Table 39: Global Shared Bandwidth Revenue undefined Forecast, by Country 2020 & 2033
- Table 40: China Shared Bandwidth Revenue (undefined) Forecast, by Application 2020 & 2033
- Table 41: India Shared Bandwidth Revenue (undefined) Forecast, by Application 2020 & 2033
- Table 42: Japan Shared Bandwidth Revenue (undefined) Forecast, by Application 2020 & 2033
- Table 43: South Korea Shared Bandwidth Revenue (undefined) Forecast, by Application 2020 & 2033
- Table 44: ASEAN Shared Bandwidth Revenue (undefined) Forecast, by Application 2020 & 2033
- Table 45: Oceania Shared Bandwidth Revenue (undefined) Forecast, by Application 2020 & 2033
- Table 46: Rest of Asia Pacific Shared Bandwidth Revenue (undefined) Forecast, by Application 2020 & 2033
Frequently Asked Questions
1. What is the projected Compound Annual Growth Rate (CAGR) of the Shared Bandwidth?
The projected CAGR is approximately 18.1%.
2. Which companies are prominent players in the Shared Bandwidth?
Key companies in the market include Alibaba Cloud, Huawei Cloud, Tencent Cloud, Ctyun, Baidu Cloud, Kacific, Volcano Engine(ByteDance), AWS(Amazon Web Services), Microsoft Azure, China Unicom Cloud, Mobile Cloud.
3. What are the main segments of the Shared Bandwidth?
The market segments include Application, Types.
4. Can you provide details about the market size?
The market size is estimated to be USD XXX N/A as of 2022.
5. What are some drivers contributing to market growth?
N/A
6. What are the notable trends driving market growth?
N/A
7. Are there any restraints impacting market growth?
N/A
8. Can you provide examples of recent developments in the market?
N/A
9. What pricing options are available for accessing the report?
Pricing options include single-user, multi-user, and enterprise licenses priced at USD 2900.00, USD 4350.00, and USD 5800.00 respectively.
10. Is the market size provided in terms of value or volume?
The market size is provided in terms of value, measured in N/A.
11. Are there any specific market keywords associated with the report?
Yes, the market keyword associated with the report is "Shared Bandwidth," which aids in identifying and referencing the specific market segment covered.
12. How do I determine which pricing option suits my needs best?
The pricing options vary based on user requirements and access needs. Individual users may opt for single-user licenses, while businesses requiring broader access may choose multi-user or enterprise licenses for cost-effective access to the report.
13. Are there any additional resources or data provided in the Shared Bandwidth report?
While the report offers comprehensive insights, it's advisable to review the specific contents or supplementary materials provided to ascertain if additional resources or data are available.
14. How can I stay updated on further developments or reports in the Shared Bandwidth?
To stay informed about further developments, trends, and reports in the Shared Bandwidth, consider subscribing to industry newsletters, following relevant companies and organizations, or regularly checking reputable industry news sources and publications.
Methodology
Step 1 - Identification of Relevant Samples Size from Population Database


Step 2 - Approaches for Defining Global Market Size (Value, Volume* & Price*)

Note*: In applicable scenarios
Step 3 - Data Sources
Primary Research
- Web Analytics
- Survey Reports
- Research Institute
- Latest Research Reports
- Opinion Leaders
Secondary Research
- Annual Reports
- White Paper
- Latest Press Release
- Industry Association
- Paid Database
- Investor Presentations

Step 4 - Data Triangulation
Involves using different sources of information in order to increase the validity of a study
These sources are likely to be stakeholders in a program - participants, other researchers, program staff, other community members, and so on.
Then we put all data in single framework & apply various statistical tools to find out the dynamic on the market.
During the analysis stage, feedback from the stakeholder groups would be compared to determine areas of agreement as well as areas of divergence