

Key Insights
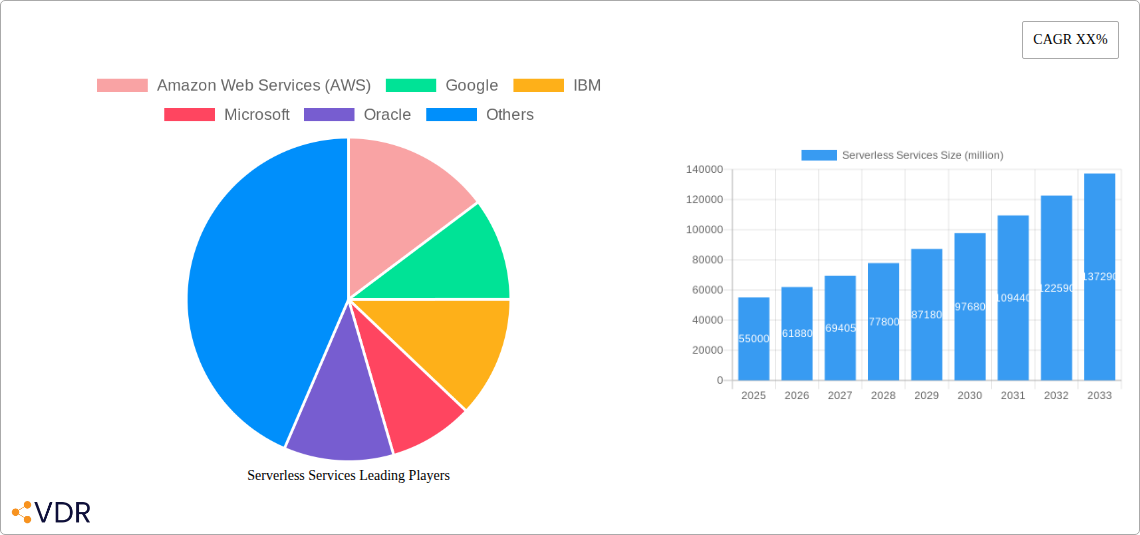
Serverless Services Market Size (In Billion)
Serverless Services Market Dynamics & Structure
The global Serverless Services market is characterized by dynamic growth and increasing concentration among key technology giants, while also fostering an ecosystem of specialized providers. Amazon Web Services (AWS) maintains a significant market share, followed closely by competitors like Google, Microsoft, and Alibaba, who are aggressively expanding their serverless offerings. Technological innovation is the primary driver, with advancements in Function-as-a-Service (FaaS), Backend-as-a-Service (BaaS), and managed container services constantly enhancing capabilities and reducing operational overhead. Regulatory frameworks are evolving to address data privacy and security concerns, particularly in sensitive sectors like BFSI and Healthcare, influencing adoption patterns. Competitive product substitutes, while present in traditional cloud and on-premises solutions, are increasingly losing ground to the agility and cost-effectiveness of serverless architectures. End-user demographics are broadening, encompassing startups to large enterprises across all industries seeking to optimize IT expenditure and accelerate time-to-market. Mergers and acquisitions (M&A) activity is moderate but strategic, as larger players acquire innovative startups to bolster their serverless portfolios.
- Market Concentration: Dominated by major cloud providers, with a growing niche for specialized serverless platforms.
- Technological Innovation: Driven by FaaS, BaaS advancements, AI/ML integration, and edge computing capabilities.
- Regulatory Frameworks: Focus on data sovereignty, security compliance (e.g., GDPR, HIPAA), and interoperability standards.
- Competitive Product Substitutes: Traditional IaaS and PaaS solutions, on-premises infrastructure, and microservices architectures.
- End-User Demographics: Growing adoption across IT & Telecom, BFSI, Retail & eCommerce, Healthcare, Government, Manufacturing, and Media and Entertainment.
- M&A Trends: Strategic acquisitions of niche serverless startups by major cloud vendors and enterprise software providers.
Serverless Services Growth Trends & Insights
The global Serverless Services market is poised for exponential growth, driven by its intrinsic ability to deliver unparalleled scalability, cost optimization, and accelerated development cycles. The market size is projected to expand from an estimated $25,000 million in the Base Year of 2025 to a projected $120,000 million by the end of the Forecast Period in 2033, exhibiting a robust Compound Annual Growth Rate (CAGR) of approximately 22%. This significant expansion is fueled by widespread adoption across diverse industry segments. The IT & Telecom sector, a foundational adopter, is expected to lead the charge, followed by the BFSI and Retail & eCommerce sectors, each recognizing the immense potential of serverless for enhancing customer experiences and streamlining operations. Healthcare and Government sectors are also showing increasing traction, driven by the need for secure, scalable, and compliant cloud solutions.
Technological disruptions are continuously reshaping the serverless landscape. The evolution of Function-as-a-Service (FaaS) platforms, offering event-driven compute, alongside Backend-as-a-Service (BaaS) solutions that abstract away common backend functionalities, are democratizing application development. Furthermore, the integration of Artificial Intelligence (AI) and Machine Learning (ML) capabilities within serverless frameworks is opening new avenues for intelligent applications and automated processes. Consumer behavior shifts, particularly the demand for instant, personalized digital experiences, are compelling businesses to adopt more agile and responsive IT infrastructures, making serverless a natural fit. Market penetration is steadily increasing as organizations move beyond pilot projects to full-scale production deployments, drawn by the promise of reduced operational overhead and the ability to focus on core business innovation. The increasing maturity of serverless tooling and developer ecosystems is also lowering the barrier to entry, further accelerating adoption rates.
The Base Year (2025) sees the market valued at an estimated $25,000 million. The Forecast Period (2025-2033) will witness an aggressive upward trajectory. By 2030, the market is anticipated to reach $75,000 million, with the final years of the forecast period (2030-2033) experiencing a surge in adoption as serverless becomes the default architecture for many new application developments. The Historical Period (2019-2024) laid the groundwork, with early adopters demonstrating the viability and benefits of serverless, paving the way for the widespread acceptance observed today. The primary growth accelerators include the inherent cost savings derived from pay-per-execution models, the enhanced developer productivity, and the seamless scalability that adapts to fluctuating demand without manual intervention.
Dominant Regions, Countries, or Segments in Serverless Services
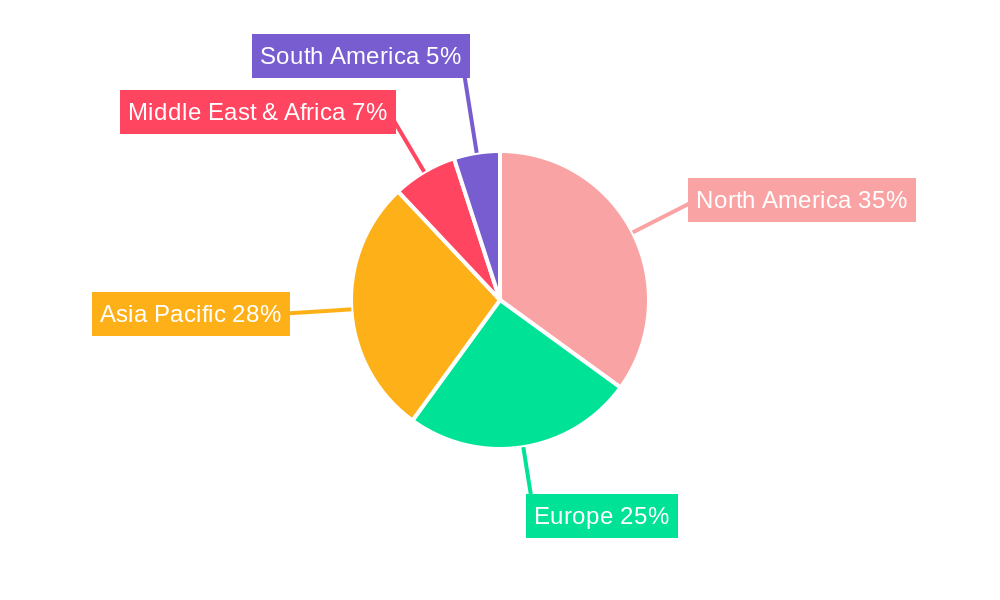
North America currently holds a dominant position in the global Serverless Services market, driven by its robust technological infrastructure, high adoption rates of cloud computing, and a strong presence of leading technology companies. The United States, in particular, is a key contributor, with a mature IT ecosystem and significant investments in digital transformation initiatives across all major segments. The IT & Telecom sector within North America leads in serverless adoption due to its constant need for scalable and agile solutions to manage vast amounts of data and deliver seamless connectivity. BFSI institutions are rapidly embracing serverless for enhanced security, compliance, and the ability to rapidly deploy new financial products and services. Retail & eCommerce businesses leverage serverless to handle peak traffic demands during promotional periods and personalize customer experiences.
The dominance of North America is further reinforced by strong government support for innovation and digital governance, leading to increased adoption in the Public Cloud segment. However, the Private Cloud segment is also experiencing growth, particularly among enterprises with stringent data sovereignty requirements or existing complex on-premises investments, seeking to gain some of the benefits of serverless within their controlled environments. Economic policies favoring technological advancement and a skilled workforce adept at adopting new paradigms contribute significantly to this regional leadership. Market share within North America is heavily influenced by the established cloud providers like AWS, Google, and Microsoft, who offer comprehensive serverless portfolios.
The forecast period is expected to witness continued growth in North America, but with other regions, particularly Asia-Pacific, exhibiting a faster growth rate. This is due to increasing digital transformation initiatives, a growing developer talent pool, and expanding internet penetration. Countries like China and India are becoming significant players. Europe is also a strong and growing market, with stringent data protection regulations like GDPR driving secure adoption patterns. The IT & Telecom segment is consistently projected to be the largest by market size, owing to its inherent digital nature and demand for scalable infrastructure.
- Leading Region: North America
- Key Countries: United States, Canada
- Dominant Segment (Application): IT & Telecom
- Driving Factors: Advanced technological infrastructure, high cloud adoption, strong presence of tech giants, supportive government policies.
- Segment Dominance Insights:
- IT & Telecom: Driven by the need for dynamic scaling for network operations, content delivery, and new service deployment.
- BFSI: Adoption accelerated by demand for secure, compliant, and agile solutions for customer-facing applications and back-end processing.
- Retail & eCommerce: Leverages serverless for responsive customer experiences, inventory management, and handling seasonal traffic spikes.
- Type Dominance: Public Cloud leads in overall adoption due to its accessibility and scalability, but Private Cloud adoption is growing for specialized use cases.
Serverless Services Product Landscape
The serverless product landscape is characterized by continuous innovation in Function-as-a-Service (FaaS), Backend-as-a-Service (BaaS), and managed container services. Leading providers like Amazon Web Services (AWS Lambda), Google Cloud Functions, and Microsoft Azure Functions offer robust FaaS platforms enabling developers to execute code in response to events without provisioning or managing servers. BaaS offerings from companies such as Firebase and AWS Amplify abstract away common backend functionalities like databases, authentication, and storage, significantly accelerating mobile and web application development. Managed container services like AWS Fargate and Google Cloud Run provide serverless execution environments for containerized applications, offering greater flexibility and control. Performance metrics are constantly improving, with reduced cold start times, enhanced execution limits, and more sophisticated tooling for monitoring and debugging. Unique selling propositions often revolve around ease of use, cost-effectiveness, and deep integration with other cloud services.
Key Drivers, Barriers & Challenges in Serverless Services
The serverless services market is propelled by several key drivers. The paramount driver is the inherent cost efficiency, with a pay-per-execution model eliminating the need for idle infrastructure. This is closely followed by accelerated development and deployment cycles, allowing organizations to innovate faster and respond quickly to market changes. Scalability and elasticity are also critical, providing automatic scaling capabilities to handle fluctuating demand without manual intervention. Technological advancements in FaaS and BaaS continue to make serverless more accessible and powerful.
However, the market faces significant barriers and challenges. Vendor lock-in remains a concern, as migrating complex serverless architectures between providers can be challenging. Complexity in debugging and monitoring distributed serverless systems can be a hurdle for some organizations, requiring specialized tools and expertise. Cold start latency can impact the performance of certain latency-sensitive applications. Security and compliance concerns, especially in highly regulated industries, require careful consideration and robust implementation.
- Key Drivers:
- Cost-effectiveness (pay-per-execution)
- Rapid development and deployment
- Automatic scalability and elasticity
- Reduced operational overhead
- Increased developer productivity
- Barriers & Challenges:
- Vendor lock-in
- Debugging and monitoring complexity
- Cold start latency
- Security and compliance considerations
- Steep learning curve for certain advanced use cases
- Limited control over the underlying infrastructure
Emerging Opportunities in Serverless Services
Emerging opportunities in the serverless services sector are abundant, particularly in the integration of serverless with cutting-edge technologies. The burgeoning field of edge computing presents a significant opportunity, allowing for serverless functions to be deployed closer to end-users, reducing latency and improving responsiveness for IoT devices and real-time applications. The increasing adoption of AI and ML workloads on serverless platforms is creating new possibilities for intelligent applications, from predictive analytics to automated content generation. Furthermore, the development of more robust serverless orchestration tools and the emergence of serverless-native databases are simplifying the development of complex, distributed applications. Untapped markets in developing economies, where the cost-effectiveness of serverless can democratize access to advanced IT capabilities, also represent a promising frontier.
Growth Accelerators in the Serverless Services Industry
Several catalysts are driving long-term growth in the serverless services industry. Continuous technological breakthroughs in areas like improved cold start times, enhanced security features, and broader language support are making serverless platforms more robust and versatile. Strategic partnerships between cloud providers and independent software vendors (ISVs) are expanding the ecosystem of serverless-compatible tools and services, making it easier for enterprises to adopt and integrate serverless solutions. Market expansion strategies by major cloud vendors into new geographical regions and industry verticals are bringing serverless capabilities to a wider audience. The increasing availability of serverless developer training and certification programs is also building a larger, more skilled workforce, further fueling adoption.
Key Players Shaping the Serverless Services Market
- Amazon Web Services (AWS)
- Microsoft
- IBM
- Oracle
- Broadcom
- Rackspace
- Alibaba
- Tibco Software
- Platform9
- Syncano
- NTT Data
- Joyent
- Iron.io
- Stdlib
- Realm
- Galactic Fog IP, Inc.
- Modubiz
- Tarams Software Technologies
- Snyk
- Dynatrace
- Fiorano Software
- Manjrasoft
- Sixsq
- Twistlock
Notable Milestones in Serverless Services Sector
- 2019: Increased adoption of containerized serverless solutions like AWS Fargate and Google Cloud Run, offering more flexibility.
- 2020: Significant advancements in FaaS cold start reduction, addressing a key performance concern.
- 2021: Growing integration of AI/ML services with serverless platforms, enabling intelligent applications.
- 2022: Enhanced security features and compliance certifications for serverless offerings across major cloud providers.
- 2023: Rise of serverless orchestration tools and frameworks for managing complex distributed applications.
- 2024: Increased focus on hybrid and multi-cloud serverless strategies to mitigate vendor lock-in.
In-Depth Serverless Services Market Outlook
The future of the Serverless Services market is exceptionally promising, with growth accelerators pointing towards sustained expansion. Technological breakthroughs in areas like serverless databases, improved developer tooling, and enhanced edge computing capabilities will unlock new use cases and further democratize application development. The strategic expansion of cloud providers into emerging markets and industry-specific solutions will broaden the addressable market. Continued innovation in security and compliance will address remaining concerns, paving the way for wider adoption in sensitive sectors. Organizations that strategically embrace serverless will gain a significant competitive advantage through increased agility, cost optimization, and the ability to innovate at an unprecedented pace. The market is set to witness a paradigm shift towards serverless-first architectures for new application development.
Serverless Services Segmentation
-
1. Application
- 1.1. BFSI
- 1.2. IT & Telecom
- 1.3. Retail & eCommerce
- 1.4. Healthcare
- 1.5. Government
- 1.6. Manufacturing
- 1.7. Media and Entertainment
- 1.8. Others
-
2. Types
- 2.1. Private Cloud
- 2.2. Public Cloud
Serverless Services Segmentation By Geography
-
1. North America
- 1.1. United States
- 1.2. Canada
- 1.3. Mexico
-
2. South America
- 2.1. Brazil
- 2.2. Argentina
- 2.3. Rest of South America
-
3. Europe
- 3.1. United Kingdom
- 3.2. Germany
- 3.3. France
- 3.4. Italy
- 3.5. Spain
- 3.6. Russia
- 3.7. Benelux
- 3.8. Nordics
- 3.9. Rest of Europe
-
4. Middle East & Africa
- 4.1. Turkey
- 4.2. Israel
- 4.3. GCC
- 4.4. North Africa
- 4.5. South Africa
- 4.6. Rest of Middle East & Africa
-
5. Asia Pacific
- 5.1. China
- 5.2. India
- 5.3. Japan
- 5.4. South Korea
- 5.5. ASEAN
- 5.6. Oceania
- 5.7. Rest of Asia Pacific
Serverless Services Regional Market Share
Geographic Coverage of Serverless Services
Serverless Services REPORT HIGHLIGHTS
| Aspects | Details |
|---|---|
| Study Period | 2020-2034 |
| Base Year | 2025 |
| Estimated Year | 2026 |
| Forecast Period | 2026-2034 |
| Historical Period | 2020-2025 |
| Growth Rate | CAGR of 23.5% from 2020-2034 |
| Segmentation |
|
Table of Contents
- 1. Introduction
- 1.1. Research Scope
- 1.2. Market Segmentation
- 1.3. Research Objective
- 1.4. Definitions and Assumptions
- 2. Executive Summary
- 2.1. Market Snapshot
- 3. Market Dynamics
- 3.1. Market Drivers
- 3.2. Market Restrains
- 3.3. Market Trends
- 3.4. Market Opportunities
- 4. Market Factor Analysis
- 4.1. Porters Five Forces
- 4.1.1. Bargaining Power of Suppliers
- 4.1.2. Bargaining Power of Buyers
- 4.1.3. Threat of New Entrants
- 4.1.4. Threat of Substitutes
- 4.1.5. Competitive Rivalry
- 4.2. PESTEL analysis
- 4.3. BCG Analysis
- 4.3.1. Stars (High Growth, High Market Share)
- 4.3.2. Cash Cows (Low Growth, High Market Share)
- 4.3.3. Question Mark (High Growth, Low Market Share)
- 4.3.4. Dogs (Low Growth, Low Market Share)
- 4.4. Ansoff Matrix Analysis
- 4.5. Supply Chain Analysis
- 4.6. Regulatory Landscape
- 4.7. Current Market Potential and Opportunity Assessment (TAM–SAM–SOM Framework)
- 4.8. VDR Analyst Note
- 4.1. Porters Five Forces
- 5. Market Analysis, Insights and Forecast 2021-2033
- 5.1. Market Analysis, Insights and Forecast - by Application
- 5.1.1. BFSI
- 5.1.2. IT & Telecom
- 5.1.3. Retail & eCommerce
- 5.1.4. Healthcare
- 5.1.5. Government
- 5.1.6. Manufacturing
- 5.1.7. Media and Entertainment
- 5.1.8. Others
- 5.2. Market Analysis, Insights and Forecast - by Types
- 5.2.1. Private Cloud
- 5.2.2. Public Cloud
- 5.3. Market Analysis, Insights and Forecast - by Region
- 5.3.1. North America
- 5.3.2. South America
- 5.3.3. Europe
- 5.3.4. Middle East & Africa
- 5.3.5. Asia Pacific
- 5.1. Market Analysis, Insights and Forecast - by Application
- 6. Global Serverless Services Analysis, Insights and Forecast, 2021-2033
- 6.1. Market Analysis, Insights and Forecast - by Application
- 6.1.1. BFSI
- 6.1.2. IT & Telecom
- 6.1.3. Retail & eCommerce
- 6.1.4. Healthcare
- 6.1.5. Government
- 6.1.6. Manufacturing
- 6.1.7. Media and Entertainment
- 6.1.8. Others
- 6.2. Market Analysis, Insights and Forecast - by Types
- 6.2.1. Private Cloud
- 6.2.2. Public Cloud
- 6.1. Market Analysis, Insights and Forecast - by Application
- 7. North America Serverless Services Analysis, Insights and Forecast, 2021-2033
- 7.1. Market Analysis, Insights and Forecast - by Application
- 7.1.1. BFSI
- 7.1.2. IT & Telecom
- 7.1.3. Retail & eCommerce
- 7.1.4. Healthcare
- 7.1.5. Government
- 7.1.6. Manufacturing
- 7.1.7. Media and Entertainment
- 7.1.8. Others
- 7.2. Market Analysis, Insights and Forecast - by Types
- 7.2.1. Private Cloud
- 7.2.2. Public Cloud
- 7.1. Market Analysis, Insights and Forecast - by Application
- 8. South America Serverless Services Analysis, Insights and Forecast, 2021-2033
- 8.1. Market Analysis, Insights and Forecast - by Application
- 8.1.1. BFSI
- 8.1.2. IT & Telecom
- 8.1.3. Retail & eCommerce
- 8.1.4. Healthcare
- 8.1.5. Government
- 8.1.6. Manufacturing
- 8.1.7. Media and Entertainment
- 8.1.8. Others
- 8.2. Market Analysis, Insights and Forecast - by Types
- 8.2.1. Private Cloud
- 8.2.2. Public Cloud
- 8.1. Market Analysis, Insights and Forecast - by Application
- 9. Europe Serverless Services Analysis, Insights and Forecast, 2021-2033
- 9.1. Market Analysis, Insights and Forecast - by Application
- 9.1.1. BFSI
- 9.1.2. IT & Telecom
- 9.1.3. Retail & eCommerce
- 9.1.4. Healthcare
- 9.1.5. Government
- 9.1.6. Manufacturing
- 9.1.7. Media and Entertainment
- 9.1.8. Others
- 9.2. Market Analysis, Insights and Forecast - by Types
- 9.2.1. Private Cloud
- 9.2.2. Public Cloud
- 9.1. Market Analysis, Insights and Forecast - by Application
- 10. Middle East & Africa Serverless Services Analysis, Insights and Forecast, 2021-2033
- 10.1. Market Analysis, Insights and Forecast - by Application
- 10.1.1. BFSI
- 10.1.2. IT & Telecom
- 10.1.3. Retail & eCommerce
- 10.1.4. Healthcare
- 10.1.5. Government
- 10.1.6. Manufacturing
- 10.1.7. Media and Entertainment
- 10.1.8. Others
- 10.2. Market Analysis, Insights and Forecast - by Types
- 10.2.1. Private Cloud
- 10.2.2. Public Cloud
- 10.1. Market Analysis, Insights and Forecast - by Application
- 11. Asia Pacific Serverless Services Analysis, Insights and Forecast, 2021-2033
- 11.1. Market Analysis, Insights and Forecast - by Application
- 11.1.1. BFSI
- 11.1.2. IT & Telecom
- 11.1.3. Retail & eCommerce
- 11.1.4. Healthcare
- 11.1.5. Government
- 11.1.6. Manufacturing
- 11.1.7. Media and Entertainment
- 11.1.8. Others
- 11.2. Market Analysis, Insights and Forecast - by Types
- 11.2.1. Private Cloud
- 11.2.2. Public Cloud
- 11.1. Market Analysis, Insights and Forecast - by Application
- 12. Competitive Analysis
- 12.1. Company Profiles
- 12.1.1 Amazon Web Services (AWS)
- 12.1.1.1. Company Overview
- 12.1.1.2. Products
- 12.1.1.3. Company Financials
- 12.1.1.4. SWOT Analysis
- 12.1.2 Google
- 12.1.2.1. Company Overview
- 12.1.2.2. Products
- 12.1.2.3. Company Financials
- 12.1.2.4. SWOT Analysis
- 12.1.3 IBM
- 12.1.3.1. Company Overview
- 12.1.3.2. Products
- 12.1.3.3. Company Financials
- 12.1.3.4. SWOT Analysis
- 12.1.4 Microsoft
- 12.1.4.1. Company Overview
- 12.1.4.2. Products
- 12.1.4.3. Company Financials
- 12.1.4.4. SWOT Analysis
- 12.1.5 Oracle
- 12.1.5.1. Company Overview
- 12.1.5.2. Products
- 12.1.5.3. Company Financials
- 12.1.5.4. SWOT Analysis
- 12.1.6 Broadcom
- 12.1.6.1. Company Overview
- 12.1.6.2. Products
- 12.1.6.3. Company Financials
- 12.1.6.4. SWOT Analysis
- 12.1.7 Rackspace
- 12.1.7.1. Company Overview
- 12.1.7.2. Products
- 12.1.7.3. Company Financials
- 12.1.7.4. SWOT Analysis
- 12.1.8 Alibaba
- 12.1.8.1. Company Overview
- 12.1.8.2. Products
- 12.1.8.3. Company Financials
- 12.1.8.4. SWOT Analysis
- 12.1.9 Tibco Software
- 12.1.9.1. Company Overview
- 12.1.9.2. Products
- 12.1.9.3. Company Financials
- 12.1.9.4. SWOT Analysis
- 12.1.10 Platform9
- 12.1.10.1. Company Overview
- 12.1.10.2. Products
- 12.1.10.3. Company Financials
- 12.1.10.4. SWOT Analysis
- 12.1.11 Syncano
- 12.1.11.1. Company Overview
- 12.1.11.2. Products
- 12.1.11.3. Company Financials
- 12.1.11.4. SWOT Analysis
- 12.1.12 NTT Data
- 12.1.12.1. Company Overview
- 12.1.12.2. Products
- 12.1.12.3. Company Financials
- 12.1.12.4. SWOT Analysis
- 12.1.13 Joyent
- 12.1.13.1. Company Overview
- 12.1.13.2. Products
- 12.1.13.3. Company Financials
- 12.1.13.4. SWOT Analysis
- 12.1.14 Iron.io
- 12.1.14.1. Company Overview
- 12.1.14.2. Products
- 12.1.14.3. Company Financials
- 12.1.14.4. SWOT Analysis
- 12.1.15 Stdlib
- 12.1.15.1. Company Overview
- 12.1.15.2. Products
- 12.1.15.3. Company Financials
- 12.1.15.4. SWOT Analysis
- 12.1.16 Realm
- 12.1.16.1. Company Overview
- 12.1.16.2. Products
- 12.1.16.3. Company Financials
- 12.1.16.4. SWOT Analysis
- 12.1.17 Galactic Fog IP
- 12.1.17.1. Company Overview
- 12.1.17.2. Products
- 12.1.17.3. Company Financials
- 12.1.17.4. SWOT Analysis
- 12.1.18 Inc.
- 12.1.18.1. Company Overview
- 12.1.18.2. Products
- 12.1.18.3. Company Financials
- 12.1.18.4. SWOT Analysis
- 12.1.19 Modubiz
- 12.1.19.1. Company Overview
- 12.1.19.2. Products
- 12.1.19.3. Company Financials
- 12.1.19.4. SWOT Analysis
- 12.1.20 Tarams Software Technologies
- 12.1.20.1. Company Overview
- 12.1.20.2. Products
- 12.1.20.3. Company Financials
- 12.1.20.4. SWOT Analysis
- 12.1.21 Snyk
- 12.1.21.1. Company Overview
- 12.1.21.2. Products
- 12.1.21.3. Company Financials
- 12.1.21.4. SWOT Analysis
- 12.1.22 Dynatrace
- 12.1.22.1. Company Overview
- 12.1.22.2. Products
- 12.1.22.3. Company Financials
- 12.1.22.4. SWOT Analysis
- 12.1.23 Fiorano Software
- 12.1.23.1. Company Overview
- 12.1.23.2. Products
- 12.1.23.3. Company Financials
- 12.1.23.4. SWOT Analysis
- 12.1.24 Manjrasoft
- 12.1.24.1. Company Overview
- 12.1.24.2. Products
- 12.1.24.3. Company Financials
- 12.1.24.4. SWOT Analysis
- 12.1.25 Sixsq
- 12.1.25.1. Company Overview
- 12.1.25.2. Products
- 12.1.25.3. Company Financials
- 12.1.25.4. SWOT Analysis
- 12.1.26 Twistlock
- 12.1.26.1. Company Overview
- 12.1.26.2. Products
- 12.1.26.3. Company Financials
- 12.1.26.4. SWOT Analysis
- 12.1.1 Amazon Web Services (AWS)
- 12.2. Market Entropy
- 12.2.1 Company's Key Areas Served
- 12.2.2 Recent Developments
- 12.3. Company Market Share Analysis 2025
- 12.3.1 Top 5 Companies Market Share Analysis
- 12.3.2 Top 3 Companies Market Share Analysis
- 12.4. List of Potential Customers
- 13. Research Methodology
List of Figures
- Figure 1: Global Serverless Services Revenue Breakdown (billion, %) by Region 2025 & 2033
- Figure 2: North America Serverless Services Revenue (billion), by Application 2025 & 2033
- Figure 3: North America Serverless Services Revenue Share (%), by Application 2025 & 2033
- Figure 4: North America Serverless Services Revenue (billion), by Types 2025 & 2033
- Figure 5: North America Serverless Services Revenue Share (%), by Types 2025 & 2033
- Figure 6: North America Serverless Services Revenue (billion), by Country 2025 & 2033
- Figure 7: North America Serverless Services Revenue Share (%), by Country 2025 & 2033
- Figure 8: South America Serverless Services Revenue (billion), by Application 2025 & 2033
- Figure 9: South America Serverless Services Revenue Share (%), by Application 2025 & 2033
- Figure 10: South America Serverless Services Revenue (billion), by Types 2025 & 2033
- Figure 11: South America Serverless Services Revenue Share (%), by Types 2025 & 2033
- Figure 12: South America Serverless Services Revenue (billion), by Country 2025 & 2033
- Figure 13: South America Serverless Services Revenue Share (%), by Country 2025 & 2033
- Figure 14: Europe Serverless Services Revenue (billion), by Application 2025 & 2033
- Figure 15: Europe Serverless Services Revenue Share (%), by Application 2025 & 2033
- Figure 16: Europe Serverless Services Revenue (billion), by Types 2025 & 2033
- Figure 17: Europe Serverless Services Revenue Share (%), by Types 2025 & 2033
- Figure 18: Europe Serverless Services Revenue (billion), by Country 2025 & 2033
- Figure 19: Europe Serverless Services Revenue Share (%), by Country 2025 & 2033
- Figure 20: Middle East & Africa Serverless Services Revenue (billion), by Application 2025 & 2033
- Figure 21: Middle East & Africa Serverless Services Revenue Share (%), by Application 2025 & 2033
- Figure 22: Middle East & Africa Serverless Services Revenue (billion), by Types 2025 & 2033
- Figure 23: Middle East & Africa Serverless Services Revenue Share (%), by Types 2025 & 2033
- Figure 24: Middle East & Africa Serverless Services Revenue (billion), by Country 2025 & 2033
- Figure 25: Middle East & Africa Serverless Services Revenue Share (%), by Country 2025 & 2033
- Figure 26: Asia Pacific Serverless Services Revenue (billion), by Application 2025 & 2033
- Figure 27: Asia Pacific Serverless Services Revenue Share (%), by Application 2025 & 2033
- Figure 28: Asia Pacific Serverless Services Revenue (billion), by Types 2025 & 2033
- Figure 29: Asia Pacific Serverless Services Revenue Share (%), by Types 2025 & 2033
- Figure 30: Asia Pacific Serverless Services Revenue (billion), by Country 2025 & 2033
- Figure 31: Asia Pacific Serverless Services Revenue Share (%), by Country 2025 & 2033
List of Tables
- Table 1: Global Serverless Services Revenue billion Forecast, by Application 2020 & 2033
- Table 2: Global Serverless Services Revenue billion Forecast, by Types 2020 & 2033
- Table 3: Global Serverless Services Revenue billion Forecast, by Region 2020 & 2033
- Table 4: Global Serverless Services Revenue billion Forecast, by Application 2020 & 2033
- Table 5: Global Serverless Services Revenue billion Forecast, by Types 2020 & 2033
- Table 6: Global Serverless Services Revenue billion Forecast, by Country 2020 & 2033
- Table 7: United States Serverless Services Revenue (billion) Forecast, by Application 2020 & 2033
- Table 8: Canada Serverless Services Revenue (billion) Forecast, by Application 2020 & 2033
- Table 9: Mexico Serverless Services Revenue (billion) Forecast, by Application 2020 & 2033
- Table 10: Global Serverless Services Revenue billion Forecast, by Application 2020 & 2033
- Table 11: Global Serverless Services Revenue billion Forecast, by Types 2020 & 2033
- Table 12: Global Serverless Services Revenue billion Forecast, by Country 2020 & 2033
- Table 13: Brazil Serverless Services Revenue (billion) Forecast, by Application 2020 & 2033
- Table 14: Argentina Serverless Services Revenue (billion) Forecast, by Application 2020 & 2033
- Table 15: Rest of South America Serverless Services Revenue (billion) Forecast, by Application 2020 & 2033
- Table 16: Global Serverless Services Revenue billion Forecast, by Application 2020 & 2033
- Table 17: Global Serverless Services Revenue billion Forecast, by Types 2020 & 2033
- Table 18: Global Serverless Services Revenue billion Forecast, by Country 2020 & 2033
- Table 19: United Kingdom Serverless Services Revenue (billion) Forecast, by Application 2020 & 2033
- Table 20: Germany Serverless Services Revenue (billion) Forecast, by Application 2020 & 2033
- Table 21: France Serverless Services Revenue (billion) Forecast, by Application 2020 & 2033
- Table 22: Italy Serverless Services Revenue (billion) Forecast, by Application 2020 & 2033
- Table 23: Spain Serverless Services Revenue (billion) Forecast, by Application 2020 & 2033
- Table 24: Russia Serverless Services Revenue (billion) Forecast, by Application 2020 & 2033
- Table 25: Benelux Serverless Services Revenue (billion) Forecast, by Application 2020 & 2033
- Table 26: Nordics Serverless Services Revenue (billion) Forecast, by Application 2020 & 2033
- Table 27: Rest of Europe Serverless Services Revenue (billion) Forecast, by Application 2020 & 2033
- Table 28: Global Serverless Services Revenue billion Forecast, by Application 2020 & 2033
- Table 29: Global Serverless Services Revenue billion Forecast, by Types 2020 & 2033
- Table 30: Global Serverless Services Revenue billion Forecast, by Country 2020 & 2033
- Table 31: Turkey Serverless Services Revenue (billion) Forecast, by Application 2020 & 2033
- Table 32: Israel Serverless Services Revenue (billion) Forecast, by Application 2020 & 2033
- Table 33: GCC Serverless Services Revenue (billion) Forecast, by Application 2020 & 2033
- Table 34: North Africa Serverless Services Revenue (billion) Forecast, by Application 2020 & 2033
- Table 35: South Africa Serverless Services Revenue (billion) Forecast, by Application 2020 & 2033
- Table 36: Rest of Middle East & Africa Serverless Services Revenue (billion) Forecast, by Application 2020 & 2033
- Table 37: Global Serverless Services Revenue billion Forecast, by Application 2020 & 2033
- Table 38: Global Serverless Services Revenue billion Forecast, by Types 2020 & 2033
- Table 39: Global Serverless Services Revenue billion Forecast, by Country 2020 & 2033
- Table 40: China Serverless Services Revenue (billion) Forecast, by Application 2020 & 2033
- Table 41: India Serverless Services Revenue (billion) Forecast, by Application 2020 & 2033
- Table 42: Japan Serverless Services Revenue (billion) Forecast, by Application 2020 & 2033
- Table 43: South Korea Serverless Services Revenue (billion) Forecast, by Application 2020 & 2033
- Table 44: ASEAN Serverless Services Revenue (billion) Forecast, by Application 2020 & 2033
- Table 45: Oceania Serverless Services Revenue (billion) Forecast, by Application 2020 & 2033
- Table 46: Rest of Asia Pacific Serverless Services Revenue (billion) Forecast, by Application 2020 & 2033
Frequently Asked Questions
1. What is the projected Compound Annual Growth Rate (CAGR) of the Serverless Services?
The projected CAGR is approximately 23.5%.
2. Which companies are prominent players in the Serverless Services?
Key companies in the market include Amazon Web Services (AWS), Google, IBM, Microsoft, Oracle, Broadcom, Rackspace, Alibaba, Tibco Software, Platform9, Syncano, NTT Data, Joyent, Iron.io, Stdlib, Realm, Galactic Fog IP, Inc., Modubiz, Tarams Software Technologies, Snyk, Dynatrace, Fiorano Software, Manjrasoft, Sixsq, Twistlock.
3. What are the main segments of the Serverless Services?
The market segments include Application, Types.
4. Can you provide details about the market size?
The market size is estimated to be USD 16.17 billion as of 2022.
5. What are some drivers contributing to market growth?
N/A
6. What are the notable trends driving market growth?
N/A
7. Are there any restraints impacting market growth?
N/A
8. Can you provide examples of recent developments in the market?
N/A
9. What pricing options are available for accessing the report?
Pricing options include single-user, multi-user, and enterprise licenses priced at USD 3950.00, USD 5925.00, and USD 7900.00 respectively.
10. Is the market size provided in terms of value or volume?
The market size is provided in terms of value, measured in billion.
11. Are there any specific market keywords associated with the report?
Yes, the market keyword associated with the report is "Serverless Services," which aids in identifying and referencing the specific market segment covered.
12. How do I determine which pricing option suits my needs best?
The pricing options vary based on user requirements and access needs. Individual users may opt for single-user licenses, while businesses requiring broader access may choose multi-user or enterprise licenses for cost-effective access to the report.
13. Are there any additional resources or data provided in the Serverless Services report?
While the report offers comprehensive insights, it's advisable to review the specific contents or supplementary materials provided to ascertain if additional resources or data are available.
14. How can I stay updated on further developments or reports in the Serverless Services?
To stay informed about further developments, trends, and reports in the Serverless Services, consider subscribing to industry newsletters, following relevant companies and organizations, or regularly checking reputable industry news sources and publications.
Methodology
Step 1 - Identification of Relevant Samples Size from Population Database


Step 2 - Approaches for Defining Global Market Size (Value, Volume* & Price*)

Note*: In applicable scenarios
Step 3 - Data Sources
Primary Research
- Web Analytics
- Survey Reports
- Research Institute
- Latest Research Reports
- Opinion Leaders
Secondary Research
- Annual Reports
- White Paper
- Latest Press Release
- Industry Association
- Paid Database
- Investor Presentations

Step 4 - Data Triangulation
Involves using different sources of information in order to increase the validity of a study
These sources are likely to be stakeholders in a program - participants, other researchers, program staff, other community members, and so on.
Then we put all data in single framework & apply various statistical tools to find out the dynamic on the market.
During the analysis stage, feedback from the stakeholder groups would be compared to determine areas of agreement as well as areas of divergence