
Key Insights
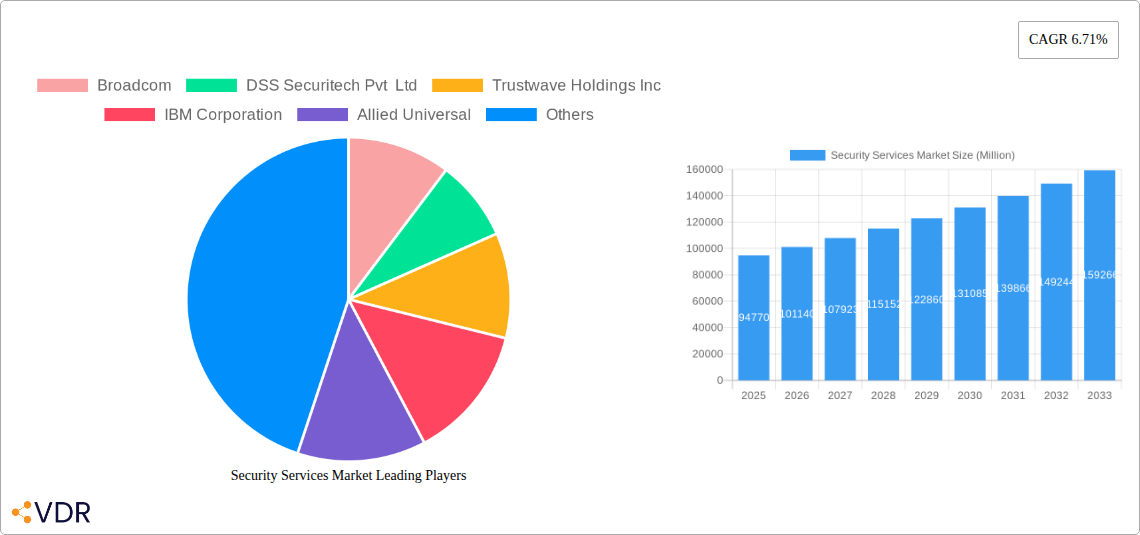
The global security services market, valued at $94.77 billion in 2025, is projected to experience robust growth, driven by a compound annual growth rate (CAGR) of 6.71% from 2025 to 2033. This expansion is fueled by several key factors. Increasing cyber threats targeting businesses and governments necessitate robust security measures, significantly boosting demand for managed security services, threat intelligence, and consulting. The rising adoption of cloud technologies, while offering benefits, also introduces new vulnerabilities, driving the need for cloud-based security solutions. Furthermore, stringent government regulations regarding data privacy and security in sectors like healthcare and finance are compelling organizations to invest heavily in security services. The increasing sophistication of cyberattacks and the emergence of new threats, such as ransomware and AI-powered attacks, further contribute to market growth. Geographically, North America and Europe currently hold significant market share, driven by advanced technological infrastructure and high cybersecurity awareness. However, the Asia-Pacific region is expected to witness rapid growth due to increasing digitalization and a rising middle class, leading to heightened demand for security solutions.
The market segmentation reveals significant opportunities across various service types. Managed security services are expected to dominate due to their cost-effectiveness and comprehensive nature. However, professional security services and consulting services also offer considerable growth potential, particularly for organizations needing specialized expertise or strategic security guidance. The shift towards cloud-based deployment models is creating a substantial market for cloud security services, while on-premise solutions remain relevant for organizations with specific security needs. The end-user industry analysis highlights substantial growth across diverse sectors, including IT and infrastructure, healthcare (driven by HIPAA compliance), and finance (due to stringent regulatory requirements). Competition is intense, with established players like IBM and Broadcom competing alongside specialized firms like Trustwave and DSS Securitech. The market’s future growth trajectory will depend on several factors, including the evolution of cyber threats, technological advancements in security solutions, and the regulatory landscape. Strategic partnerships, mergers, and acquisitions are likely to shape the competitive landscape in the coming years.
Security Services Market: A Comprehensive Report (2019-2033)
This comprehensive report provides a detailed analysis of the global Security Services market, encompassing market dynamics, growth trends, regional dominance, product landscape, key players, and future outlook. The study period spans from 2019 to 2033, with 2025 as the base year and a forecast period from 2025 to 2033. The report segments the market by service type (Managed Security Services, Professional Security Services, Consulting Services, Threat Intelligence Security Services), mode of deployment (On-Premise, Cloud), and end-user industry (IT and Infrastructure, Government, Industrial, Healthcare, Transportation and Logistics, Banking, Other End-user Industries). The market size is presented in million units.
Security Services Market Dynamics & Structure
The Security Services market is experiencing robust growth driven by increasing cyber threats, stringent data privacy regulations, and the rising adoption of cloud technologies. Market concentration is moderately high, with a few large players dominating certain segments. However, the market also features a significant number of smaller, specialized firms. Technological innovation, particularly in areas like AI and machine learning, is a key driver, while regulatory frameworks like GDPR and CCPA significantly influence market practices. Competitive product substitutes, such as open-source security tools, are also present, creating pressure on pricing and innovation. M&A activity remains significant, with xx deals recorded in the historical period (2019-2024), indicating consolidation and expansion strategies among key players. End-user demographics are shifting towards greater adoption across all industries, especially within sectors with high data sensitivity.
- Market Concentration: Moderately high, with top 5 players holding approximately xx% market share in 2024.
- Technological Innovation Drivers: AI, machine learning, blockchain, and cloud computing.
- Regulatory Frameworks: GDPR, CCPA, and other regional regulations are driving demand.
- Competitive Product Substitutes: Open-source security tools and DIY solutions.
- M&A Trends: xx deals recorded between 2019 and 2024, with an expected increase in the forecast period.
- Innovation Barriers: High initial investment costs, skills shortage, and integration complexities.
Security Services Market Growth Trends & Insights
The global Security Services market exhibited a CAGR of xx% during the historical period (2019-2024), reaching a market size of xx million units in 2024. This growth is attributed to factors such as increasing digital transformation across industries, the rising frequency and sophistication of cyberattacks, and growing awareness of data security risks. The market is expected to continue its upward trajectory, with a projected CAGR of xx% during the forecast period (2025-2033), reaching xx million units by 2033. The adoption rate of cloud-based security services is witnessing significant growth, driven by scalability and cost-effectiveness. Consumer behavior is shifting towards a preference for managed security services and proactive threat intelligence solutions, reflecting a move towards preventative security strategies. Technological disruptions like the rise of AI-powered threat detection systems are significantly influencing market dynamics. Market penetration is expected to increase across various end-user industries, with significant growth anticipated in the IT and infrastructure and healthcare sectors.

Dominant Regions, Countries, or Segments in Security Services Market
North America currently holds the largest market share in the Security Services market, driven by high technological adoption rates, robust regulatory frameworks, and a significant presence of major players. However, the Asia-Pacific region is projected to experience the fastest growth during the forecast period, fueled by rapid digitalization and increasing government investments in cybersecurity infrastructure. Within the market segments, Managed Security Services is the largest, exhibiting strong growth driven by its cost-effectiveness and comprehensive nature. The cloud deployment model is also rapidly gaining traction due to its scalability and flexibility.
- Key Regional Drivers:
- North America: High technological adoption, strong regulatory environment.
- Asia-Pacific: Rapid digitalization, increasing government investments.
- Europe: Stringent data privacy regulations, growing cybersecurity awareness.
- Key Segment Drivers:
- Managed Security Services: Cost-effectiveness, comprehensive solutions.
- Cloud Deployment: Scalability, flexibility, cost optimization.
- IT and Infrastructure: High dependence on secure systems and data.
Security Services Market Product Landscape
The Security Services market offers a diverse range of products and solutions, including intrusion detection and prevention systems, security information and event management (SIEM) tools, vulnerability management software, and endpoint detection and response (EDR) solutions. Continuous innovation focuses on improving the accuracy and speed of threat detection, enhancing incident response capabilities, and integrating artificial intelligence for predictive analytics. Unique selling propositions often include advanced threat intelligence, automated incident response, and seamless integration with existing IT infrastructure. Technological advancements are driven by the adoption of AI, machine learning, and automation to improve efficiency and effectiveness.
Key Drivers, Barriers & Challenges in Security Services Market
Key Drivers:
- Rising cyber threats and data breaches.
- Increasing adoption of cloud-based technologies.
- Stringent data privacy regulations (GDPR, CCPA).
- Growing awareness of cybersecurity risks among organizations.
Key Challenges and Restraints:
- High implementation costs of advanced security solutions.
- Shortage of skilled cybersecurity professionals.
- Complexity of integrating different security tools.
- Constant evolution of cyber threats necessitates continuous adaptation.
- Supply chain disruptions impacting availability of hardware and software. This led to a xx% increase in costs in 2022.
Emerging Opportunities in Security Services Market
- Growing demand for managed security services in the healthcare and IoT sectors.
- Increasing adoption of AI and machine learning in threat detection.
- Expansion into emerging markets with growing internet penetration.
- Development of specialized security solutions for specific industry verticals.
Growth Accelerators in the Security Services Market Industry
Technological advancements in areas such as AI-powered threat detection and automated incident response are major catalysts for long-term growth. Strategic partnerships between security service providers and technology vendors are also contributing to market expansion. Furthermore, the increasing adoption of cloud-based security services and the expansion into new geographical markets are driving significant growth.
Key Players Shaping the Security Services Market Market
- Broadcom
- DSS Securitech Pvt Ltd
- Trustwave Holdings Inc
- IBM Corporation
- Allied Universal
- Constellis
- Wipr
- G4S Limited
- VS4 Security Services
- Fujitsu
- Fortra LLC
- Securitas Inc
- Verizon
- Unity Resource Group
Notable Milestones in Security Services Market Sector
- August 2023: Fortra announced new integrations for its offensive security solutions, enhancing vulnerability management and penetration testing capabilities.
- May 2023: Wipro partnered with Palo Alto Networks to offer advanced zero trust security solutions for OT environments.
In-Depth Security Services Market Market Outlook
The Security Services market is poised for significant growth in the coming years, driven by the increasing sophistication of cyber threats, the expanding adoption of cloud technologies, and the rising awareness of data security risks across various industries. Strategic opportunities exist for companies that can offer innovative, AI-powered solutions, strong threat intelligence capabilities, and seamless integration with existing IT infrastructures. The market is expected to witness further consolidation through mergers and acquisitions, with larger players looking to expand their market share and service offerings. The focus on proactive security measures and the increasing adoption of managed security services will continue to shape market growth.
Security Services Market Segmentation
-
1. Service Type
- 1.1. Managed Security Services
- 1.2. Professional Security Services
- 1.3. Consulting Services
- 1.4. Threat Intelligence Security Services
-
2. Mode of Deployment
- 2.1. On-premise
- 2.2. Cloud
-
3. End-user Industry
- 3.1. IT and Infrastructure
- 3.2. Government
- 3.3. Industrial
- 3.4. Healthcare
- 3.5. Transportation and Logistics
- 3.6. Banking
- 3.7. Other End-user Industries
Security Services Market Segmentation By Geography
-
1. North America
- 1.1. United States
- 1.2. Canada
-
2. Europe
- 2.1. Germany
- 2.2. United Kingdom
- 2.3. France
-
3. Asia
- 3.1. India
- 3.2. China
- 3.3. Japan
- 4. Australia and New Zealand
- 5. Latin America
- 6. Middle East and Africa

Security Services Market REPORT HIGHLIGHTS
| Aspects | Details |
|---|---|
| Study Period | 2019-2033 |
| Base Year | 2024 |
| Estimated Year | 2025 |
| Forecast Period | 2025-2033 |
| Historical Period | 2019-2024 |
| Growth Rate | CAGR of 6.71% from 2019-2033 |
| Segmentation |
|
Table of Contents
- 1. Introduction
- 1.1. Research Scope
- 1.2. Market Segmentation
- 1.3. Research Methodology
- 1.4. Definitions and Assumptions
- 2. Executive Summary
- 2.1. Introduction
- 3. Market Dynamics
- 3.1. Introduction
- 3.2. Market Drivers
- 3.2.1. Rising Digital Disruption and Increased Compliance Demands; Increasing Adoption of Multi-Cloud or Hybrid Cloud Strategies; Governments Focus on CyberSecurity
- 3.3. Market Restrains
- 3.3.1. ; Complexity in the Monitoring Services
- 3.4. Market Trends
- 3.4.1. Cloud Deployment to Hold Significant Market Share
- 4. Market Factor Analysis
- 4.1. Porters Five Forces
- 4.2. Supply/Value Chain
- 4.3. PESTEL analysis
- 4.4. Market Entropy
- 4.5. Patent/Trademark Analysis
- 5. Global Security Services Market Analysis, Insights and Forecast, 2019-2031
- 5.1. Market Analysis, Insights and Forecast - by Service Type
- 5.1.1. Managed Security Services
- 5.1.2. Professional Security Services
- 5.1.3. Consulting Services
- 5.1.4. Threat Intelligence Security Services
- 5.2. Market Analysis, Insights and Forecast - by Mode of Deployment
- 5.2.1. On-premise
- 5.2.2. Cloud
- 5.3. Market Analysis, Insights and Forecast - by End-user Industry
- 5.3.1. IT and Infrastructure
- 5.3.2. Government
- 5.3.3. Industrial
- 5.3.4. Healthcare
- 5.3.5. Transportation and Logistics
- 5.3.6. Banking
- 5.3.7. Other End-user Industries
- 5.4. Market Analysis, Insights and Forecast - by Region
- 5.4.1. North America
- 5.4.2. Europe
- 5.4.3. Asia
- 5.4.4. Australia and New Zealand
- 5.4.5. Latin America
- 5.4.6. Middle East and Africa
- 5.1. Market Analysis, Insights and Forecast - by Service Type
- 6. North America Security Services Market Analysis, Insights and Forecast, 2019-2031
- 6.1. Market Analysis, Insights and Forecast - by Service Type
- 6.1.1. Managed Security Services
- 6.1.2. Professional Security Services
- 6.1.3. Consulting Services
- 6.1.4. Threat Intelligence Security Services
- 6.2. Market Analysis, Insights and Forecast - by Mode of Deployment
- 6.2.1. On-premise
- 6.2.2. Cloud
- 6.3. Market Analysis, Insights and Forecast - by End-user Industry
- 6.3.1. IT and Infrastructure
- 6.3.2. Government
- 6.3.3. Industrial
- 6.3.4. Healthcare
- 6.3.5. Transportation and Logistics
- 6.3.6. Banking
- 6.3.7. Other End-user Industries
- 6.1. Market Analysis, Insights and Forecast - by Service Type
- 7. Europe Security Services Market Analysis, Insights and Forecast, 2019-2031
- 7.1. Market Analysis, Insights and Forecast - by Service Type
- 7.1.1. Managed Security Services
- 7.1.2. Professional Security Services
- 7.1.3. Consulting Services
- 7.1.4. Threat Intelligence Security Services
- 7.2. Market Analysis, Insights and Forecast - by Mode of Deployment
- 7.2.1. On-premise
- 7.2.2. Cloud
- 7.3. Market Analysis, Insights and Forecast - by End-user Industry
- 7.3.1. IT and Infrastructure
- 7.3.2. Government
- 7.3.3. Industrial
- 7.3.4. Healthcare
- 7.3.5. Transportation and Logistics
- 7.3.6. Banking
- 7.3.7. Other End-user Industries
- 7.1. Market Analysis, Insights and Forecast - by Service Type
- 8. Asia Security Services Market Analysis, Insights and Forecast, 2019-2031
- 8.1. Market Analysis, Insights and Forecast - by Service Type
- 8.1.1. Managed Security Services
- 8.1.2. Professional Security Services
- 8.1.3. Consulting Services
- 8.1.4. Threat Intelligence Security Services
- 8.2. Market Analysis, Insights and Forecast - by Mode of Deployment
- 8.2.1. On-premise
- 8.2.2. Cloud
- 8.3. Market Analysis, Insights and Forecast - by End-user Industry
- 8.3.1. IT and Infrastructure
- 8.3.2. Government
- 8.3.3. Industrial
- 8.3.4. Healthcare
- 8.3.5. Transportation and Logistics
- 8.3.6. Banking
- 8.3.7. Other End-user Industries
- 8.1. Market Analysis, Insights and Forecast - by Service Type
- 9. Australia and New Zealand Security Services Market Analysis, Insights and Forecast, 2019-2031
- 9.1. Market Analysis, Insights and Forecast - by Service Type
- 9.1.1. Managed Security Services
- 9.1.2. Professional Security Services
- 9.1.3. Consulting Services
- 9.1.4. Threat Intelligence Security Services
- 9.2. Market Analysis, Insights and Forecast - by Mode of Deployment
- 9.2.1. On-premise
- 9.2.2. Cloud
- 9.3. Market Analysis, Insights and Forecast - by End-user Industry
- 9.3.1. IT and Infrastructure
- 9.3.2. Government
- 9.3.3. Industrial
- 9.3.4. Healthcare
- 9.3.5. Transportation and Logistics
- 9.3.6. Banking
- 9.3.7. Other End-user Industries
- 9.1. Market Analysis, Insights and Forecast - by Service Type
- 10. Latin America Security Services Market Analysis, Insights and Forecast, 2019-2031
- 10.1. Market Analysis, Insights and Forecast - by Service Type
- 10.1.1. Managed Security Services
- 10.1.2. Professional Security Services
- 10.1.3. Consulting Services
- 10.1.4. Threat Intelligence Security Services
- 10.2. Market Analysis, Insights and Forecast - by Mode of Deployment
- 10.2.1. On-premise
- 10.2.2. Cloud
- 10.3. Market Analysis, Insights and Forecast - by End-user Industry
- 10.3.1. IT and Infrastructure
- 10.3.2. Government
- 10.3.3. Industrial
- 10.3.4. Healthcare
- 10.3.5. Transportation and Logistics
- 10.3.6. Banking
- 10.3.7. Other End-user Industries
- 10.1. Market Analysis, Insights and Forecast - by Service Type
- 11. Middle East and Africa Security Services Market Analysis, Insights and Forecast, 2019-2031
- 11.1. Market Analysis, Insights and Forecast - by Service Type
- 11.1.1. Managed Security Services
- 11.1.2. Professional Security Services
- 11.1.3. Consulting Services
- 11.1.4. Threat Intelligence Security Services
- 11.2. Market Analysis, Insights and Forecast - by Mode of Deployment
- 11.2.1. On-premise
- 11.2.2. Cloud
- 11.3. Market Analysis, Insights and Forecast - by End-user Industry
- 11.3.1. IT and Infrastructure
- 11.3.2. Government
- 11.3.3. Industrial
- 11.3.4. Healthcare
- 11.3.5. Transportation and Logistics
- 11.3.6. Banking
- 11.3.7. Other End-user Industries
- 11.1. Market Analysis, Insights and Forecast - by Service Type
- 12. North America Security Services Market Analysis, Insights and Forecast, 2019-2031
- 12.1. Market Analysis, Insights and Forecast - By Country/Sub-region
- 12.1.1 United States
- 12.1.2 Canada
- 12.1.3 Mexico
- 13. Europe Security Services Market Analysis, Insights and Forecast, 2019-2031
- 13.1. Market Analysis, Insights and Forecast - By Country/Sub-region
- 13.1.1 Germany
- 13.1.2 United Kingdom
- 13.1.3 France
- 13.1.4 Spain
- 13.1.5 Italy
- 13.1.6 Spain
- 13.1.7 Belgium
- 13.1.8 Netherland
- 13.1.9 Nordics
- 13.1.10 Rest of Europe
- 14. Asia Pacific Security Services Market Analysis, Insights and Forecast, 2019-2031
- 14.1. Market Analysis, Insights and Forecast - By Country/Sub-region
- 14.1.1 China
- 14.1.2 Japan
- 14.1.3 India
- 14.1.4 South Korea
- 14.1.5 Southeast Asia
- 14.1.6 Australia
- 14.1.7 Indonesia
- 14.1.8 Phillipes
- 14.1.9 Singapore
- 14.1.10 Thailandc
- 14.1.11 Rest of Asia Pacific
- 15. South America Security Services Market Analysis, Insights and Forecast, 2019-2031
- 15.1. Market Analysis, Insights and Forecast - By Country/Sub-region
- 15.1.1 Brazil
- 15.1.2 Argentina
- 15.1.3 Peru
- 15.1.4 Chile
- 15.1.5 Colombia
- 15.1.6 Ecuador
- 15.1.7 Venezuela
- 15.1.8 Rest of South America
- 16. North America Security Services Market Analysis, Insights and Forecast, 2019-2031
- 16.1. Market Analysis, Insights and Forecast - By Country/Sub-region
- 16.1.1 United States
- 16.1.2 Canada
- 16.1.3 Mexico
- 17. MEA Security Services Market Analysis, Insights and Forecast, 2019-2031
- 17.1. Market Analysis, Insights and Forecast - By Country/Sub-region
- 17.1.1 United Arab Emirates
- 17.1.2 Saudi Arabia
- 17.1.3 South Africa
- 17.1.4 Rest of Middle East and Africa
- 18. Competitive Analysis
- 18.1. Global Market Share Analysis 2024
- 18.2. Company Profiles
- 18.2.1 Broadcom
- 18.2.1.1. Overview
- 18.2.1.2. Products
- 18.2.1.3. SWOT Analysis
- 18.2.1.4. Recent Developments
- 18.2.1.5. Financials (Based on Availability)
- 18.2.2 DSS Securitech Pvt Ltd
- 18.2.2.1. Overview
- 18.2.2.2. Products
- 18.2.2.3. SWOT Analysis
- 18.2.2.4. Recent Developments
- 18.2.2.5. Financials (Based on Availability)
- 18.2.3 Trustwave Holdings Inc
- 18.2.3.1. Overview
- 18.2.3.2. Products
- 18.2.3.3. SWOT Analysis
- 18.2.3.4. Recent Developments
- 18.2.3.5. Financials (Based on Availability)
- 18.2.4 IBM Corporation
- 18.2.4.1. Overview
- 18.2.4.2. Products
- 18.2.4.3. SWOT Analysis
- 18.2.4.4. Recent Developments
- 18.2.4.5. Financials (Based on Availability)
- 18.2.5 Allied Universal
- 18.2.5.1. Overview
- 18.2.5.2. Products
- 18.2.5.3. SWOT Analysis
- 18.2.5.4. Recent Developments
- 18.2.5.5. Financials (Based on Availability)
- 18.2.6 Constellis
- 18.2.6.1. Overview
- 18.2.6.2. Products
- 18.2.6.3. SWOT Analysis
- 18.2.6.4. Recent Developments
- 18.2.6.5. Financials (Based on Availability)
- 18.2.7 Wipr
- 18.2.7.1. Overview
- 18.2.7.2. Products
- 18.2.7.3. SWOT Analysis
- 18.2.7.4. Recent Developments
- 18.2.7.5. Financials (Based on Availability)
- 18.2.8 G4S Limited
- 18.2.8.1. Overview
- 18.2.8.2. Products
- 18.2.8.3. SWOT Analysis
- 18.2.8.4. Recent Developments
- 18.2.8.5. Financials (Based on Availability)
- 18.2.9 VS4 Security Services
- 18.2.9.1. Overview
- 18.2.9.2. Products
- 18.2.9.3. SWOT Analysis
- 18.2.9.4. Recent Developments
- 18.2.9.5. Financials (Based on Availability)
- 18.2.10 Fujitsu
- 18.2.10.1. Overview
- 18.2.10.2. Products
- 18.2.10.3. SWOT Analysis
- 18.2.10.4. Recent Developments
- 18.2.10.5. Financials (Based on Availability)
- 18.2.11 Fortra LLC
- 18.2.11.1. Overview
- 18.2.11.2. Products
- 18.2.11.3. SWOT Analysis
- 18.2.11.4. Recent Developments
- 18.2.11.5. Financials (Based on Availability)
- 18.2.12 Securitas Inc
- 18.2.12.1. Overview
- 18.2.12.2. Products
- 18.2.12.3. SWOT Analysis
- 18.2.12.4. Recent Developments
- 18.2.12.5. Financials (Based on Availability)
- 18.2.13 Verizon
- 18.2.13.1. Overview
- 18.2.13.2. Products
- 18.2.13.3. SWOT Analysis
- 18.2.13.4. Recent Developments
- 18.2.13.5. Financials (Based on Availability)
- 18.2.14 Unity Resource Group
- 18.2.14.1. Overview
- 18.2.14.2. Products
- 18.2.14.3. SWOT Analysis
- 18.2.14.4. Recent Developments
- 18.2.14.5. Financials (Based on Availability)
- 18.2.1 Broadcom
List of Figures
- Figure 1: Global Security Services Market Revenue Breakdown (Million, %) by Region 2024 & 2032
- Figure 2: North America Security Services Market Revenue (Million), by Country 2024 & 2032
- Figure 3: North America Security Services Market Revenue Share (%), by Country 2024 & 2032
- Figure 4: Europe Security Services Market Revenue (Million), by Country 2024 & 2032
- Figure 5: Europe Security Services Market Revenue Share (%), by Country 2024 & 2032
- Figure 6: Asia Pacific Security Services Market Revenue (Million), by Country 2024 & 2032
- Figure 7: Asia Pacific Security Services Market Revenue Share (%), by Country 2024 & 2032
- Figure 8: South America Security Services Market Revenue (Million), by Country 2024 & 2032
- Figure 9: South America Security Services Market Revenue Share (%), by Country 2024 & 2032
- Figure 10: North America Security Services Market Revenue (Million), by Country 2024 & 2032
- Figure 11: North America Security Services Market Revenue Share (%), by Country 2024 & 2032
- Figure 12: MEA Security Services Market Revenue (Million), by Country 2024 & 2032
- Figure 13: MEA Security Services Market Revenue Share (%), by Country 2024 & 2032
- Figure 14: North America Security Services Market Revenue (Million), by Service Type 2024 & 2032
- Figure 15: North America Security Services Market Revenue Share (%), by Service Type 2024 & 2032
- Figure 16: North America Security Services Market Revenue (Million), by Mode of Deployment 2024 & 2032
- Figure 17: North America Security Services Market Revenue Share (%), by Mode of Deployment 2024 & 2032
- Figure 18: North America Security Services Market Revenue (Million), by End-user Industry 2024 & 2032
- Figure 19: North America Security Services Market Revenue Share (%), by End-user Industry 2024 & 2032
- Figure 20: North America Security Services Market Revenue (Million), by Country 2024 & 2032
- Figure 21: North America Security Services Market Revenue Share (%), by Country 2024 & 2032
- Figure 22: Europe Security Services Market Revenue (Million), by Service Type 2024 & 2032
- Figure 23: Europe Security Services Market Revenue Share (%), by Service Type 2024 & 2032
- Figure 24: Europe Security Services Market Revenue (Million), by Mode of Deployment 2024 & 2032
- Figure 25: Europe Security Services Market Revenue Share (%), by Mode of Deployment 2024 & 2032
- Figure 26: Europe Security Services Market Revenue (Million), by End-user Industry 2024 & 2032
- Figure 27: Europe Security Services Market Revenue Share (%), by End-user Industry 2024 & 2032
- Figure 28: Europe Security Services Market Revenue (Million), by Country 2024 & 2032
- Figure 29: Europe Security Services Market Revenue Share (%), by Country 2024 & 2032
- Figure 30: Asia Security Services Market Revenue (Million), by Service Type 2024 & 2032
- Figure 31: Asia Security Services Market Revenue Share (%), by Service Type 2024 & 2032
- Figure 32: Asia Security Services Market Revenue (Million), by Mode of Deployment 2024 & 2032
- Figure 33: Asia Security Services Market Revenue Share (%), by Mode of Deployment 2024 & 2032
- Figure 34: Asia Security Services Market Revenue (Million), by End-user Industry 2024 & 2032
- Figure 35: Asia Security Services Market Revenue Share (%), by End-user Industry 2024 & 2032
- Figure 36: Asia Security Services Market Revenue (Million), by Country 2024 & 2032
- Figure 37: Asia Security Services Market Revenue Share (%), by Country 2024 & 2032
- Figure 38: Australia and New Zealand Security Services Market Revenue (Million), by Service Type 2024 & 2032
- Figure 39: Australia and New Zealand Security Services Market Revenue Share (%), by Service Type 2024 & 2032
- Figure 40: Australia and New Zealand Security Services Market Revenue (Million), by Mode of Deployment 2024 & 2032
- Figure 41: Australia and New Zealand Security Services Market Revenue Share (%), by Mode of Deployment 2024 & 2032
- Figure 42: Australia and New Zealand Security Services Market Revenue (Million), by End-user Industry 2024 & 2032
- Figure 43: Australia and New Zealand Security Services Market Revenue Share (%), by End-user Industry 2024 & 2032
- Figure 44: Australia and New Zealand Security Services Market Revenue (Million), by Country 2024 & 2032
- Figure 45: Australia and New Zealand Security Services Market Revenue Share (%), by Country 2024 & 2032
- Figure 46: Latin America Security Services Market Revenue (Million), by Service Type 2024 & 2032
- Figure 47: Latin America Security Services Market Revenue Share (%), by Service Type 2024 & 2032
- Figure 48: Latin America Security Services Market Revenue (Million), by Mode of Deployment 2024 & 2032
- Figure 49: Latin America Security Services Market Revenue Share (%), by Mode of Deployment 2024 & 2032
- Figure 50: Latin America Security Services Market Revenue (Million), by End-user Industry 2024 & 2032
- Figure 51: Latin America Security Services Market Revenue Share (%), by End-user Industry 2024 & 2032
- Figure 52: Latin America Security Services Market Revenue (Million), by Country 2024 & 2032
- Figure 53: Latin America Security Services Market Revenue Share (%), by Country 2024 & 2032
- Figure 54: Middle East and Africa Security Services Market Revenue (Million), by Service Type 2024 & 2032
- Figure 55: Middle East and Africa Security Services Market Revenue Share (%), by Service Type 2024 & 2032
- Figure 56: Middle East and Africa Security Services Market Revenue (Million), by Mode of Deployment 2024 & 2032
- Figure 57: Middle East and Africa Security Services Market Revenue Share (%), by Mode of Deployment 2024 & 2032
- Figure 58: Middle East and Africa Security Services Market Revenue (Million), by End-user Industry 2024 & 2032
- Figure 59: Middle East and Africa Security Services Market Revenue Share (%), by End-user Industry 2024 & 2032
- Figure 60: Middle East and Africa Security Services Market Revenue (Million), by Country 2024 & 2032
- Figure 61: Middle East and Africa Security Services Market Revenue Share (%), by Country 2024 & 2032
List of Tables
- Table 1: Global Security Services Market Revenue Million Forecast, by Region 2019 & 2032
- Table 2: Global Security Services Market Revenue Million Forecast, by Service Type 2019 & 2032
- Table 3: Global Security Services Market Revenue Million Forecast, by Mode of Deployment 2019 & 2032
- Table 4: Global Security Services Market Revenue Million Forecast, by End-user Industry 2019 & 2032
- Table 5: Global Security Services Market Revenue Million Forecast, by Region 2019 & 2032
- Table 6: Global Security Services Market Revenue Million Forecast, by Country 2019 & 2032
- Table 7: United States Security Services Market Revenue (Million) Forecast, by Application 2019 & 2032
- Table 8: Canada Security Services Market Revenue (Million) Forecast, by Application 2019 & 2032
- Table 9: Mexico Security Services Market Revenue (Million) Forecast, by Application 2019 & 2032
- Table 10: Global Security Services Market Revenue Million Forecast, by Country 2019 & 2032
- Table 11: Germany Security Services Market Revenue (Million) Forecast, by Application 2019 & 2032
- Table 12: United Kingdom Security Services Market Revenue (Million) Forecast, by Application 2019 & 2032
- Table 13: France Security Services Market Revenue (Million) Forecast, by Application 2019 & 2032
- Table 14: Spain Security Services Market Revenue (Million) Forecast, by Application 2019 & 2032
- Table 15: Italy Security Services Market Revenue (Million) Forecast, by Application 2019 & 2032
- Table 16: Spain Security Services Market Revenue (Million) Forecast, by Application 2019 & 2032
- Table 17: Belgium Security Services Market Revenue (Million) Forecast, by Application 2019 & 2032
- Table 18: Netherland Security Services Market Revenue (Million) Forecast, by Application 2019 & 2032
- Table 19: Nordics Security Services Market Revenue (Million) Forecast, by Application 2019 & 2032
- Table 20: Rest of Europe Security Services Market Revenue (Million) Forecast, by Application 2019 & 2032
- Table 21: Global Security Services Market Revenue Million Forecast, by Country 2019 & 2032
- Table 22: China Security Services Market Revenue (Million) Forecast, by Application 2019 & 2032
- Table 23: Japan Security Services Market Revenue (Million) Forecast, by Application 2019 & 2032
- Table 24: India Security Services Market Revenue (Million) Forecast, by Application 2019 & 2032
- Table 25: South Korea Security Services Market Revenue (Million) Forecast, by Application 2019 & 2032
- Table 26: Southeast Asia Security Services Market Revenue (Million) Forecast, by Application 2019 & 2032
- Table 27: Australia Security Services Market Revenue (Million) Forecast, by Application 2019 & 2032
- Table 28: Indonesia Security Services Market Revenue (Million) Forecast, by Application 2019 & 2032
- Table 29: Phillipes Security Services Market Revenue (Million) Forecast, by Application 2019 & 2032
- Table 30: Singapore Security Services Market Revenue (Million) Forecast, by Application 2019 & 2032
- Table 31: Thailandc Security Services Market Revenue (Million) Forecast, by Application 2019 & 2032
- Table 32: Rest of Asia Pacific Security Services Market Revenue (Million) Forecast, by Application 2019 & 2032
- Table 33: Global Security Services Market Revenue Million Forecast, by Country 2019 & 2032
- Table 34: Brazil Security Services Market Revenue (Million) Forecast, by Application 2019 & 2032
- Table 35: Argentina Security Services Market Revenue (Million) Forecast, by Application 2019 & 2032
- Table 36: Peru Security Services Market Revenue (Million) Forecast, by Application 2019 & 2032
- Table 37: Chile Security Services Market Revenue (Million) Forecast, by Application 2019 & 2032
- Table 38: Colombia Security Services Market Revenue (Million) Forecast, by Application 2019 & 2032
- Table 39: Ecuador Security Services Market Revenue (Million) Forecast, by Application 2019 & 2032
- Table 40: Venezuela Security Services Market Revenue (Million) Forecast, by Application 2019 & 2032
- Table 41: Rest of South America Security Services Market Revenue (Million) Forecast, by Application 2019 & 2032
- Table 42: Global Security Services Market Revenue Million Forecast, by Country 2019 & 2032
- Table 43: United States Security Services Market Revenue (Million) Forecast, by Application 2019 & 2032
- Table 44: Canada Security Services Market Revenue (Million) Forecast, by Application 2019 & 2032
- Table 45: Mexico Security Services Market Revenue (Million) Forecast, by Application 2019 & 2032
- Table 46: Global Security Services Market Revenue Million Forecast, by Country 2019 & 2032
- Table 47: United Arab Emirates Security Services Market Revenue (Million) Forecast, by Application 2019 & 2032
- Table 48: Saudi Arabia Security Services Market Revenue (Million) Forecast, by Application 2019 & 2032
- Table 49: South Africa Security Services Market Revenue (Million) Forecast, by Application 2019 & 2032
- Table 50: Rest of Middle East and Africa Security Services Market Revenue (Million) Forecast, by Application 2019 & 2032
- Table 51: Global Security Services Market Revenue Million Forecast, by Service Type 2019 & 2032
- Table 52: Global Security Services Market Revenue Million Forecast, by Mode of Deployment 2019 & 2032
- Table 53: Global Security Services Market Revenue Million Forecast, by End-user Industry 2019 & 2032
- Table 54: Global Security Services Market Revenue Million Forecast, by Country 2019 & 2032
- Table 55: United States Security Services Market Revenue (Million) Forecast, by Application 2019 & 2032
- Table 56: Canada Security Services Market Revenue (Million) Forecast, by Application 2019 & 2032
- Table 57: Global Security Services Market Revenue Million Forecast, by Service Type 2019 & 2032
- Table 58: Global Security Services Market Revenue Million Forecast, by Mode of Deployment 2019 & 2032
- Table 59: Global Security Services Market Revenue Million Forecast, by End-user Industry 2019 & 2032
- Table 60: Global Security Services Market Revenue Million Forecast, by Country 2019 & 2032
- Table 61: Germany Security Services Market Revenue (Million) Forecast, by Application 2019 & 2032
- Table 62: United Kingdom Security Services Market Revenue (Million) Forecast, by Application 2019 & 2032
- Table 63: France Security Services Market Revenue (Million) Forecast, by Application 2019 & 2032
- Table 64: Global Security Services Market Revenue Million Forecast, by Service Type 2019 & 2032
- Table 65: Global Security Services Market Revenue Million Forecast, by Mode of Deployment 2019 & 2032
- Table 66: Global Security Services Market Revenue Million Forecast, by End-user Industry 2019 & 2032
- Table 67: Global Security Services Market Revenue Million Forecast, by Country 2019 & 2032
- Table 68: India Security Services Market Revenue (Million) Forecast, by Application 2019 & 2032
- Table 69: China Security Services Market Revenue (Million) Forecast, by Application 2019 & 2032
- Table 70: Japan Security Services Market Revenue (Million) Forecast, by Application 2019 & 2032
- Table 71: Global Security Services Market Revenue Million Forecast, by Service Type 2019 & 2032
- Table 72: Global Security Services Market Revenue Million Forecast, by Mode of Deployment 2019 & 2032
- Table 73: Global Security Services Market Revenue Million Forecast, by End-user Industry 2019 & 2032
- Table 74: Global Security Services Market Revenue Million Forecast, by Country 2019 & 2032
- Table 75: Global Security Services Market Revenue Million Forecast, by Service Type 2019 & 2032
- Table 76: Global Security Services Market Revenue Million Forecast, by Mode of Deployment 2019 & 2032
- Table 77: Global Security Services Market Revenue Million Forecast, by End-user Industry 2019 & 2032
- Table 78: Global Security Services Market Revenue Million Forecast, by Country 2019 & 2032
- Table 79: Global Security Services Market Revenue Million Forecast, by Service Type 2019 & 2032
- Table 80: Global Security Services Market Revenue Million Forecast, by Mode of Deployment 2019 & 2032
- Table 81: Global Security Services Market Revenue Million Forecast, by End-user Industry 2019 & 2032
- Table 82: Global Security Services Market Revenue Million Forecast, by Country 2019 & 2032
Frequently Asked Questions
1. What is the projected Compound Annual Growth Rate (CAGR) of the Security Services Market?
The projected CAGR is approximately 6.71%.
2. Which companies are prominent players in the Security Services Market?
Key companies in the market include Broadcom, DSS Securitech Pvt Ltd, Trustwave Holdings Inc, IBM Corporation, Allied Universal, Constellis, Wipr, G4S Limited, VS4 Security Services, Fujitsu, Fortra LLC, Securitas Inc, Verizon, Unity Resource Group.
3. What are the main segments of the Security Services Market?
The market segments include Service Type, Mode of Deployment, End-user Industry.
4. Can you provide details about the market size?
The market size is estimated to be USD 94.77 Million as of 2022.
5. What are some drivers contributing to market growth?
Rising Digital Disruption and Increased Compliance Demands; Increasing Adoption of Multi-Cloud or Hybrid Cloud Strategies; Governments Focus on CyberSecurity.
6. What are the notable trends driving market growth?
Cloud Deployment to Hold Significant Market Share.
7. Are there any restraints impacting market growth?
; Complexity in the Monitoring Services.
8. Can you provide examples of recent developments in the market?
August 2023: Fortra, a provider of cyber security software and services, announced the implementation of new integrations to enhance the capabilities of its comprehensive offensive security solutions. These integrations streamline the ability to manage vulnerabilities, conduct penetration tests, and conduct red teaming operations. By working together, these solutions leverage malicious actors' tactics to uncover and exploit vulnerabilities in an organization's security posture. By utilizing this proactive security strategy, customers can identify and remediate vulnerabilities before they become exploitable.
9. What pricing options are available for accessing the report?
Pricing options include single-user, multi-user, and enterprise licenses priced at USD 4750, USD 5250, and USD 8750 respectively.
10. Is the market size provided in terms of value or volume?
The market size is provided in terms of value, measured in Million.
11. Are there any specific market keywords associated with the report?
Yes, the market keyword associated with the report is "Security Services Market," which aids in identifying and referencing the specific market segment covered.
12. How do I determine which pricing option suits my needs best?
The pricing options vary based on user requirements and access needs. Individual users may opt for single-user licenses, while businesses requiring broader access may choose multi-user or enterprise licenses for cost-effective access to the report.
13. Are there any additional resources or data provided in the Security Services Market report?
While the report offers comprehensive insights, it's advisable to review the specific contents or supplementary materials provided to ascertain if additional resources or data are available.
14. How can I stay updated on further developments or reports in the Security Services Market?
To stay informed about further developments, trends, and reports in the Security Services Market, consider subscribing to industry newsletters, following relevant companies and organizations, or regularly checking reputable industry news sources and publications.
Methodology
Step 1 - Identification of Relevant Samples Size from Population Database


Step 2 - Approaches for Defining Global Market Size (Value, Volume* & Price*)

Note*: In applicable scenarios
Step 3 - Data Sources
Primary Research
- Web Analytics
- Survey Reports
- Research Institute
- Latest Research Reports
- Opinion Leaders
Secondary Research
- Annual Reports
- White Paper
- Latest Press Release
- Industry Association
- Paid Database
- Investor Presentations

Step 4 - Data Triangulation
Involves using different sources of information in order to increase the validity of a study
These sources are likely to be stakeholders in a program - participants, other researchers, program staff, other community members, and so on.
Then we put all data in single framework & apply various statistical tools to find out the dynamic on the market.
During the analysis stage, feedback from the stakeholder groups would be compared to determine areas of agreement as well as areas of divergence


