Key Insights
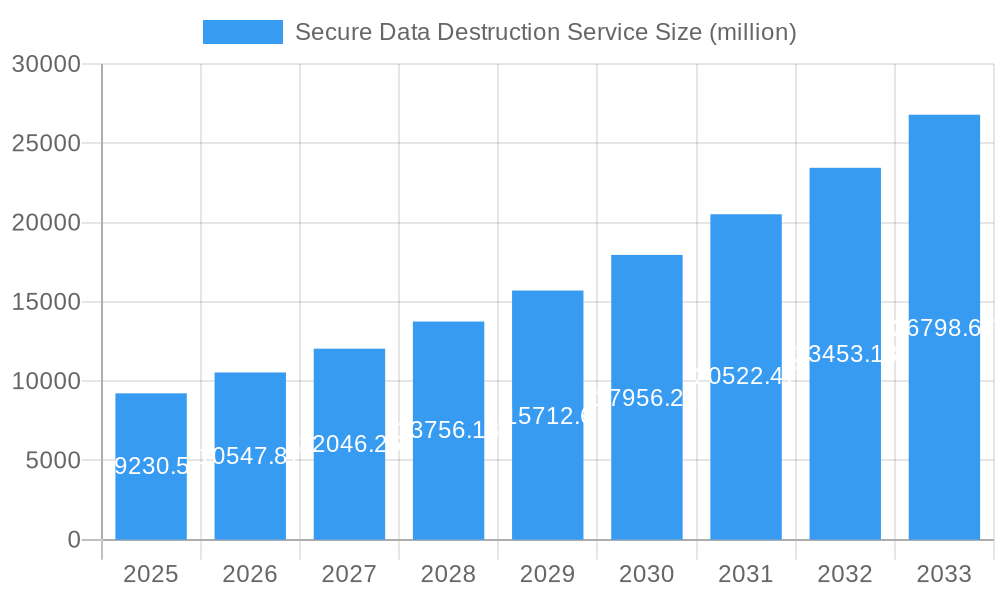
The Secure Data Destruction Services market is experiencing robust growth, projected to reach a market size of $9,230.5 million in 2025, exhibiting a Compound Annual Growth Rate (CAGR) of 14.6% from 2019 to 2033. This expansion is fueled by several key drivers. The increasing prevalence of data breaches and stringent data privacy regulations (like GDPR and CCPA) are compelling organizations to prioritize secure data disposal methods. The rising adoption of cloud computing and the resulting increase in sensitive data stored digitally further intensifies the demand for secure data destruction services. Furthermore, the growing awareness of potential legal and financial ramifications associated with data breaches is pushing businesses across various sectors – including healthcare, finance, and government – to invest heavily in robust data destruction solutions. The market is witnessing a shift towards more sophisticated and technologically advanced data destruction techniques, including data sanitization, degaussing, and physical destruction methods, tailored to meet diverse data security needs.
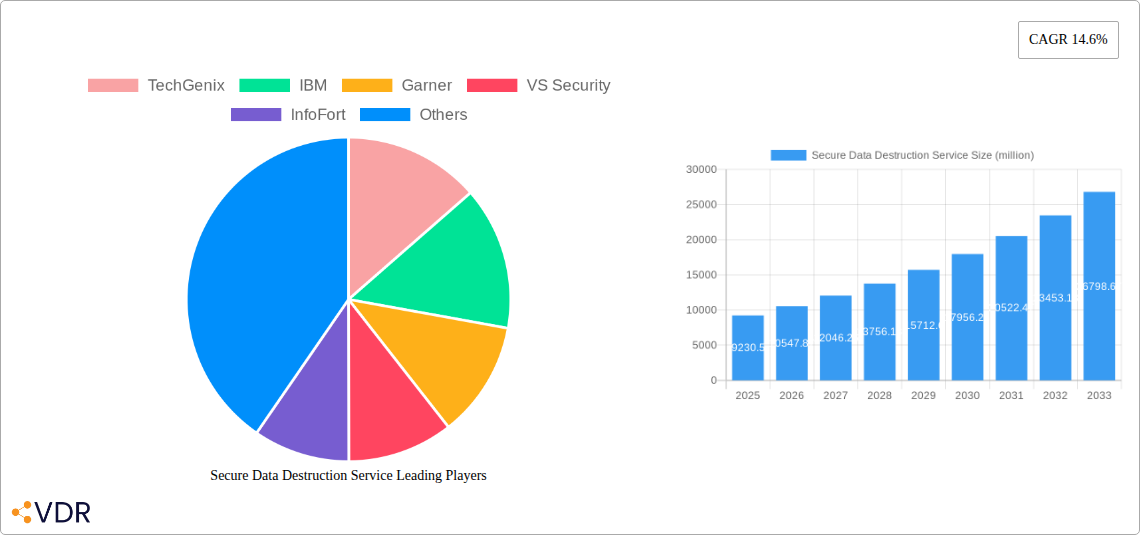
Secure Data Destruction Service Market Size (In Billion)
This market is segmented by service type (physical destruction, data sanitization, etc.), end-user industry (healthcare, finance, government, etc.), and geography. While specific segment breakdowns are not provided, we can reasonably infer that the finance and healthcare sectors likely constitute significant portions of the market due to their stringent regulatory requirements and sensitive data handling. The competition is relatively fragmented, with a mix of established players like IBM and TechGenix, alongside regional and specialized providers. Future growth will likely be driven by technological advancements (e.g., automated data destruction systems, improved data sanitization techniques), expansion into emerging markets, and a continuing rise in cybersecurity awareness among organizations. The market is expected to see continued consolidation, with larger players acquiring smaller firms to expand their service offerings and geographic reach. Over the forecast period, the market's growth trajectory is expected to remain strong, driven by ongoing digital transformation and a persistently heightened focus on data security.
Secure Data Destruction Service Company Market Share
Secure Data Destruction Service Market Report: 2019-2033
This comprehensive report provides an in-depth analysis of the Secure Data Destruction Service market, encompassing market dynamics, growth trends, regional analysis, competitive landscape, and future outlook. The study period covers 2019-2033, with 2025 as the base and estimated year. The forecast period spans 2025-2033, and the historical period encompasses 2019-2024. This report is crucial for industry professionals, investors, and businesses seeking to understand and capitalize on the opportunities within this rapidly evolving market. The parent market is Data Management, and the child market is Data Security. The market size in 2025 is estimated at $xx billion.
Secure Data Destruction Service Market Dynamics & Structure
This section analyzes the market structure, highlighting concentration levels, innovation drivers, regulatory influences, competitive substitutes, end-user demographics, and M&A activity. The market exhibits a moderately concentrated structure, with the top five players holding approximately 40% market share in 2025.
- Market Concentration: High concentration in developed regions, more fragmented in emerging markets.
- Technological Innovation: Focus on automation, AI-powered solutions, and secure remote data destruction.
- Regulatory Frameworks: GDPR, CCPA, and other data privacy regulations are key drivers of market growth.
- Competitive Substitutes: Data overwriting, degaussing; however, secure physical destruction remains dominant.
- End-User Demographics: Large enterprises, government agencies, healthcare providers, and financial institutions are major consumers.
- M&A Trends: Consolidation among smaller players is observed, with approximately xx M&A deals concluded between 2019 and 2024. Larger players are strategically acquiring companies with specialized capabilities. Innovation barriers include high initial investment costs for advanced technologies and the need for stringent security certifications.
Secure Data Destruction Service Growth Trends & Insights
The Secure Data Destruction Service market experienced significant growth between 2019 and 2024, driven by increasing data volumes, stringent data privacy regulations, and heightened cybersecurity concerns. The market is projected to maintain a healthy CAGR of xx% during the forecast period (2025-2033), reaching $xx billion by 2033. Market penetration is currently at xx% in developed regions and is expected to increase significantly in emerging markets. Technological advancements like automated shredding systems and data sanitization software are accelerating adoption rates. Changing consumer behavior toward increased data security awareness further propels market growth.
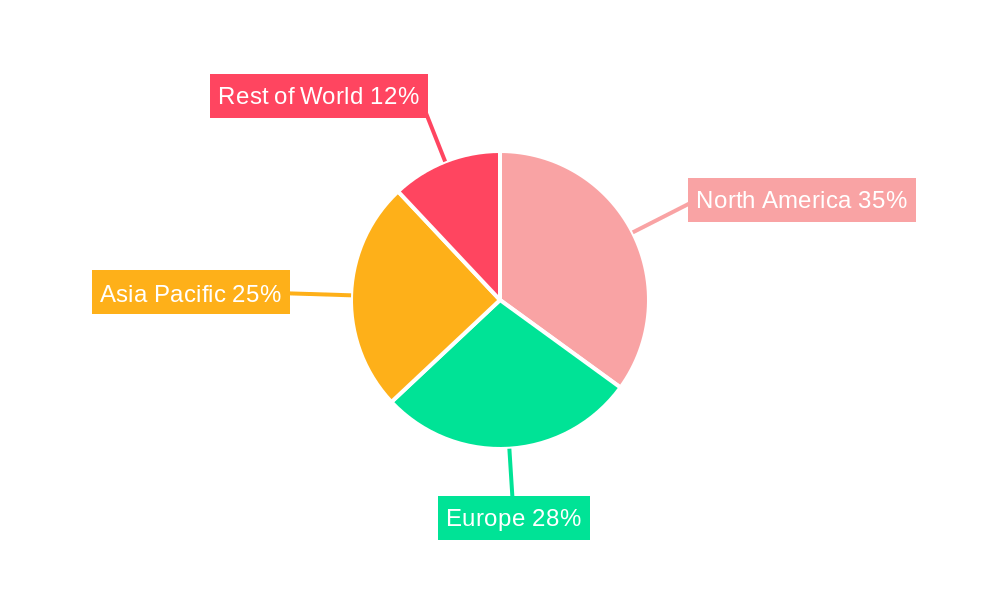
Dominant Regions, Countries, or Segments in Secure Data Destruction Service
North America currently holds the largest market share, driven by stringent data privacy regulations and a high concentration of large enterprises. Europe follows closely, with strong growth fueled by GDPR compliance. Asia-Pacific is a rapidly expanding market, projected to witness the highest CAGR during the forecast period.
- North America: High adoption of advanced technologies, stringent regulations, and a large enterprise base contribute to market dominance.
- Europe: GDPR compliance drives significant demand, with strong growth expected to continue.
- Asia-Pacific: Rapid economic growth, increasing data volumes, and rising cybersecurity concerns fuel market expansion.
- Key Drivers: Strong regulatory frameworks, increasing data breaches, rising awareness of data security risks, and robust IT infrastructure in developed regions are key market growth drivers.
Secure Data Destruction Service Product Landscape
The market offers a range of services, including physical destruction (shredding, incineration), data wiping, and degaussing. Recent innovations include automated shredding systems with real-time tracking and secure remote data wiping solutions. These solutions offer enhanced efficiency, improved security, and reduced environmental impact compared to traditional methods. Unique selling propositions include certifications (e.g., NAID AAA), chain-of-custody documentation, and compliance with industry standards.
Key Drivers, Barriers & Challenges in Secure Data Destruction Service
Key Drivers:
- Stringent data privacy regulations (GDPR, CCPA)
- Increasing data breaches and cyber threats
- Rising awareness of data security risks among businesses and individuals
- Growing adoption of cloud computing and data storage solutions
Challenges & Restraints:
- High initial investment costs for advanced technologies
- Difficulty in complying with evolving data privacy regulations across different jurisdictions
- Competition from alternative data destruction methods (e.g., data overwriting)
- Supply chain disruptions impacting availability of raw materials and equipment
Emerging Opportunities in Secure Data Destruction Service
- Expansion into emerging markets with growing data security concerns
- Development of specialized data destruction solutions for specific industries (healthcare, finance)
- Integration of AI and machine learning for improved efficiency and security
- Growing demand for secure remote data destruction services
Growth Accelerators in the Secure Data Destruction Service Industry
Technological advancements, strategic partnerships, and expansion into new geographic markets are key catalysts for long-term growth. The development of innovative data destruction technologies, coupled with collaborations between service providers and technology companies, will drive market expansion. Furthermore, focusing on emerging markets and expanding into new industry segments presents significant growth opportunities.
Key Players Shaping the Secure Data Destruction Service Market
Notable Milestones in Secure Data Destruction Service Sector
- 2020: Increased adoption of remote data destruction solutions due to the pandemic.
- 2021: Several major data breaches highlight the need for robust data destruction practices.
- 2022: Launch of several AI-powered data sanitization tools by leading vendors.
- 2023: Increased mergers and acquisitions activity within the market.
- 2024: Several new regulations related to data security and privacy are enacted.
In-Depth Secure Data Destruction Service Market Outlook
The Secure Data Destruction Service market is poised for significant growth over the next decade, driven by ongoing technological advancements, stringent data privacy regulations, and rising cybersecurity concerns. Strategic partnerships, expansion into untapped markets, and the development of innovative solutions will create lucrative opportunities for businesses in this sector. The focus on sustainable and environmentally friendly data destruction methods will also play a significant role in shaping the future of the market.
Secure Data Destruction Service Segmentation
-
1. Application
- 1.1. SSD
- 1.2. Flash Media
- 1.3. Mobile Devices
- 1.4. Others
-
2. Types
- 2.1. On-site
- 2.2. Off-site
Secure Data Destruction Service Segmentation By Geography
-
1. North America
- 1.1. United States
- 1.2. Canada
- 1.3. Mexico
-
2. South America
- 2.1. Brazil
- 2.2. Argentina
- 2.3. Rest of South America
-
3. Europe
- 3.1. United Kingdom
- 3.2. Germany
- 3.3. France
- 3.4. Italy
- 3.5. Spain
- 3.6. Russia
- 3.7. Benelux
- 3.8. Nordics
- 3.9. Rest of Europe
-
4. Middle East & Africa
- 4.1. Turkey
- 4.2. Israel
- 4.3. GCC
- 4.4. North Africa
- 4.5. South Africa
- 4.6. Rest of Middle East & Africa
-
5. Asia Pacific
- 5.1. China
- 5.2. India
- 5.3. Japan
- 5.4. South Korea
- 5.5. ASEAN
- 5.6. Oceania
- 5.7. Rest of Asia Pacific
Secure Data Destruction Service Regional Market Share
Geographic Coverage of Secure Data Destruction Service
Secure Data Destruction Service REPORT HIGHLIGHTS
| Aspects | Details |
|---|---|
| Study Period | 2020-2034 |
| Base Year | 2025 |
| Estimated Year | 2026 |
| Forecast Period | 2026-2034 |
| Historical Period | 2020-2025 |
| Growth Rate | CAGR of 10.7% from 2020-2034 |
| Segmentation |
|
Table of Contents
- 1. Introduction
- 1.1. Research Scope
- 1.2. Market Segmentation
- 1.3. Research Objective
- 1.4. Definitions and Assumptions
- 2. Executive Summary
- 2.1. Market Snapshot
- 3. Market Dynamics
- 3.1. Market Drivers
- 3.2. Market Restrains
- 3.3. Market Trends
- 3.4. Market Opportunities
- 4. Market Factor Analysis
- 4.1. Porters Five Forces
- 4.1.1. Bargaining Power of Suppliers
- 4.1.2. Bargaining Power of Buyers
- 4.1.3. Threat of New Entrants
- 4.1.4. Threat of Substitutes
- 4.1.5. Competitive Rivalry
- 4.2. PESTEL analysis
- 4.3. BCG Analysis
- 4.3.1. Stars (High Growth, High Market Share)
- 4.3.2. Cash Cows (Low Growth, High Market Share)
- 4.3.3. Question Mark (High Growth, Low Market Share)
- 4.3.4. Dogs (Low Growth, Low Market Share)
- 4.4. Ansoff Matrix Analysis
- 4.5. Supply Chain Analysis
- 4.6. Regulatory Landscape
- 4.7. Current Market Potential and Opportunity Assessment (TAM–SAM–SOM Framework)
- 4.8. VDR Analyst Note
- 4.1. Porters Five Forces
- 5. Market Analysis, Insights and Forecast 2021-2033
- 5.1. Market Analysis, Insights and Forecast - by Application
- 5.1.1. SSD
- 5.1.2. Flash Media
- 5.1.3. Mobile Devices
- 5.1.4. Others
- 5.2. Market Analysis, Insights and Forecast - by Types
- 5.2.1. On-site
- 5.2.2. Off-site
- 5.3. Market Analysis, Insights and Forecast - by Region
- 5.3.1. North America
- 5.3.2. South America
- 5.3.3. Europe
- 5.3.4. Middle East & Africa
- 5.3.5. Asia Pacific
- 5.1. Market Analysis, Insights and Forecast - by Application
- 6. Global Secure Data Destruction Service Analysis, Insights and Forecast, 2021-2033
- 6.1. Market Analysis, Insights and Forecast - by Application
- 6.1.1. SSD
- 6.1.2. Flash Media
- 6.1.3. Mobile Devices
- 6.1.4. Others
- 6.2. Market Analysis, Insights and Forecast - by Types
- 6.2.1. On-site
- 6.2.2. Off-site
- 6.1. Market Analysis, Insights and Forecast - by Application
- 7. North America Secure Data Destruction Service Analysis, Insights and Forecast, 2021-2033
- 7.1. Market Analysis, Insights and Forecast - by Application
- 7.1.1. SSD
- 7.1.2. Flash Media
- 7.1.3. Mobile Devices
- 7.1.4. Others
- 7.2. Market Analysis, Insights and Forecast - by Types
- 7.2.1. On-site
- 7.2.2. Off-site
- 7.1. Market Analysis, Insights and Forecast - by Application
- 8. South America Secure Data Destruction Service Analysis, Insights and Forecast, 2021-2033
- 8.1. Market Analysis, Insights and Forecast - by Application
- 8.1.1. SSD
- 8.1.2. Flash Media
- 8.1.3. Mobile Devices
- 8.1.4. Others
- 8.2. Market Analysis, Insights and Forecast - by Types
- 8.2.1. On-site
- 8.2.2. Off-site
- 8.1. Market Analysis, Insights and Forecast - by Application
- 9. Europe Secure Data Destruction Service Analysis, Insights and Forecast, 2021-2033
- 9.1. Market Analysis, Insights and Forecast - by Application
- 9.1.1. SSD
- 9.1.2. Flash Media
- 9.1.3. Mobile Devices
- 9.1.4. Others
- 9.2. Market Analysis, Insights and Forecast - by Types
- 9.2.1. On-site
- 9.2.2. Off-site
- 9.1. Market Analysis, Insights and Forecast - by Application
- 10. Middle East & Africa Secure Data Destruction Service Analysis, Insights and Forecast, 2021-2033
- 10.1. Market Analysis, Insights and Forecast - by Application
- 10.1.1. SSD
- 10.1.2. Flash Media
- 10.1.3. Mobile Devices
- 10.1.4. Others
- 10.2. Market Analysis, Insights and Forecast - by Types
- 10.2.1. On-site
- 10.2.2. Off-site
- 10.1. Market Analysis, Insights and Forecast - by Application
- 11. Asia Pacific Secure Data Destruction Service Analysis, Insights and Forecast, 2021-2033
- 11.1. Market Analysis, Insights and Forecast - by Application
- 11.1.1. SSD
- 11.1.2. Flash Media
- 11.1.3. Mobile Devices
- 11.1.4. Others
- 11.2. Market Analysis, Insights and Forecast - by Types
- 11.2.1. On-site
- 11.2.2. Off-site
- 11.1. Market Analysis, Insights and Forecast - by Application
- 12. Competitive Analysis
- 12.1. Company Profiles
- 12.1.1 TechGenix
- 12.1.1.1. Company Overview
- 12.1.1.2. Products
- 12.1.1.3. Company Financials
- 12.1.1.4. SWOT Analysis
- 12.1.2 IBM
- 12.1.2.1. Company Overview
- 12.1.2.2. Products
- 12.1.2.3. Company Financials
- 12.1.2.4. SWOT Analysis
- 12.1.3 Garner
- 12.1.3.1. Company Overview
- 12.1.3.2. Products
- 12.1.3.3. Company Financials
- 12.1.3.4. SWOT Analysis
- 12.1.4 VS Security
- 12.1.4.1. Company Overview
- 12.1.4.2. Products
- 12.1.4.3. Company Financials
- 12.1.4.4. SWOT Analysis
- 12.1.5 InfoFort
- 12.1.5.1. Company Overview
- 12.1.5.2. Products
- 12.1.5.3. Company Financials
- 12.1.5.4. SWOT Analysis
- 12.1.6 Shredall SDS Group
- 12.1.6.1. Company Overview
- 12.1.6.2. Products
- 12.1.6.3. Company Financials
- 12.1.6.4. SWOT Analysis
- 12.1.7 Sims Lifecycle Services
- 12.1.7.1. Company Overview
- 12.1.7.2. Products
- 12.1.7.3. Company Financials
- 12.1.7.4. SWOT Analysis
- 12.1.8 DestructData
- 12.1.8.1. Company Overview
- 12.1.8.2. Products
- 12.1.8.3. Company Financials
- 12.1.8.4. SWOT Analysis
- 12.1.9 Ken Research
- 12.1.9.1. Company Overview
- 12.1.9.2. Products
- 12.1.9.3. Company Financials
- 12.1.9.4. SWOT Analysis
- 12.1.10 KLDiscovery
- 12.1.10.1. Company Overview
- 12.1.10.2. Products
- 12.1.10.3. Company Financials
- 12.1.10.4. SWOT Analysis
- 12.1.11 Data Terminator
- 12.1.11.1. Company Overview
- 12.1.11.2. Products
- 12.1.11.3. Company Financials
- 12.1.11.4. SWOT Analysis
- 12.1.12 Wisetek
- 12.1.12.1. Company Overview
- 12.1.12.2. Products
- 12.1.12.3. Company Financials
- 12.1.12.4. SWOT Analysis
- 12.1.13 Guardian
- 12.1.13.1. Company Overview
- 12.1.13.2. Products
- 12.1.13.3. Company Financials
- 12.1.13.4. SWOT Analysis
- 12.1.14 Evergreen IT Solutions
- 12.1.14.1. Company Overview
- 12.1.14.2. Products
- 12.1.14.3. Company Financials
- 12.1.14.4. SWOT Analysis
- 12.1.15 SalvageData
- 12.1.15.1. Company Overview
- 12.1.15.2. Products
- 12.1.15.3. Company Financials
- 12.1.15.4. SWOT Analysis
- 12.1.16 Dell
- 12.1.16.1. Company Overview
- 12.1.16.2. Products
- 12.1.16.3. Company Financials
- 12.1.16.4. SWOT Analysis
- 12.1.17 CyberPilot
- 12.1.17.1. Company Overview
- 12.1.17.2. Products
- 12.1.17.3. Company Financials
- 12.1.17.4. SWOT Analysis
- 12.1.18 Lenovo
- 12.1.18.1. Company Overview
- 12.1.18.2. Products
- 12.1.18.3. Company Financials
- 12.1.18.4. SWOT Analysis
- 12.1.19 Evernex
- 12.1.19.1. Company Overview
- 12.1.19.2. Products
- 12.1.19.3. Company Financials
- 12.1.19.4. SWOT Analysis
- 12.1.20 Liquid Technology
- 12.1.20.1. Company Overview
- 12.1.20.2. Products
- 12.1.20.3. Company Financials
- 12.1.20.4. SWOT Analysis
- 12.1.21 Bell Integration
- 12.1.21.1. Company Overview
- 12.1.21.2. Products
- 12.1.21.3. Company Financials
- 12.1.21.4. SWOT Analysis
- 12.1.22 Shred-it
- 12.1.22.1. Company Overview
- 12.1.22.2. Products
- 12.1.22.3. Company Financials
- 12.1.22.4. SWOT Analysis
- 12.1.23 ICT Reverse
- 12.1.23.1. Company Overview
- 12.1.23.2. Products
- 12.1.23.3. Company Financials
- 12.1.23.4. SWOT Analysis
- 12.1.1 TechGenix
- 12.2. Market Entropy
- 12.2.1 Company's Key Areas Served
- 12.2.2 Recent Developments
- 12.3. Company Market Share Analysis 2025
- 12.3.1 Top 5 Companies Market Share Analysis
- 12.3.2 Top 3 Companies Market Share Analysis
- 12.4. List of Potential Customers
- 13. Research Methodology
List of Figures
- Figure 1: Global Secure Data Destruction Service Revenue Breakdown (undefined, %) by Region 2025 & 2033
- Figure 2: North America Secure Data Destruction Service Revenue (undefined), by Application 2025 & 2033
- Figure 3: North America Secure Data Destruction Service Revenue Share (%), by Application 2025 & 2033
- Figure 4: North America Secure Data Destruction Service Revenue (undefined), by Types 2025 & 2033
- Figure 5: North America Secure Data Destruction Service Revenue Share (%), by Types 2025 & 2033
- Figure 6: North America Secure Data Destruction Service Revenue (undefined), by Country 2025 & 2033
- Figure 7: North America Secure Data Destruction Service Revenue Share (%), by Country 2025 & 2033
- Figure 8: South America Secure Data Destruction Service Revenue (undefined), by Application 2025 & 2033
- Figure 9: South America Secure Data Destruction Service Revenue Share (%), by Application 2025 & 2033
- Figure 10: South America Secure Data Destruction Service Revenue (undefined), by Types 2025 & 2033
- Figure 11: South America Secure Data Destruction Service Revenue Share (%), by Types 2025 & 2033
- Figure 12: South America Secure Data Destruction Service Revenue (undefined), by Country 2025 & 2033
- Figure 13: South America Secure Data Destruction Service Revenue Share (%), by Country 2025 & 2033
- Figure 14: Europe Secure Data Destruction Service Revenue (undefined), by Application 2025 & 2033
- Figure 15: Europe Secure Data Destruction Service Revenue Share (%), by Application 2025 & 2033
- Figure 16: Europe Secure Data Destruction Service Revenue (undefined), by Types 2025 & 2033
- Figure 17: Europe Secure Data Destruction Service Revenue Share (%), by Types 2025 & 2033
- Figure 18: Europe Secure Data Destruction Service Revenue (undefined), by Country 2025 & 2033
- Figure 19: Europe Secure Data Destruction Service Revenue Share (%), by Country 2025 & 2033
- Figure 20: Middle East & Africa Secure Data Destruction Service Revenue (undefined), by Application 2025 & 2033
- Figure 21: Middle East & Africa Secure Data Destruction Service Revenue Share (%), by Application 2025 & 2033
- Figure 22: Middle East & Africa Secure Data Destruction Service Revenue (undefined), by Types 2025 & 2033
- Figure 23: Middle East & Africa Secure Data Destruction Service Revenue Share (%), by Types 2025 & 2033
- Figure 24: Middle East & Africa Secure Data Destruction Service Revenue (undefined), by Country 2025 & 2033
- Figure 25: Middle East & Africa Secure Data Destruction Service Revenue Share (%), by Country 2025 & 2033
- Figure 26: Asia Pacific Secure Data Destruction Service Revenue (undefined), by Application 2025 & 2033
- Figure 27: Asia Pacific Secure Data Destruction Service Revenue Share (%), by Application 2025 & 2033
- Figure 28: Asia Pacific Secure Data Destruction Service Revenue (undefined), by Types 2025 & 2033
- Figure 29: Asia Pacific Secure Data Destruction Service Revenue Share (%), by Types 2025 & 2033
- Figure 30: Asia Pacific Secure Data Destruction Service Revenue (undefined), by Country 2025 & 2033
- Figure 31: Asia Pacific Secure Data Destruction Service Revenue Share (%), by Country 2025 & 2033
List of Tables
- Table 1: Global Secure Data Destruction Service Revenue undefined Forecast, by Application 2020 & 2033
- Table 2: Global Secure Data Destruction Service Revenue undefined Forecast, by Types 2020 & 2033
- Table 3: Global Secure Data Destruction Service Revenue undefined Forecast, by Region 2020 & 2033
- Table 4: Global Secure Data Destruction Service Revenue undefined Forecast, by Application 2020 & 2033
- Table 5: Global Secure Data Destruction Service Revenue undefined Forecast, by Types 2020 & 2033
- Table 6: Global Secure Data Destruction Service Revenue undefined Forecast, by Country 2020 & 2033
- Table 7: United States Secure Data Destruction Service Revenue (undefined) Forecast, by Application 2020 & 2033
- Table 8: Canada Secure Data Destruction Service Revenue (undefined) Forecast, by Application 2020 & 2033
- Table 9: Mexico Secure Data Destruction Service Revenue (undefined) Forecast, by Application 2020 & 2033
- Table 10: Global Secure Data Destruction Service Revenue undefined Forecast, by Application 2020 & 2033
- Table 11: Global Secure Data Destruction Service Revenue undefined Forecast, by Types 2020 & 2033
- Table 12: Global Secure Data Destruction Service Revenue undefined Forecast, by Country 2020 & 2033
- Table 13: Brazil Secure Data Destruction Service Revenue (undefined) Forecast, by Application 2020 & 2033
- Table 14: Argentina Secure Data Destruction Service Revenue (undefined) Forecast, by Application 2020 & 2033
- Table 15: Rest of South America Secure Data Destruction Service Revenue (undefined) Forecast, by Application 2020 & 2033
- Table 16: Global Secure Data Destruction Service Revenue undefined Forecast, by Application 2020 & 2033
- Table 17: Global Secure Data Destruction Service Revenue undefined Forecast, by Types 2020 & 2033
- Table 18: Global Secure Data Destruction Service Revenue undefined Forecast, by Country 2020 & 2033
- Table 19: United Kingdom Secure Data Destruction Service Revenue (undefined) Forecast, by Application 2020 & 2033
- Table 20: Germany Secure Data Destruction Service Revenue (undefined) Forecast, by Application 2020 & 2033
- Table 21: France Secure Data Destruction Service Revenue (undefined) Forecast, by Application 2020 & 2033
- Table 22: Italy Secure Data Destruction Service Revenue (undefined) Forecast, by Application 2020 & 2033
- Table 23: Spain Secure Data Destruction Service Revenue (undefined) Forecast, by Application 2020 & 2033
- Table 24: Russia Secure Data Destruction Service Revenue (undefined) Forecast, by Application 2020 & 2033
- Table 25: Benelux Secure Data Destruction Service Revenue (undefined) Forecast, by Application 2020 & 2033
- Table 26: Nordics Secure Data Destruction Service Revenue (undefined) Forecast, by Application 2020 & 2033
- Table 27: Rest of Europe Secure Data Destruction Service Revenue (undefined) Forecast, by Application 2020 & 2033
- Table 28: Global Secure Data Destruction Service Revenue undefined Forecast, by Application 2020 & 2033
- Table 29: Global Secure Data Destruction Service Revenue undefined Forecast, by Types 2020 & 2033
- Table 30: Global Secure Data Destruction Service Revenue undefined Forecast, by Country 2020 & 2033
- Table 31: Turkey Secure Data Destruction Service Revenue (undefined) Forecast, by Application 2020 & 2033
- Table 32: Israel Secure Data Destruction Service Revenue (undefined) Forecast, by Application 2020 & 2033
- Table 33: GCC Secure Data Destruction Service Revenue (undefined) Forecast, by Application 2020 & 2033
- Table 34: North Africa Secure Data Destruction Service Revenue (undefined) Forecast, by Application 2020 & 2033
- Table 35: South Africa Secure Data Destruction Service Revenue (undefined) Forecast, by Application 2020 & 2033
- Table 36: Rest of Middle East & Africa Secure Data Destruction Service Revenue (undefined) Forecast, by Application 2020 & 2033
- Table 37: Global Secure Data Destruction Service Revenue undefined Forecast, by Application 2020 & 2033
- Table 38: Global Secure Data Destruction Service Revenue undefined Forecast, by Types 2020 & 2033
- Table 39: Global Secure Data Destruction Service Revenue undefined Forecast, by Country 2020 & 2033
- Table 40: China Secure Data Destruction Service Revenue (undefined) Forecast, by Application 2020 & 2033
- Table 41: India Secure Data Destruction Service Revenue (undefined) Forecast, by Application 2020 & 2033
- Table 42: Japan Secure Data Destruction Service Revenue (undefined) Forecast, by Application 2020 & 2033
- Table 43: South Korea Secure Data Destruction Service Revenue (undefined) Forecast, by Application 2020 & 2033
- Table 44: ASEAN Secure Data Destruction Service Revenue (undefined) Forecast, by Application 2020 & 2033
- Table 45: Oceania Secure Data Destruction Service Revenue (undefined) Forecast, by Application 2020 & 2033
- Table 46: Rest of Asia Pacific Secure Data Destruction Service Revenue (undefined) Forecast, by Application 2020 & 2033
Frequently Asked Questions
1. What is the projected Compound Annual Growth Rate (CAGR) of the Secure Data Destruction Service?
The projected CAGR is approximately 10.7%.
2. Which companies are prominent players in the Secure Data Destruction Service?
Key companies in the market include TechGenix, IBM, Garner, VS Security, InfoFort, Shredall SDS Group, Sims Lifecycle Services, DestructData, Ken Research, KLDiscovery, Data Terminator, Wisetek, Guardian, Evergreen IT Solutions, SalvageData, Dell, CyberPilot, Lenovo, Evernex, Liquid Technology, Bell Integration, Shred-it, ICT Reverse.
3. What are the main segments of the Secure Data Destruction Service?
The market segments include Application, Types.
4. Can you provide details about the market size?
The market size is estimated to be USD XXX N/A as of 2022.
5. What are some drivers contributing to market growth?
N/A
6. What are the notable trends driving market growth?
N/A
7. Are there any restraints impacting market growth?
N/A
8. Can you provide examples of recent developments in the market?
N/A
9. What pricing options are available for accessing the report?
Pricing options include single-user, multi-user, and enterprise licenses priced at USD 3950.00, USD 5925.00, and USD 7900.00 respectively.
10. Is the market size provided in terms of value or volume?
The market size is provided in terms of value, measured in N/A.
11. Are there any specific market keywords associated with the report?
Yes, the market keyword associated with the report is "Secure Data Destruction Service," which aids in identifying and referencing the specific market segment covered.
12. How do I determine which pricing option suits my needs best?
The pricing options vary based on user requirements and access needs. Individual users may opt for single-user licenses, while businesses requiring broader access may choose multi-user or enterprise licenses for cost-effective access to the report.
13. Are there any additional resources or data provided in the Secure Data Destruction Service report?
While the report offers comprehensive insights, it's advisable to review the specific contents or supplementary materials provided to ascertain if additional resources or data are available.
14. How can I stay updated on further developments or reports in the Secure Data Destruction Service?
To stay informed about further developments, trends, and reports in the Secure Data Destruction Service, consider subscribing to industry newsletters, following relevant companies and organizations, or regularly checking reputable industry news sources and publications.
Methodology
Step 1 - Identification of Relevant Samples Size from Population Database


Step 2 - Approaches for Defining Global Market Size (Value, Volume* & Price*)

Note*: In applicable scenarios
Step 3 - Data Sources
Primary Research
- Web Analytics
- Survey Reports
- Research Institute
- Latest Research Reports
- Opinion Leaders
Secondary Research
- Annual Reports
- White Paper
- Latest Press Release
- Industry Association
- Paid Database
- Investor Presentations

Step 4 - Data Triangulation
Involves using different sources of information in order to increase the validity of a study
These sources are likely to be stakeholders in a program - participants, other researchers, program staff, other community members, and so on.
Then we put all data in single framework & apply various statistical tools to find out the dynamic on the market.
During the analysis stage, feedback from the stakeholder groups would be compared to determine areas of agreement as well as areas of divergence

