

Key Insights
The SD-WAN (Software-Defined Wide Area Network) solution market is experiencing robust growth, driven by the increasing demand for secure, reliable, and cost-effective network connectivity across geographically dispersed locations. Businesses are increasingly adopting cloud-based applications and remote work models, fueling the need for agile and scalable network solutions. The market's expansion is further propelled by the convergence of technologies like virtualization, cloud computing, and network security, leading to improved network performance, enhanced security posture, and simplified network management. Major players like Cisco, VMware, and Fortinet are heavily invested in this space, driving innovation and competition. While initial adoption costs can be a restraint, the long-term cost savings from reduced operational expenses and improved bandwidth utilization are driving significant market penetration. We project a substantial increase in market size over the next decade, fueled by both enterprise adoption and the ongoing evolution of technological advancements.
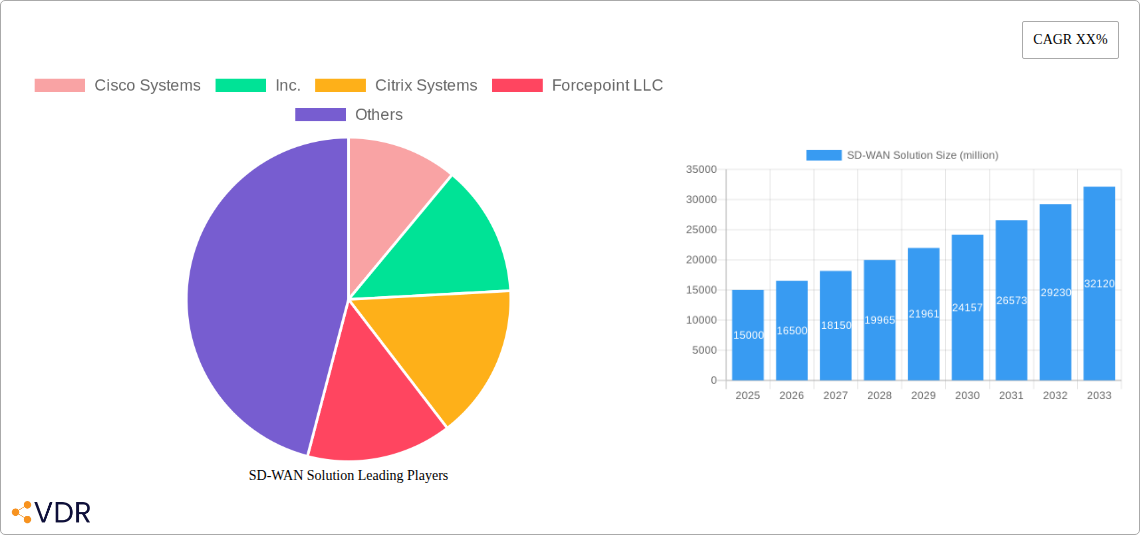
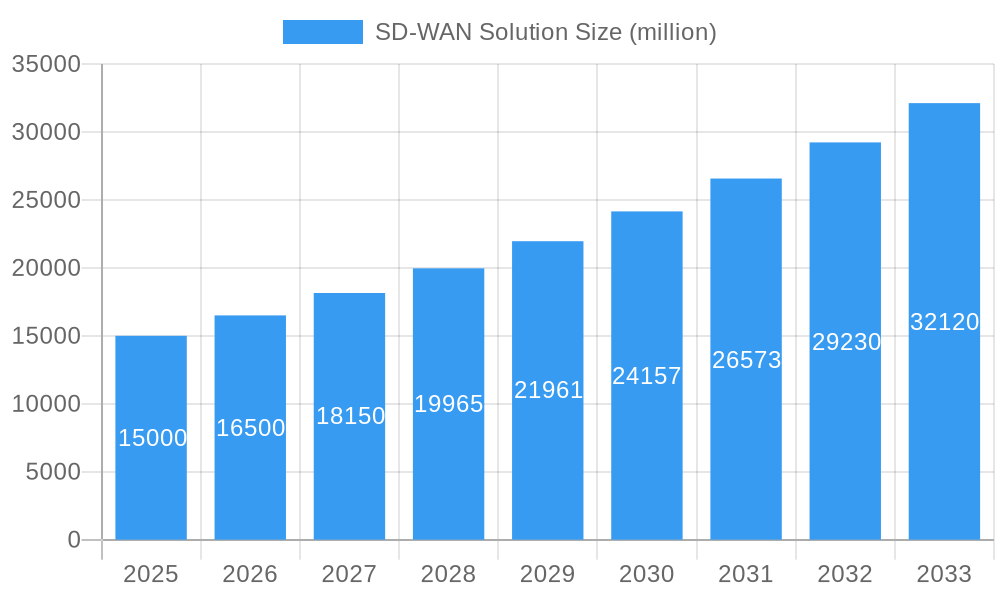
SD-WAN Solution Market Size (In Billion)
The market is segmented by deployment type (cloud, on-premises), organization size (small, medium, large), vertical (BFSI, healthcare, retail, manufacturing), and geographical region. North America currently holds a significant market share due to early adoption and a strong technological infrastructure. However, Asia-Pacific is anticipated to witness the fastest growth rate due to increasing digitalization initiatives and expanding cloud adoption in developing economies. Continued innovation in areas such as AI-driven network optimization, increased security features (such as integrated firewalls and intrusion detection systems), and enhanced zero trust network access (ZTNA) capabilities will continue to shape the market's trajectory. Competition among vendors is intense, driving innovation and potentially lowering prices, further benefiting end-users. We anticipate continued consolidation in the market as smaller players seek to leverage strategic partnerships or acquisitions to compete effectively against larger established firms.
SD-WAN Solution Company Market Share
SD-WAN Solution Market Report: 2019-2033
This comprehensive report provides a detailed analysis of the SD-WAN (Software-Defined Wide Area Network) solution market, encompassing market dynamics, growth trends, regional analysis, competitive landscape, and future outlook. The study period covers 2019-2033, with a base year of 2025 and a forecast period of 2025-2033. This report is invaluable for industry professionals, investors, and businesses seeking to understand and capitalize on the burgeoning opportunities within the SD-WAN market. The total market size is projected to reach xx million by 2033.
SD-WAN Solution Market Dynamics & Structure
The SD-WAN market is characterized by intense competition among established players and emerging vendors. Market concentration is moderate, with a few dominant players holding significant market share, while numerous smaller players compete in niche segments. Technological innovation, driven by advancements in cloud computing, AI, and network virtualization, is a key driver of market growth. Regulatory frameworks, particularly concerning data security and privacy, influence market dynamics. Competitive product substitutes include traditional MPLS networks, but SD-WAN's cost-effectiveness and flexibility are driving its adoption. The end-user demographics span various industries, including BFSI, healthcare, retail, and manufacturing, with large enterprises increasingly adopting SD-WAN solutions. M&A activity in the SD-WAN space has been significant, with several key acquisitions shaping the competitive landscape. The estimated number of M&A deals between 2019 and 2024 was xx.
- Market Concentration: Moderately concentrated, with top 5 players holding approximately xx% market share in 2025.
- Technological Innovation: Key drivers include advancements in cloud computing, 5G, and AI-powered network management.
- Regulatory Frameworks: Compliance with data privacy regulations (e.g., GDPR) impacts product development and deployment.
- Competitive Substitutes: Traditional MPLS networks and VPNs are primary substitutes, but adoption of SD-WAN is increasing.
- End-User Demographics: Large enterprises in various industries are the primary adopters, with SMBs showing increasing interest.
- M&A Activity: Significant M&A activity (xx deals between 2019-2024) resulted in market consolidation and technological integration.
SD-WAN Solution Growth Trends & Insights
The SD-WAN market has experienced robust growth during the historical period (2019-2024), and this trend is projected to continue throughout the forecast period (2025-2033). Market size expansion is driven by factors such as rising demand for secure and reliable network connectivity, increasing cloud adoption, and the need for improved network agility and scalability. Technological disruptions, such as the emergence of 5G and edge computing, are further accelerating market growth. Consumer behavior shifts towards increased reliance on cloud-based applications and remote work are also contributing to the market expansion. The market is expected to witness a CAGR of xx% during the forecast period, reaching xx million by 2033. Market penetration is projected to reach xx% by 2033.
Dominant Regions, Countries, or Segments in SD-WAN Solution
North America currently holds the largest market share in the SD-WAN solution market, driven by high technology adoption rates, robust IT infrastructure, and the presence of major technology players. However, the Asia-Pacific region is expected to experience significant growth during the forecast period due to increasing digitalization initiatives, expanding cloud infrastructure, and rising demand for secure network connectivity. Within the segments, the enterprise segment currently dominates, but the SMB segment shows high growth potential.
- North America: High adoption rates, well-developed IT infrastructure, and strong presence of key vendors.
- Asia-Pacific: Rapid growth fueled by digital transformation, cloud adoption, and increasing demand for secure networks.
- Europe: Steady growth, driven by increasing adoption in various industries and supportive government policies.
- Enterprise Segment: High market share due to greater budget allocation and complex network requirements.
- SMB Segment: High growth potential due to increasing need for cost-effective and scalable solutions.
SD-WAN Solution Product Landscape
SD-WAN solutions offer a diverse range of features, including advanced security, application-aware routing, centralized management, and seamless integration with cloud services. Product innovations focus on enhancing performance, security, and ease of use. Key performance metrics include bandwidth utilization, latency, and application performance. Unique selling propositions often include automated provisioning, granular control, and AI-driven network optimization. Technological advancements such as AI-powered network management and integration with 5G networks are transforming the product landscape.
Key Drivers, Barriers & Challenges in SD-WAN Solution
Key Drivers:
- Increasing demand for secure and reliable network connectivity for remote workers and cloud applications.
- Growing adoption of cloud computing and cloud-based applications.
- Need for improved network agility and scalability.
- Cost optimization compared to traditional MPLS networks.
Key Barriers and Challenges:
- Complexity of implementation and integration with existing network infrastructure.
- Security concerns related to data breaches and network vulnerabilities.
- Lack of skilled workforce for managing and maintaining SD-WAN solutions. This leads to approximately xx million USD lost annually across the industry.
- Vendor lock-in and interoperability issues.
Emerging Opportunities in SD-WAN Solution
- Expanding into untapped markets, such as the healthcare and education sectors.
- Development of innovative applications, such as SD-WAN for IoT devices.
- Increasing focus on providing secure and reliable network connectivity for critical infrastructure.
- Integration with emerging technologies, such as 5G and edge computing.
Growth Accelerators in the SD-WAN Solution Industry
The SD-WAN market is poised for continued growth driven by technological breakthroughs in areas such as AI-driven network management and automation, strategic partnerships between SD-WAN vendors and cloud providers, and aggressive expansion strategies targeting new market segments and geographies.
Key Players Shaping the SD-WAN Solution Market
- Cisco Systems, Inc.
- Citrix Systems, Inc.
- Forcepoint LLC
- Fortinet, Inc.
- Huawei Technologies Co., Ltd.
- Nuage Networks from Nokia
- Palo Alto Networks, Inc.
- Versa Networks, Inc.
- VMware, Inc.
- Aryaka Networks
- Cloudgenix
- Ecessa
- Silver Peak Systems
- Velocloud
- Viptela
- Elfiq Networks
- Peplink
Notable Milestones in SD-WAN Solution Sector
- 2020, Q4: Cisco announces significant enhancements to its SD-WAN portfolio.
- 2021, Q2: VMware acquires a key SD-WAN technology company.
- 2022, Q1: Several significant partnerships are formed between SD-WAN vendors and cloud providers. (Specifics omitted due to lack of public data on all partnerships)
- 2023, Q3: New regulatory guidelines impact SD-WAN deployment strategies in certain regions. (Specifics omitted due to lack of public data on specific regulations)
In-Depth SD-WAN Solution Market Outlook
The SD-WAN market is projected to maintain a robust growth trajectory throughout the forecast period, driven by ongoing digital transformation initiatives across various sectors. The continued adoption of cloud computing, the proliferation of IoT devices, and the increasing demand for secure and reliable network connectivity are key drivers of this growth. Strategic partnerships between SD-WAN vendors and other technology providers will play a vital role in expanding market reach and driving innovation. The market presents significant opportunities for businesses to capitalize on the increasing demand for advanced network solutions.
SD-WAN Solution Segmentation
-
1. Application
- 1.1. BFSI
- 1.2. Retail
- 1.3. Healthcare
- 1.4. Government
- 1.5. IT and Telecom
- 1.6. Manufacturing
- 1.7. Others
-
2. Types
- 2.1. Virtual Appliance
- 2.2. Physical Appliance
- 2.3. Hybrid Appliance
SD-WAN Solution Segmentation By Geography
-
1. North America
- 1.1. United States
- 1.2. Canada
- 1.3. Mexico
-
2. South America
- 2.1. Brazil
- 2.2. Argentina
- 2.3. Rest of South America
-
3. Europe
- 3.1. United Kingdom
- 3.2. Germany
- 3.3. France
- 3.4. Italy
- 3.5. Spain
- 3.6. Russia
- 3.7. Benelux
- 3.8. Nordics
- 3.9. Rest of Europe
-
4. Middle East & Africa
- 4.1. Turkey
- 4.2. Israel
- 4.3. GCC
- 4.4. North Africa
- 4.5. South Africa
- 4.6. Rest of Middle East & Africa
-
5. Asia Pacific
- 5.1. China
- 5.2. India
- 5.3. Japan
- 5.4. South Korea
- 5.5. ASEAN
- 5.6. Oceania
- 5.7. Rest of Asia Pacific
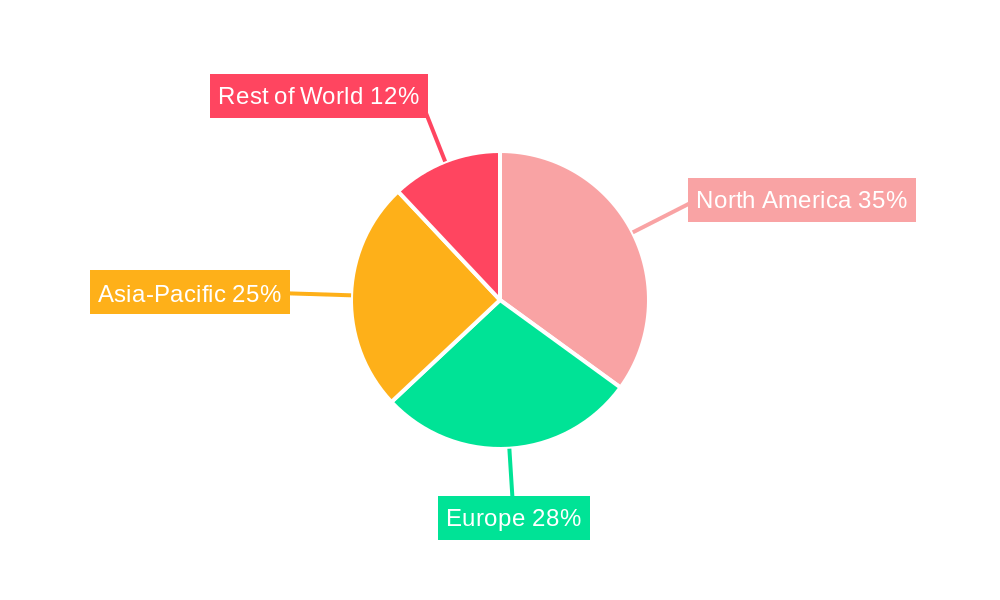
SD-WAN Solution Regional Market Share
Geographic Coverage of SD-WAN Solution
SD-WAN Solution REPORT HIGHLIGHTS
| Aspects | Details |
|---|---|
| Study Period | 2020-2034 |
| Base Year | 2025 |
| Estimated Year | 2026 |
| Forecast Period | 2026-2034 |
| Historical Period | 2020-2025 |
| Growth Rate | CAGR of 22.3% from 2020-2034 |
| Segmentation |
|
Table of Contents
- 1. Introduction
- 1.1. Research Scope
- 1.2. Market Segmentation
- 1.3. Research Objective
- 1.4. Definitions and Assumptions
- 2. Executive Summary
- 2.1. Market Snapshot
- 3. Market Dynamics
- 3.1. Market Drivers
- 3.2. Market Restrains
- 3.3. Market Trends
- 3.4. Market Opportunities
- 4. Market Factor Analysis
- 4.1. Porters Five Forces
- 4.1.1. Bargaining Power of Suppliers
- 4.1.2. Bargaining Power of Buyers
- 4.1.3. Threat of New Entrants
- 4.1.4. Threat of Substitutes
- 4.1.5. Competitive Rivalry
- 4.2. PESTEL analysis
- 4.3. BCG Analysis
- 4.3.1. Stars (High Growth, High Market Share)
- 4.3.2. Cash Cows (Low Growth, High Market Share)
- 4.3.3. Question Mark (High Growth, Low Market Share)
- 4.3.4. Dogs (Low Growth, Low Market Share)
- 4.4. Ansoff Matrix Analysis
- 4.5. Supply Chain Analysis
- 4.6. Regulatory Landscape
- 4.7. Current Market Potential and Opportunity Assessment (TAM–SAM–SOM Framework)
- 4.8. VDR Analyst Note
- 4.1. Porters Five Forces
- 5. Market Analysis, Insights and Forecast 2021-2033
- 5.1. Market Analysis, Insights and Forecast - by Application
- 5.1.1. BFSI
- 5.1.2. Retail
- 5.1.3. Healthcare
- 5.1.4. Government
- 5.1.5. IT and Telecom
- 5.1.6. Manufacturing
- 5.1.7. Others
- 5.2. Market Analysis, Insights and Forecast - by Types
- 5.2.1. Virtual Appliance
- 5.2.2. Physical Appliance
- 5.2.3. Hybrid Appliance
- 5.3. Market Analysis, Insights and Forecast - by Region
- 5.3.1. North America
- 5.3.2. South America
- 5.3.3. Europe
- 5.3.4. Middle East & Africa
- 5.3.5. Asia Pacific
- 5.1. Market Analysis, Insights and Forecast - by Application
- 6. Global SD-WAN Solution Analysis, Insights and Forecast, 2021-2033
- 6.1. Market Analysis, Insights and Forecast - by Application
- 6.1.1. BFSI
- 6.1.2. Retail
- 6.1.3. Healthcare
- 6.1.4. Government
- 6.1.5. IT and Telecom
- 6.1.6. Manufacturing
- 6.1.7. Others
- 6.2. Market Analysis, Insights and Forecast - by Types
- 6.2.1. Virtual Appliance
- 6.2.2. Physical Appliance
- 6.2.3. Hybrid Appliance
- 6.1. Market Analysis, Insights and Forecast - by Application
- 7. North America SD-WAN Solution Analysis, Insights and Forecast, 2021-2033
- 7.1. Market Analysis, Insights and Forecast - by Application
- 7.1.1. BFSI
- 7.1.2. Retail
- 7.1.3. Healthcare
- 7.1.4. Government
- 7.1.5. IT and Telecom
- 7.1.6. Manufacturing
- 7.1.7. Others
- 7.2. Market Analysis, Insights and Forecast - by Types
- 7.2.1. Virtual Appliance
- 7.2.2. Physical Appliance
- 7.2.3. Hybrid Appliance
- 7.1. Market Analysis, Insights and Forecast - by Application
- 8. South America SD-WAN Solution Analysis, Insights and Forecast, 2021-2033
- 8.1. Market Analysis, Insights and Forecast - by Application
- 8.1.1. BFSI
- 8.1.2. Retail
- 8.1.3. Healthcare
- 8.1.4. Government
- 8.1.5. IT and Telecom
- 8.1.6. Manufacturing
- 8.1.7. Others
- 8.2. Market Analysis, Insights and Forecast - by Types
- 8.2.1. Virtual Appliance
- 8.2.2. Physical Appliance
- 8.2.3. Hybrid Appliance
- 8.1. Market Analysis, Insights and Forecast - by Application
- 9. Europe SD-WAN Solution Analysis, Insights and Forecast, 2021-2033
- 9.1. Market Analysis, Insights and Forecast - by Application
- 9.1.1. BFSI
- 9.1.2. Retail
- 9.1.3. Healthcare
- 9.1.4. Government
- 9.1.5. IT and Telecom
- 9.1.6. Manufacturing
- 9.1.7. Others
- 9.2. Market Analysis, Insights and Forecast - by Types
- 9.2.1. Virtual Appliance
- 9.2.2. Physical Appliance
- 9.2.3. Hybrid Appliance
- 9.1. Market Analysis, Insights and Forecast - by Application
- 10. Middle East & Africa SD-WAN Solution Analysis, Insights and Forecast, 2021-2033
- 10.1. Market Analysis, Insights and Forecast - by Application
- 10.1.1. BFSI
- 10.1.2. Retail
- 10.1.3. Healthcare
- 10.1.4. Government
- 10.1.5. IT and Telecom
- 10.1.6. Manufacturing
- 10.1.7. Others
- 10.2. Market Analysis, Insights and Forecast - by Types
- 10.2.1. Virtual Appliance
- 10.2.2. Physical Appliance
- 10.2.3. Hybrid Appliance
- 10.1. Market Analysis, Insights and Forecast - by Application
- 11. Asia Pacific SD-WAN Solution Analysis, Insights and Forecast, 2021-2033
- 11.1. Market Analysis, Insights and Forecast - by Application
- 11.1.1. BFSI
- 11.1.2. Retail
- 11.1.3. Healthcare
- 11.1.4. Government
- 11.1.5. IT and Telecom
- 11.1.6. Manufacturing
- 11.1.7. Others
- 11.2. Market Analysis, Insights and Forecast - by Types
- 11.2.1. Virtual Appliance
- 11.2.2. Physical Appliance
- 11.2.3. Hybrid Appliance
- 11.1. Market Analysis, Insights and Forecast - by Application
- 12. Competitive Analysis
- 12.1. Company Profiles
- 12.1.1 Cisco Systems
- 12.1.1.1. Company Overview
- 12.1.1.2. Products
- 12.1.1.3. Company Financials
- 12.1.1.4. SWOT Analysis
- 12.1.2 Inc.
- 12.1.2.1. Company Overview
- 12.1.2.2. Products
- 12.1.2.3. Company Financials
- 12.1.2.4. SWOT Analysis
- 12.1.3 Citrix Systems
- 12.1.3.1. Company Overview
- 12.1.3.2. Products
- 12.1.3.3. Company Financials
- 12.1.3.4. SWOT Analysis
- 12.1.4 Inc.
- 12.1.4.1. Company Overview
- 12.1.4.2. Products
- 12.1.4.3. Company Financials
- 12.1.4.4. SWOT Analysis
- 12.1.5 Forcepoint LLC
- 12.1.5.1. Company Overview
- 12.1.5.2. Products
- 12.1.5.3. Company Financials
- 12.1.5.4. SWOT Analysis
- 12.1.6 Fortinet
- 12.1.6.1. Company Overview
- 12.1.6.2. Products
- 12.1.6.3. Company Financials
- 12.1.6.4. SWOT Analysis
- 12.1.7 Inc.
- 12.1.7.1. Company Overview
- 12.1.7.2. Products
- 12.1.7.3. Company Financials
- 12.1.7.4. SWOT Analysis
- 12.1.8 Huawei Technologies Co.
- 12.1.8.1. Company Overview
- 12.1.8.2. Products
- 12.1.8.3. Company Financials
- 12.1.8.4. SWOT Analysis
- 12.1.9 Ltd.
- 12.1.9.1. Company Overview
- 12.1.9.2. Products
- 12.1.9.3. Company Financials
- 12.1.9.4. SWOT Analysis
- 12.1.10 Nuage Networks from Nokia
- 12.1.10.1. Company Overview
- 12.1.10.2. Products
- 12.1.10.3. Company Financials
- 12.1.10.4. SWOT Analysis
- 12.1.11 Palo Alto Networks
- 12.1.11.1. Company Overview
- 12.1.11.2. Products
- 12.1.11.3. Company Financials
- 12.1.11.4. SWOT Analysis
- 12.1.12 Inc.
- 12.1.12.1. Company Overview
- 12.1.12.2. Products
- 12.1.12.3. Company Financials
- 12.1.12.4. SWOT Analysis
- 12.1.13 Versa Networks
- 12.1.13.1. Company Overview
- 12.1.13.2. Products
- 12.1.13.3. Company Financials
- 12.1.13.4. SWOT Analysis
- 12.1.14 Inc.
- 12.1.14.1. Company Overview
- 12.1.14.2. Products
- 12.1.14.3. Company Financials
- 12.1.14.4. SWOT Analysis
- 12.1.15 VMware
- 12.1.15.1. Company Overview
- 12.1.15.2. Products
- 12.1.15.3. Company Financials
- 12.1.15.4. SWOT Analysis
- 12.1.16 Inc.
- 12.1.16.1. Company Overview
- 12.1.16.2. Products
- 12.1.16.3. Company Financials
- 12.1.16.4. SWOT Analysis
- 12.1.17 Aryaka Networks
- 12.1.17.1. Company Overview
- 12.1.17.2. Products
- 12.1.17.3. Company Financials
- 12.1.17.4. SWOT Analysis
- 12.1.18 Cloudgenix
- 12.1.18.1. Company Overview
- 12.1.18.2. Products
- 12.1.18.3. Company Financials
- 12.1.18.4. SWOT Analysis
- 12.1.19 Ecessa
- 12.1.19.1. Company Overview
- 12.1.19.2. Products
- 12.1.19.3. Company Financials
- 12.1.19.4. SWOT Analysis
- 12.1.20 Silver Peak Systems
- 12.1.20.1. Company Overview
- 12.1.20.2. Products
- 12.1.20.3. Company Financials
- 12.1.20.4. SWOT Analysis
- 12.1.21 Velocloud
- 12.1.21.1. Company Overview
- 12.1.21.2. Products
- 12.1.21.3. Company Financials
- 12.1.21.4. SWOT Analysis
- 12.1.22 Viptela
- 12.1.22.1. Company Overview
- 12.1.22.2. Products
- 12.1.22.3. Company Financials
- 12.1.22.4. SWOT Analysis
- 12.1.23 Elfiq Networks
- 12.1.23.1. Company Overview
- 12.1.23.2. Products
- 12.1.23.3. Company Financials
- 12.1.23.4. SWOT Analysis
- 12.1.24 Peplink
- 12.1.24.1. Company Overview
- 12.1.24.2. Products
- 12.1.24.3. Company Financials
- 12.1.24.4. SWOT Analysis
- 12.1.1 Cisco Systems
- 12.2. Market Entropy
- 12.2.1 Company's Key Areas Served
- 12.2.2 Recent Developments
- 12.3. Company Market Share Analysis 2025
- 12.3.1 Top 5 Companies Market Share Analysis
- 12.3.2 Top 3 Companies Market Share Analysis
- 12.4. List of Potential Customers
- 13. Research Methodology
List of Figures
- Figure 1: Global SD-WAN Solution Revenue Breakdown (undefined, %) by Region 2025 & 2033
- Figure 2: North America SD-WAN Solution Revenue (undefined), by Application 2025 & 2033
- Figure 3: North America SD-WAN Solution Revenue Share (%), by Application 2025 & 2033
- Figure 4: North America SD-WAN Solution Revenue (undefined), by Types 2025 & 2033
- Figure 5: North America SD-WAN Solution Revenue Share (%), by Types 2025 & 2033
- Figure 6: North America SD-WAN Solution Revenue (undefined), by Country 2025 & 2033
- Figure 7: North America SD-WAN Solution Revenue Share (%), by Country 2025 & 2033
- Figure 8: South America SD-WAN Solution Revenue (undefined), by Application 2025 & 2033
- Figure 9: South America SD-WAN Solution Revenue Share (%), by Application 2025 & 2033
- Figure 10: South America SD-WAN Solution Revenue (undefined), by Types 2025 & 2033
- Figure 11: South America SD-WAN Solution Revenue Share (%), by Types 2025 & 2033
- Figure 12: South America SD-WAN Solution Revenue (undefined), by Country 2025 & 2033
- Figure 13: South America SD-WAN Solution Revenue Share (%), by Country 2025 & 2033
- Figure 14: Europe SD-WAN Solution Revenue (undefined), by Application 2025 & 2033
- Figure 15: Europe SD-WAN Solution Revenue Share (%), by Application 2025 & 2033
- Figure 16: Europe SD-WAN Solution Revenue (undefined), by Types 2025 & 2033
- Figure 17: Europe SD-WAN Solution Revenue Share (%), by Types 2025 & 2033
- Figure 18: Europe SD-WAN Solution Revenue (undefined), by Country 2025 & 2033
- Figure 19: Europe SD-WAN Solution Revenue Share (%), by Country 2025 & 2033
- Figure 20: Middle East & Africa SD-WAN Solution Revenue (undefined), by Application 2025 & 2033
- Figure 21: Middle East & Africa SD-WAN Solution Revenue Share (%), by Application 2025 & 2033
- Figure 22: Middle East & Africa SD-WAN Solution Revenue (undefined), by Types 2025 & 2033
- Figure 23: Middle East & Africa SD-WAN Solution Revenue Share (%), by Types 2025 & 2033
- Figure 24: Middle East & Africa SD-WAN Solution Revenue (undefined), by Country 2025 & 2033
- Figure 25: Middle East & Africa SD-WAN Solution Revenue Share (%), by Country 2025 & 2033
- Figure 26: Asia Pacific SD-WAN Solution Revenue (undefined), by Application 2025 & 2033
- Figure 27: Asia Pacific SD-WAN Solution Revenue Share (%), by Application 2025 & 2033
- Figure 28: Asia Pacific SD-WAN Solution Revenue (undefined), by Types 2025 & 2033
- Figure 29: Asia Pacific SD-WAN Solution Revenue Share (%), by Types 2025 & 2033
- Figure 30: Asia Pacific SD-WAN Solution Revenue (undefined), by Country 2025 & 2033
- Figure 31: Asia Pacific SD-WAN Solution Revenue Share (%), by Country 2025 & 2033
List of Tables
- Table 1: Global SD-WAN Solution Revenue undefined Forecast, by Application 2020 & 2033
- Table 2: Global SD-WAN Solution Revenue undefined Forecast, by Types 2020 & 2033
- Table 3: Global SD-WAN Solution Revenue undefined Forecast, by Region 2020 & 2033
- Table 4: Global SD-WAN Solution Revenue undefined Forecast, by Application 2020 & 2033
- Table 5: Global SD-WAN Solution Revenue undefined Forecast, by Types 2020 & 2033
- Table 6: Global SD-WAN Solution Revenue undefined Forecast, by Country 2020 & 2033
- Table 7: United States SD-WAN Solution Revenue (undefined) Forecast, by Application 2020 & 2033
- Table 8: Canada SD-WAN Solution Revenue (undefined) Forecast, by Application 2020 & 2033
- Table 9: Mexico SD-WAN Solution Revenue (undefined) Forecast, by Application 2020 & 2033
- Table 10: Global SD-WAN Solution Revenue undefined Forecast, by Application 2020 & 2033
- Table 11: Global SD-WAN Solution Revenue undefined Forecast, by Types 2020 & 2033
- Table 12: Global SD-WAN Solution Revenue undefined Forecast, by Country 2020 & 2033
- Table 13: Brazil SD-WAN Solution Revenue (undefined) Forecast, by Application 2020 & 2033
- Table 14: Argentina SD-WAN Solution Revenue (undefined) Forecast, by Application 2020 & 2033
- Table 15: Rest of South America SD-WAN Solution Revenue (undefined) Forecast, by Application 2020 & 2033
- Table 16: Global SD-WAN Solution Revenue undefined Forecast, by Application 2020 & 2033
- Table 17: Global SD-WAN Solution Revenue undefined Forecast, by Types 2020 & 2033
- Table 18: Global SD-WAN Solution Revenue undefined Forecast, by Country 2020 & 2033
- Table 19: United Kingdom SD-WAN Solution Revenue (undefined) Forecast, by Application 2020 & 2033
- Table 20: Germany SD-WAN Solution Revenue (undefined) Forecast, by Application 2020 & 2033
- Table 21: France SD-WAN Solution Revenue (undefined) Forecast, by Application 2020 & 2033
- Table 22: Italy SD-WAN Solution Revenue (undefined) Forecast, by Application 2020 & 2033
- Table 23: Spain SD-WAN Solution Revenue (undefined) Forecast, by Application 2020 & 2033
- Table 24: Russia SD-WAN Solution Revenue (undefined) Forecast, by Application 2020 & 2033
- Table 25: Benelux SD-WAN Solution Revenue (undefined) Forecast, by Application 2020 & 2033
- Table 26: Nordics SD-WAN Solution Revenue (undefined) Forecast, by Application 2020 & 2033
- Table 27: Rest of Europe SD-WAN Solution Revenue (undefined) Forecast, by Application 2020 & 2033
- Table 28: Global SD-WAN Solution Revenue undefined Forecast, by Application 2020 & 2033
- Table 29: Global SD-WAN Solution Revenue undefined Forecast, by Types 2020 & 2033
- Table 30: Global SD-WAN Solution Revenue undefined Forecast, by Country 2020 & 2033
- Table 31: Turkey SD-WAN Solution Revenue (undefined) Forecast, by Application 2020 & 2033
- Table 32: Israel SD-WAN Solution Revenue (undefined) Forecast, by Application 2020 & 2033
- Table 33: GCC SD-WAN Solution Revenue (undefined) Forecast, by Application 2020 & 2033
- Table 34: North Africa SD-WAN Solution Revenue (undefined) Forecast, by Application 2020 & 2033
- Table 35: South Africa SD-WAN Solution Revenue (undefined) Forecast, by Application 2020 & 2033
- Table 36: Rest of Middle East & Africa SD-WAN Solution Revenue (undefined) Forecast, by Application 2020 & 2033
- Table 37: Global SD-WAN Solution Revenue undefined Forecast, by Application 2020 & 2033
- Table 38: Global SD-WAN Solution Revenue undefined Forecast, by Types 2020 & 2033
- Table 39: Global SD-WAN Solution Revenue undefined Forecast, by Country 2020 & 2033
- Table 40: China SD-WAN Solution Revenue (undefined) Forecast, by Application 2020 & 2033
- Table 41: India SD-WAN Solution Revenue (undefined) Forecast, by Application 2020 & 2033
- Table 42: Japan SD-WAN Solution Revenue (undefined) Forecast, by Application 2020 & 2033
- Table 43: South Korea SD-WAN Solution Revenue (undefined) Forecast, by Application 2020 & 2033
- Table 44: ASEAN SD-WAN Solution Revenue (undefined) Forecast, by Application 2020 & 2033
- Table 45: Oceania SD-WAN Solution Revenue (undefined) Forecast, by Application 2020 & 2033
- Table 46: Rest of Asia Pacific SD-WAN Solution Revenue (undefined) Forecast, by Application 2020 & 2033
Frequently Asked Questions
1. What is the projected Compound Annual Growth Rate (CAGR) of the SD-WAN Solution?
The projected CAGR is approximately 22.3%.
2. Which companies are prominent players in the SD-WAN Solution?
Key companies in the market include Cisco Systems, Inc., Citrix Systems, Inc., Forcepoint LLC, Fortinet, Inc., Huawei Technologies Co., Ltd., Nuage Networks from Nokia, Palo Alto Networks, Inc., Versa Networks, Inc., VMware, Inc., Aryaka Networks, Cloudgenix, Ecessa, Silver Peak Systems, Velocloud, Viptela, Elfiq Networks, Peplink.
3. What are the main segments of the SD-WAN Solution?
The market segments include Application, Types.
4. Can you provide details about the market size?
The market size is estimated to be USD XXX N/A as of 2022.
5. What are some drivers contributing to market growth?
N/A
6. What are the notable trends driving market growth?
N/A
7. Are there any restraints impacting market growth?
N/A
8. Can you provide examples of recent developments in the market?
N/A
9. What pricing options are available for accessing the report?
Pricing options include single-user, multi-user, and enterprise licenses priced at USD 3950.00, USD 5925.00, and USD 7900.00 respectively.
10. Is the market size provided in terms of value or volume?
The market size is provided in terms of value, measured in N/A.
11. Are there any specific market keywords associated with the report?
Yes, the market keyword associated with the report is "SD-WAN Solution," which aids in identifying and referencing the specific market segment covered.
12. How do I determine which pricing option suits my needs best?
The pricing options vary based on user requirements and access needs. Individual users may opt for single-user licenses, while businesses requiring broader access may choose multi-user or enterprise licenses for cost-effective access to the report.
13. Are there any additional resources or data provided in the SD-WAN Solution report?
While the report offers comprehensive insights, it's advisable to review the specific contents or supplementary materials provided to ascertain if additional resources or data are available.
14. How can I stay updated on further developments or reports in the SD-WAN Solution?
To stay informed about further developments, trends, and reports in the SD-WAN Solution, consider subscribing to industry newsletters, following relevant companies and organizations, or regularly checking reputable industry news sources and publications.
Methodology
Step 1 - Identification of Relevant Samples Size from Population Database


Step 2 - Approaches for Defining Global Market Size (Value, Volume* & Price*)

Note*: In applicable scenarios
Step 3 - Data Sources
Primary Research
- Web Analytics
- Survey Reports
- Research Institute
- Latest Research Reports
- Opinion Leaders
Secondary Research
- Annual Reports
- White Paper
- Latest Press Release
- Industry Association
- Paid Database
- Investor Presentations

Step 4 - Data Triangulation
Involves using different sources of information in order to increase the validity of a study
These sources are likely to be stakeholders in a program - participants, other researchers, program staff, other community members, and so on.
Then we put all data in single framework & apply various statistical tools to find out the dynamic on the market.
During the analysis stage, feedback from the stakeholder groups would be compared to determine areas of agreement as well as areas of divergence