
Key Insights
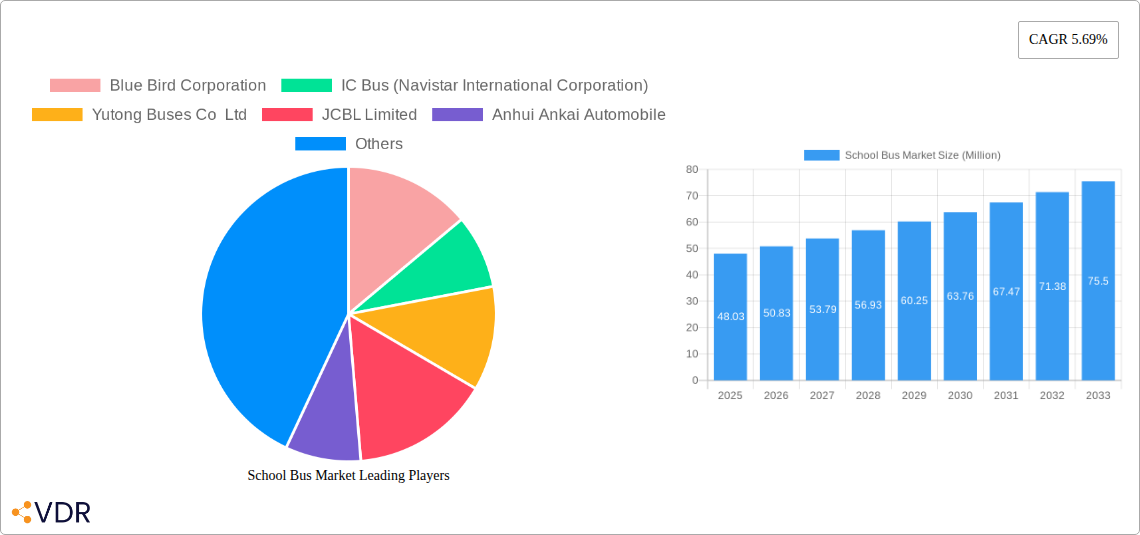
The global school bus market, valued at $48.03 million in 2025, is projected to experience robust growth, driven by increasing school-age populations, particularly in developing economies, and rising government investments in infrastructure and education. The market's Compound Annual Growth Rate (CAGR) of 5.69% from 2025 to 2033 indicates a significant expansion opportunity. Key market drivers include the increasing demand for safer and more efficient transportation solutions for students, stricter emission regulations prompting adoption of CNG/LNG and electric buses, and the growing preference for technologically advanced vehicles equipped with safety features like GPS tracking and improved security systems. Furthermore, the shift towards sustainable transportation is fueling the adoption of electric and hybrid school buses, while government initiatives promoting green transportation are further accelerating this trend. However, the market faces certain restraints, including high initial investment costs associated with electric and hybrid buses, potential supply chain disruptions affecting vehicle production, and economic fluctuations impacting government budgets allocated to school transportation.
Market segmentation reveals a diverse landscape. The Internal Combustion Engine (ICE) segment currently holds a significant share, but the Electric and Hybrid segment is expected to witness the fastest growth due to environmental concerns and technological advancements. In terms of capacity, Type A buses (smaller buses) are likely to maintain a considerable market share due to their suitability for smaller school districts and shorter routes, while larger capacity types (B, C, and D) will cater to larger schools and longer distances. Geographically, North America and Asia Pacific are anticipated to dominate the market, driven by significant school-age populations and relatively higher disposable incomes. Europe is expected to show steady growth, influenced by environmental policies and investments in sustainable transportation. The presence of established players like Blue Bird Corporation, IC Bus, and Yutong Buses, along with emerging players such as Lion Electric Company, indicates a competitive yet dynamic market landscape conducive to innovation and expansion.
School Bus Market: A Comprehensive Report (2019-2033)
This comprehensive report provides an in-depth analysis of the global school bus market, encompassing market dynamics, growth trends, regional dominance, product landscape, key players, and future outlook. Targeting both parent (school districts, government agencies) and child (students, parents) markets, this report offers crucial insights for industry professionals, investors, and strategic decision-makers. The study period covers 2019-2033, with 2025 as the base and estimated year.
Study Period: 2019–2033 Base Year: 2025 Estimated Year: 2025 Forecast Period: 2025–2033 Historical Period: 2019–2024
School Bus Market Market Dynamics & Structure
The school bus market is characterized by moderate concentration, with several major players vying for market share. Technological innovation, driven by stricter emission regulations and a push for sustainable transportation, is a key dynamic. Governmental mandates and funding policies significantly influence market growth, while rising fuel costs and increasing safety concerns further shape the market landscape. The market also sees increasing adoption of electric and hybrid vehicles, presenting both opportunities and challenges. Mergers and acquisitions (M&A) activity is relatively low, but strategic partnerships are increasing. The end-user demographic primarily comprises school districts and private schools, with variations in purchasing power and transportation needs across regions.
- Market Concentration: Moderately concentrated, with top 5 players holding approximately xx% market share (2024).
- Technological Innovation: Focus on electric, hybrid, and CNG/LNG propulsion systems to meet environmental regulations.
- Regulatory Framework: Stringent emission standards and safety regulations are primary drivers and barriers.
- Competitive Substitutes: Limited direct substitutes, but competition exists from other forms of school transportation.
- End-User Demographics: Primarily school districts and private schools, with variations in budget and needs across regions.
- M&A Trends: Relatively low M&A activity; strategic partnerships are a growing trend. xx M&A deals in the last 5 years.
School Bus Market Growth Trends & Insights
The global school bus market exhibits a steady growth trajectory, driven by factors such as increasing school enrollment, government initiatives promoting school safety, and the transition towards cleaner transportation solutions. Market size is projected to reach xx million units by 2033, exhibiting a CAGR of xx% during the forecast period. This growth is fueled by the increasing adoption of electric and hybrid school buses in developed nations and the expansion of school bus fleets in developing economies. Technological disruptions, such as the introduction of advanced safety features and connected vehicle technologies, are also accelerating market growth. Consumer behavior is shifting towards demands for enhanced safety, environmental friendliness, and fuel efficiency, shaping product development strategies.

Dominant Regions, Countries, or Segments in School Bus Market
North America currently holds the largest market share, driven by strong government support for school bus electrification and a relatively well-developed school transportation infrastructure. However, Asia-Pacific is projected to witness significant growth due to rapid urbanization, rising school enrollment, and increasing government investments in public transportation.
By Propulsion Type: Internal Combustion Engine (ICE) still dominates, but Electric and Hybrid segments are experiencing rapid growth, particularly in developed countries.
By Capacity Design Type: Type C buses hold the largest market share due to their versatility and suitability for various school transportation needs.
Key Drivers: Government regulations (emission standards, safety mandates), rising school enrollment, increased focus on student safety, and infrastructure development.
North America Dominance: Driven by significant government funding and early adoption of electric school buses.
Asia-Pacific Growth: Fueled by rapid urbanization, increasing school enrollment, and government investments in public transport.
Europe's Steady Growth: Driven by environmental regulations and focus on sustainable transportation.
School Bus Market Product Landscape
The school bus market showcases a range of vehicles, from conventional ICE buses to advanced electric and hybrid models. Innovation focuses on enhancing safety features (e.g., cameras, sensors, collision avoidance systems), improving fuel efficiency, and reducing emissions. Key selling propositions include improved safety, reduced operating costs (especially for electric buses), and compliance with stringent emission regulations. Technological advancements are primarily concentrated in propulsion systems, telematics, and safety features.
Key Drivers, Barriers & Challenges in School Bus Market
Key Drivers:
- Increasing school enrollment globally.
- Stringent government regulations promoting safety and reduced emissions.
- Growing demand for fuel-efficient and environmentally friendly vehicles.
- Technological advancements in electric and hybrid bus technologies.
Challenges and Restraints:
- High initial cost of electric and hybrid school buses.
- Limited charging infrastructure for electric buses in some regions.
- Supply chain disruptions impacting the availability of components.
- Competition from alternative school transportation methods.
Emerging Opportunities in School Bus Market
- Expansion in developing markets with growing school populations.
- Development of autonomous driving features for enhanced safety and efficiency.
- Integration of advanced telematics systems for real-time monitoring and improved fleet management.
- Increased focus on providing accessible buses for students with disabilities.
Growth Accelerators in the School Bus Market Industry
Long-term growth will be fueled by continued technological advancements in electric and alternative fuel technologies, coupled with supportive government policies that incentivize the adoption of cleaner and safer school buses. Strategic partnerships between bus manufacturers and technology providers will also play a significant role in accelerating market expansion and innovation. The increasing focus on school bus safety and sustainability will further drive long-term growth.
Key Players Shaping the School Bus Market Market
- Blue Bird Corporation
- IC Bus (Navistar International Corporation)
- Yutong Buses Co Ltd
- JCBL Limited
- Anhui Ankai Automobile
- Thomas Built Buses Inc
- Lion Electric Company
- Collins Bus Corporation
- Tata Motor
Notable Milestones in School Bus Market Sector
- Dec 2023: GreenPower Motor Company secured its first orders for the all-electric Nano BEAST school bus in New York.
- Oct 2023: GreenPower unveiled the Mega BEAST, a Type D electric school bus with a 140-mile range.
- Sept 2023: Phoenix Motor Inc. received an order for ten all-electric Type-A school buses in the District of Columbia.
In-Depth School Bus Market Market Outlook
The future of the school bus market is bright, driven by the continued adoption of electric and hybrid vehicles, coupled with advancements in safety technologies and the growing emphasis on sustainable transportation solutions. Strategic partnerships and innovative business models are key to unlocking significant market potential in both developed and developing nations. The focus on improving safety and reducing environmental impact will continue to shape the industry's growth trajectory, creating opportunities for businesses that can meet these evolving demands.
School Bus Market Segmentation
-
1. Propulsion Type
- 1.1. Internal Combustion Engine (ICE)
- 1.2. Compress
- 1.3. Electric and Hybrid
-
2. Capacity Design Type
- 2.1. Type A
- 2.2. Type B
- 2.3. Type C
- 2.4. Type D
School Bus Market Segmentation By Geography
-
1. North America
- 1.1. United States
- 1.2. Canada
- 1.3. Mexico
- 1.4. Rest of North America
-
2. Europe
- 2.1. Germany
- 2.2. United Kingdom
- 2.3. France
- 2.4. Russia
- 2.5. Spain
- 2.6. Rest of Europe
-
3. Asia Pacific
- 3.1. China
- 3.2. India
- 3.3. Japan
- 3.4. South Korea
- 3.5. Rest of Asia Pacific
-
4. Rest of the World
- 4.1. South America
- 4.2. Middle East and Africa

School Bus Market REPORT HIGHLIGHTS
| Aspects | Details |
|---|---|
| Study Period | 2019-2033 |
| Base Year | 2024 |
| Estimated Year | 2025 |
| Forecast Period | 2025-2033 |
| Historical Period | 2019-2024 |
| Growth Rate | CAGR of 5.69% from 2019-2033 |
| Segmentation |
|
Table of Contents
- 1. Introduction
- 1.1. Research Scope
- 1.2. Market Segmentation
- 1.3. Research Methodology
- 1.4. Definitions and Assumptions
- 2. Executive Summary
- 2.1. Introduction
- 3. Market Dynamics
- 3.1. Introduction
- 3.2. Market Drivers
- 3.2.1. Government Initiatives Worldwide Supporting Education Infrastructure are Propelling Growth
- 3.3. Market Restrains
- 3.3.1. Stringent Regulatory Compliance Standards Related to Emissions and Safety Present Hurdles
- 3.4. Market Trends
- 3.4.1. Growing Sales of Electric School Buses to Witness Growth in Coming Years
- 4. Market Factor Analysis
- 4.1. Porters Five Forces
- 4.2. Supply/Value Chain
- 4.3. PESTEL analysis
- 4.4. Market Entropy
- 4.5. Patent/Trademark Analysis
- 5. Global School Bus Market Analysis, Insights and Forecast, 2019-2031
- 5.1. Market Analysis, Insights and Forecast - by Propulsion Type
- 5.1.1. Internal Combustion Engine (ICE)
- 5.1.2. Compress
- 5.1.3. Electric and Hybrid
- 5.2. Market Analysis, Insights and Forecast - by Capacity Design Type
- 5.2.1. Type A
- 5.2.2. Type B
- 5.2.3. Type C
- 5.2.4. Type D
- 5.3. Market Analysis, Insights and Forecast - by Region
- 5.3.1. North America
- 5.3.2. Europe
- 5.3.3. Asia Pacific
- 5.3.4. Rest of the World
- 5.1. Market Analysis, Insights and Forecast - by Propulsion Type
- 6. North America School Bus Market Analysis, Insights and Forecast, 2019-2031
- 6.1. Market Analysis, Insights and Forecast - by Propulsion Type
- 6.1.1. Internal Combustion Engine (ICE)
- 6.1.2. Compress
- 6.1.3. Electric and Hybrid
- 6.2. Market Analysis, Insights and Forecast - by Capacity Design Type
- 6.2.1. Type A
- 6.2.2. Type B
- 6.2.3. Type C
- 6.2.4. Type D
- 6.1. Market Analysis, Insights and Forecast - by Propulsion Type
- 7. Europe School Bus Market Analysis, Insights and Forecast, 2019-2031
- 7.1. Market Analysis, Insights and Forecast - by Propulsion Type
- 7.1.1. Internal Combustion Engine (ICE)
- 7.1.2. Compress
- 7.1.3. Electric and Hybrid
- 7.2. Market Analysis, Insights and Forecast - by Capacity Design Type
- 7.2.1. Type A
- 7.2.2. Type B
- 7.2.3. Type C
- 7.2.4. Type D
- 7.1. Market Analysis, Insights and Forecast - by Propulsion Type
- 8. Asia Pacific School Bus Market Analysis, Insights and Forecast, 2019-2031
- 8.1. Market Analysis, Insights and Forecast - by Propulsion Type
- 8.1.1. Internal Combustion Engine (ICE)
- 8.1.2. Compress
- 8.1.3. Electric and Hybrid
- 8.2. Market Analysis, Insights and Forecast - by Capacity Design Type
- 8.2.1. Type A
- 8.2.2. Type B
- 8.2.3. Type C
- 8.2.4. Type D
- 8.1. Market Analysis, Insights and Forecast - by Propulsion Type
- 9. Rest of the World School Bus Market Analysis, Insights and Forecast, 2019-2031
- 9.1. Market Analysis, Insights and Forecast - by Propulsion Type
- 9.1.1. Internal Combustion Engine (ICE)
- 9.1.2. Compress
- 9.1.3. Electric and Hybrid
- 9.2. Market Analysis, Insights and Forecast - by Capacity Design Type
- 9.2.1. Type A
- 9.2.2. Type B
- 9.2.3. Type C
- 9.2.4. Type D
- 9.1. Market Analysis, Insights and Forecast - by Propulsion Type
- 10. North America School Bus Market Analysis, Insights and Forecast, 2019-2031
- 10.1. Market Analysis, Insights and Forecast - By Country/Sub-region
- 10.1.1 United States
- 10.1.2 Canada
- 10.1.3 Mexico
- 10.1.4 Rest of North America
- 11. Europe School Bus Market Analysis, Insights and Forecast, 2019-2031
- 11.1. Market Analysis, Insights and Forecast - By Country/Sub-region
- 11.1.1 Germany
- 11.1.2 United Kingdom
- 11.1.3 France
- 11.1.4 Russia
- 11.1.5 Spain
- 11.1.6 Rest of Europe
- 12. Asia Pacific School Bus Market Analysis, Insights and Forecast, 2019-2031
- 12.1. Market Analysis, Insights and Forecast - By Country/Sub-region
- 12.1.1 China
- 12.1.2 India
- 12.1.3 Japan
- 12.1.4 South Korea
- 12.1.5 Rest of Asia Pacific
- 13. Rest of the World School Bus Market Analysis, Insights and Forecast, 2019-2031
- 13.1. Market Analysis, Insights and Forecast - By Country/Sub-region
- 13.1.1 South America
- 13.1.2 Middle East and Africa
- 14. Competitive Analysis
- 14.1. Global Market Share Analysis 2024
- 14.2. Company Profiles
- 14.2.1 Blue Bird Corporation
- 14.2.1.1. Overview
- 14.2.1.2. Products
- 14.2.1.3. SWOT Analysis
- 14.2.1.4. Recent Developments
- 14.2.1.5. Financials (Based on Availability)
- 14.2.2 IC Bus (Navistar International Corporation)
- 14.2.2.1. Overview
- 14.2.2.2. Products
- 14.2.2.3. SWOT Analysis
- 14.2.2.4. Recent Developments
- 14.2.2.5. Financials (Based on Availability)
- 14.2.3 Yutong Buses Co Ltd
- 14.2.3.1. Overview
- 14.2.3.2. Products
- 14.2.3.3. SWOT Analysis
- 14.2.3.4. Recent Developments
- 14.2.3.5. Financials (Based on Availability)
- 14.2.4 JCBL Limited
- 14.2.4.1. Overview
- 14.2.4.2. Products
- 14.2.4.3. SWOT Analysis
- 14.2.4.4. Recent Developments
- 14.2.4.5. Financials (Based on Availability)
- 14.2.5 Anhui Ankai Automobile
- 14.2.5.1. Overview
- 14.2.5.2. Products
- 14.2.5.3. SWOT Analysis
- 14.2.5.4. Recent Developments
- 14.2.5.5. Financials (Based on Availability)
- 14.2.6 Thomas Built Buses Inc
- 14.2.6.1. Overview
- 14.2.6.2. Products
- 14.2.6.3. SWOT Analysis
- 14.2.6.4. Recent Developments
- 14.2.6.5. Financials (Based on Availability)
- 14.2.7 Lion Electric Company
- 14.2.7.1. Overview
- 14.2.7.2. Products
- 14.2.7.3. SWOT Analysis
- 14.2.7.4. Recent Developments
- 14.2.7.5. Financials (Based on Availability)
- 14.2.8 Collins Bus Corporation
- 14.2.8.1. Overview
- 14.2.8.2. Products
- 14.2.8.3. SWOT Analysis
- 14.2.8.4. Recent Developments
- 14.2.8.5. Financials (Based on Availability)
- 14.2.9 Tata Motor
- 14.2.9.1. Overview
- 14.2.9.2. Products
- 14.2.9.3. SWOT Analysis
- 14.2.9.4. Recent Developments
- 14.2.9.5. Financials (Based on Availability)
- 14.2.1 Blue Bird Corporation
List of Figures
- Figure 1: Global School Bus Market Revenue Breakdown (Million, %) by Region 2024 & 2032
- Figure 2: North America School Bus Market Revenue (Million), by Country 2024 & 2032
- Figure 3: North America School Bus Market Revenue Share (%), by Country 2024 & 2032
- Figure 4: Europe School Bus Market Revenue (Million), by Country 2024 & 2032
- Figure 5: Europe School Bus Market Revenue Share (%), by Country 2024 & 2032
- Figure 6: Asia Pacific School Bus Market Revenue (Million), by Country 2024 & 2032
- Figure 7: Asia Pacific School Bus Market Revenue Share (%), by Country 2024 & 2032
- Figure 8: Rest of the World School Bus Market Revenue (Million), by Country 2024 & 2032
- Figure 9: Rest of the World School Bus Market Revenue Share (%), by Country 2024 & 2032
- Figure 10: North America School Bus Market Revenue (Million), by Propulsion Type 2024 & 2032
- Figure 11: North America School Bus Market Revenue Share (%), by Propulsion Type 2024 & 2032
- Figure 12: North America School Bus Market Revenue (Million), by Capacity Design Type 2024 & 2032
- Figure 13: North America School Bus Market Revenue Share (%), by Capacity Design Type 2024 & 2032
- Figure 14: North America School Bus Market Revenue (Million), by Country 2024 & 2032
- Figure 15: North America School Bus Market Revenue Share (%), by Country 2024 & 2032
- Figure 16: Europe School Bus Market Revenue (Million), by Propulsion Type 2024 & 2032
- Figure 17: Europe School Bus Market Revenue Share (%), by Propulsion Type 2024 & 2032
- Figure 18: Europe School Bus Market Revenue (Million), by Capacity Design Type 2024 & 2032
- Figure 19: Europe School Bus Market Revenue Share (%), by Capacity Design Type 2024 & 2032
- Figure 20: Europe School Bus Market Revenue (Million), by Country 2024 & 2032
- Figure 21: Europe School Bus Market Revenue Share (%), by Country 2024 & 2032
- Figure 22: Asia Pacific School Bus Market Revenue (Million), by Propulsion Type 2024 & 2032
- Figure 23: Asia Pacific School Bus Market Revenue Share (%), by Propulsion Type 2024 & 2032
- Figure 24: Asia Pacific School Bus Market Revenue (Million), by Capacity Design Type 2024 & 2032
- Figure 25: Asia Pacific School Bus Market Revenue Share (%), by Capacity Design Type 2024 & 2032
- Figure 26: Asia Pacific School Bus Market Revenue (Million), by Country 2024 & 2032
- Figure 27: Asia Pacific School Bus Market Revenue Share (%), by Country 2024 & 2032
- Figure 28: Rest of the World School Bus Market Revenue (Million), by Propulsion Type 2024 & 2032
- Figure 29: Rest of the World School Bus Market Revenue Share (%), by Propulsion Type 2024 & 2032
- Figure 30: Rest of the World School Bus Market Revenue (Million), by Capacity Design Type 2024 & 2032
- Figure 31: Rest of the World School Bus Market Revenue Share (%), by Capacity Design Type 2024 & 2032
- Figure 32: Rest of the World School Bus Market Revenue (Million), by Country 2024 & 2032
- Figure 33: Rest of the World School Bus Market Revenue Share (%), by Country 2024 & 2032
List of Tables
- Table 1: Global School Bus Market Revenue Million Forecast, by Region 2019 & 2032
- Table 2: Global School Bus Market Revenue Million Forecast, by Propulsion Type 2019 & 2032
- Table 3: Global School Bus Market Revenue Million Forecast, by Capacity Design Type 2019 & 2032
- Table 4: Global School Bus Market Revenue Million Forecast, by Region 2019 & 2032
- Table 5: Global School Bus Market Revenue Million Forecast, by Country 2019 & 2032
- Table 6: United States School Bus Market Revenue (Million) Forecast, by Application 2019 & 2032
- Table 7: Canada School Bus Market Revenue (Million) Forecast, by Application 2019 & 2032
- Table 8: Mexico School Bus Market Revenue (Million) Forecast, by Application 2019 & 2032
- Table 9: Rest of North America School Bus Market Revenue (Million) Forecast, by Application 2019 & 2032
- Table 10: Global School Bus Market Revenue Million Forecast, by Country 2019 & 2032
- Table 11: Germany School Bus Market Revenue (Million) Forecast, by Application 2019 & 2032
- Table 12: United Kingdom School Bus Market Revenue (Million) Forecast, by Application 2019 & 2032
- Table 13: France School Bus Market Revenue (Million) Forecast, by Application 2019 & 2032
- Table 14: Russia School Bus Market Revenue (Million) Forecast, by Application 2019 & 2032
- Table 15: Spain School Bus Market Revenue (Million) Forecast, by Application 2019 & 2032
- Table 16: Rest of Europe School Bus Market Revenue (Million) Forecast, by Application 2019 & 2032
- Table 17: Global School Bus Market Revenue Million Forecast, by Country 2019 & 2032
- Table 18: China School Bus Market Revenue (Million) Forecast, by Application 2019 & 2032
- Table 19: India School Bus Market Revenue (Million) Forecast, by Application 2019 & 2032
- Table 20: Japan School Bus Market Revenue (Million) Forecast, by Application 2019 & 2032
- Table 21: South Korea School Bus Market Revenue (Million) Forecast, by Application 2019 & 2032
- Table 22: Rest of Asia Pacific School Bus Market Revenue (Million) Forecast, by Application 2019 & 2032
- Table 23: Global School Bus Market Revenue Million Forecast, by Country 2019 & 2032
- Table 24: South America School Bus Market Revenue (Million) Forecast, by Application 2019 & 2032
- Table 25: Middle East and Africa School Bus Market Revenue (Million) Forecast, by Application 2019 & 2032
- Table 26: Global School Bus Market Revenue Million Forecast, by Propulsion Type 2019 & 2032
- Table 27: Global School Bus Market Revenue Million Forecast, by Capacity Design Type 2019 & 2032
- Table 28: Global School Bus Market Revenue Million Forecast, by Country 2019 & 2032
- Table 29: United States School Bus Market Revenue (Million) Forecast, by Application 2019 & 2032
- Table 30: Canada School Bus Market Revenue (Million) Forecast, by Application 2019 & 2032
- Table 31: Mexico School Bus Market Revenue (Million) Forecast, by Application 2019 & 2032
- Table 32: Rest of North America School Bus Market Revenue (Million) Forecast, by Application 2019 & 2032
- Table 33: Global School Bus Market Revenue Million Forecast, by Propulsion Type 2019 & 2032
- Table 34: Global School Bus Market Revenue Million Forecast, by Capacity Design Type 2019 & 2032
- Table 35: Global School Bus Market Revenue Million Forecast, by Country 2019 & 2032
- Table 36: Germany School Bus Market Revenue (Million) Forecast, by Application 2019 & 2032
- Table 37: United Kingdom School Bus Market Revenue (Million) Forecast, by Application 2019 & 2032
- Table 38: France School Bus Market Revenue (Million) Forecast, by Application 2019 & 2032
- Table 39: Russia School Bus Market Revenue (Million) Forecast, by Application 2019 & 2032
- Table 40: Spain School Bus Market Revenue (Million) Forecast, by Application 2019 & 2032
- Table 41: Rest of Europe School Bus Market Revenue (Million) Forecast, by Application 2019 & 2032
- Table 42: Global School Bus Market Revenue Million Forecast, by Propulsion Type 2019 & 2032
- Table 43: Global School Bus Market Revenue Million Forecast, by Capacity Design Type 2019 & 2032
- Table 44: Global School Bus Market Revenue Million Forecast, by Country 2019 & 2032
- Table 45: China School Bus Market Revenue (Million) Forecast, by Application 2019 & 2032
- Table 46: India School Bus Market Revenue (Million) Forecast, by Application 2019 & 2032
- Table 47: Japan School Bus Market Revenue (Million) Forecast, by Application 2019 & 2032
- Table 48: South Korea School Bus Market Revenue (Million) Forecast, by Application 2019 & 2032
- Table 49: Rest of Asia Pacific School Bus Market Revenue (Million) Forecast, by Application 2019 & 2032
- Table 50: Global School Bus Market Revenue Million Forecast, by Propulsion Type 2019 & 2032
- Table 51: Global School Bus Market Revenue Million Forecast, by Capacity Design Type 2019 & 2032
- Table 52: Global School Bus Market Revenue Million Forecast, by Country 2019 & 2032
- Table 53: South America School Bus Market Revenue (Million) Forecast, by Application 2019 & 2032
- Table 54: Middle East and Africa School Bus Market Revenue (Million) Forecast, by Application 2019 & 2032
Frequently Asked Questions
1. What is the projected Compound Annual Growth Rate (CAGR) of the School Bus Market?
The projected CAGR is approximately 5.69%.
2. Which companies are prominent players in the School Bus Market?
Key companies in the market include Blue Bird Corporation, IC Bus (Navistar International Corporation), Yutong Buses Co Ltd, JCBL Limited, Anhui Ankai Automobile, Thomas Built Buses Inc, Lion Electric Company, Collins Bus Corporation, Tata Motor.
3. What are the main segments of the School Bus Market?
The market segments include Propulsion Type, Capacity Design Type.
4. Can you provide details about the market size?
The market size is estimated to be USD 48.03 Million as of 2022.
5. What are some drivers contributing to market growth?
Government Initiatives Worldwide Supporting Education Infrastructure are Propelling Growth.
6. What are the notable trends driving market growth?
Growing Sales of Electric School Buses to Witness Growth in Coming Years.
7. Are there any restraints impacting market growth?
Stringent Regulatory Compliance Standards Related to Emissions and Safety Present Hurdles.
8. Can you provide examples of recent developments in the market?
Dec 2023: GreenPower Motor Company announced its first orders for the Type A all-electric, purpose-built, zero-emission Nano BEAST school bus for the New York market through its dealer Leonard Bus Sales.
9. What pricing options are available for accessing the report?
Pricing options include single-user, multi-user, and enterprise licenses priced at USD 4750, USD 5250, and USD 8750 respectively.
10. Is the market size provided in terms of value or volume?
The market size is provided in terms of value, measured in Million.
11. Are there any specific market keywords associated with the report?
Yes, the market keyword associated with the report is "School Bus Market," which aids in identifying and referencing the specific market segment covered.
12. How do I determine which pricing option suits my needs best?
The pricing options vary based on user requirements and access needs. Individual users may opt for single-user licenses, while businesses requiring broader access may choose multi-user or enterprise licenses for cost-effective access to the report.
13. Are there any additional resources or data provided in the School Bus Market report?
While the report offers comprehensive insights, it's advisable to review the specific contents or supplementary materials provided to ascertain if additional resources or data are available.
14. How can I stay updated on further developments or reports in the School Bus Market?
To stay informed about further developments, trends, and reports in the School Bus Market, consider subscribing to industry newsletters, following relevant companies and organizations, or regularly checking reputable industry news sources and publications.
Methodology
Step 1 - Identification of Relevant Samples Size from Population Database


Step 2 - Approaches for Defining Global Market Size (Value, Volume* & Price*)

Note*: In applicable scenarios
Step 3 - Data Sources
Primary Research
- Web Analytics
- Survey Reports
- Research Institute
- Latest Research Reports
- Opinion Leaders
Secondary Research
- Annual Reports
- White Paper
- Latest Press Release
- Industry Association
- Paid Database
- Investor Presentations

Step 4 - Data Triangulation
Involves using different sources of information in order to increase the validity of a study
These sources are likely to be stakeholders in a program - participants, other researchers, program staff, other community members, and so on.
Then we put all data in single framework & apply various statistical tools to find out the dynamic on the market.
During the analysis stage, feedback from the stakeholder groups would be compared to determine areas of agreement as well as areas of divergence


