
Key Insights
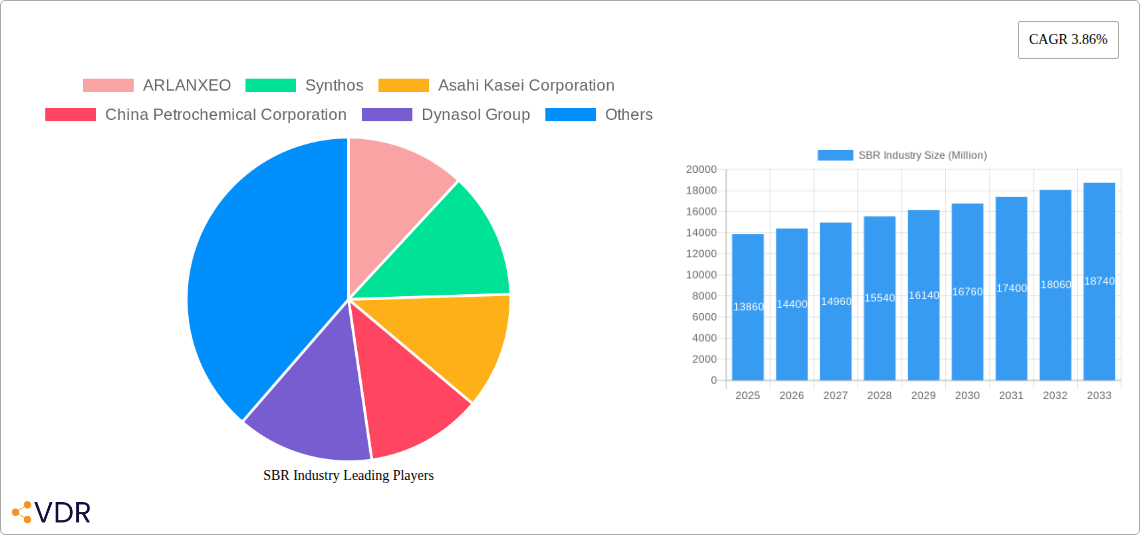
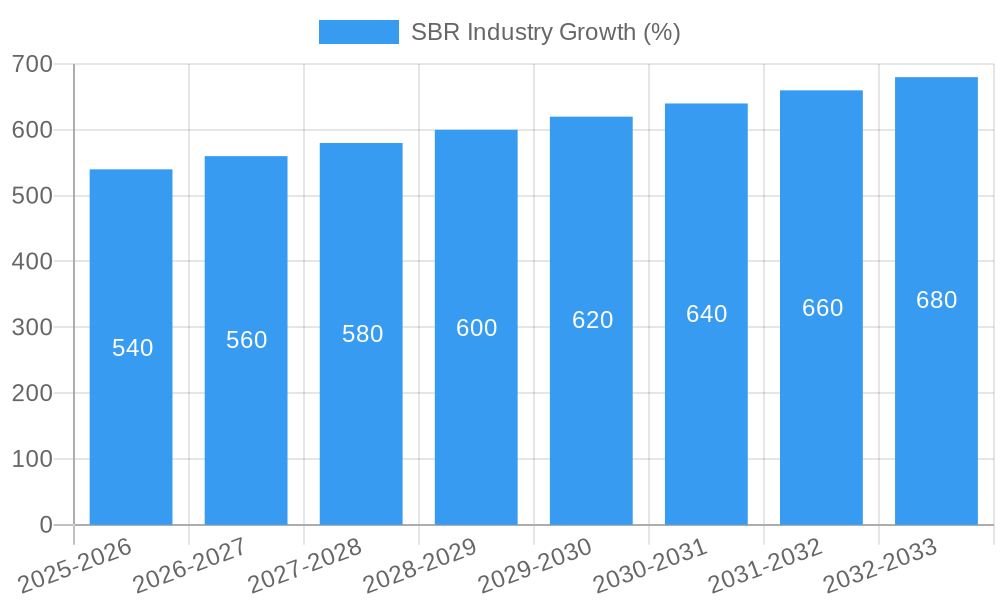
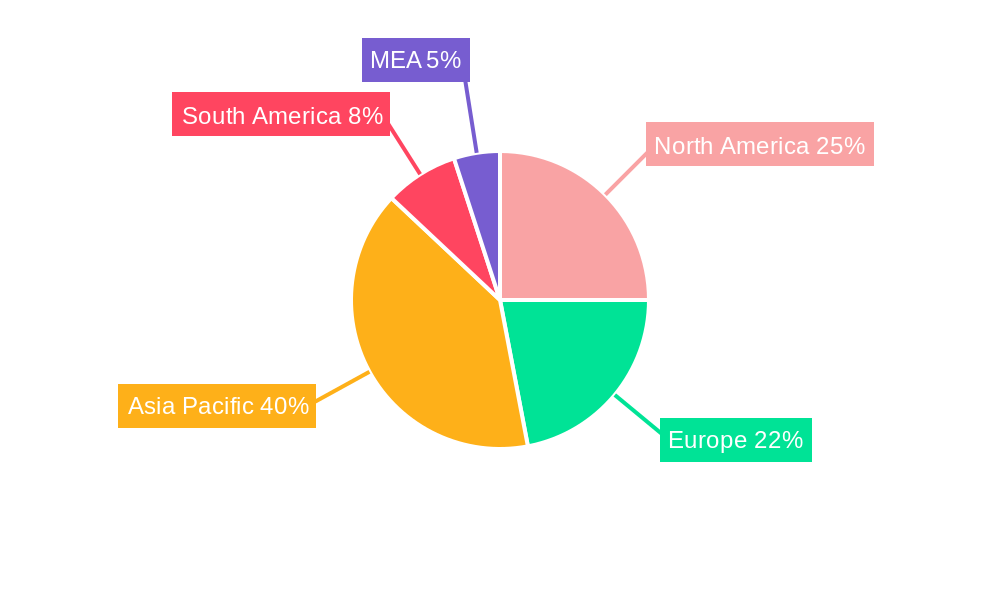
The global styrene-butadiene rubber (SBR) market, valued at $13.86 billion in 2025, is projected to experience steady growth, driven by the robust demand from key application sectors. The compound annual growth rate (CAGR) of 3.86% from 2025 to 2033 reflects a positive outlook, influenced by several factors. The automotive industry, particularly tire manufacturing, remains a significant driver, fueled by increasing vehicle production and replacement tire demand globally. Growth in the construction sector, particularly in emerging economies, further boosts demand for SBR in construction materials like adhesives and sealants. The increasing adoption of sustainable practices within the industry is also influencing market trends, leading to a greater focus on environmentally friendly SBR production methods and formulations. However, fluctuating raw material prices and potential economic downturns pose challenges, potentially moderating market growth. The market segmentation reveals a strong preference for emulsion SBR over solution SBR, reflecting its versatility and suitability for various applications. Geographical distribution shows strong market presence in Asia Pacific, driven by rapid industrialization and automotive manufacturing in countries like China and India. Europe and North America maintain significant market shares, albeit with more moderate growth compared to the Asia Pacific region. The competitive landscape is characterized by both large multinational corporations and regional players, with continuous innovation and strategic partnerships shaping market dynamics.
The market's future trajectory will depend on several interacting factors, including global economic conditions, technological advancements in SBR production and applications, and evolving environmental regulations. The increased focus on high-performance tires, demanding improved fuel efficiency and durability, is likely to drive innovation within the SBR sector. Furthermore, research and development efforts towards developing bio-based SBR alternatives may play a significant role in shaping the market's long-term growth and sustainability profile. This balance between economic factors, technological advancement, and environmental concerns will ultimately determine the market's performance over the forecast period. Competition among established players and the emergence of new entrants will also impact pricing and market share.
SBR Industry Market Report: 2019-2033
This comprehensive report provides an in-depth analysis of the Styrene-Butadiene Rubber (SBR) industry, covering market dynamics, growth trends, regional dominance, product landscape, and key players. The study period spans from 2019 to 2033, with a base year of 2025 and a forecast period from 2025 to 2033. The report is essential for industry professionals, investors, and strategists seeking to understand and capitalize on the opportunities within this dynamic market. The report leverages extensive primary and secondary research to provide accurate and insightful data, focusing on both the parent market (synthetic rubber) and the child market (SBR).
SBR Industry Market Dynamics & Structure
The global SBR market is characterized by moderate concentration, with several major players holding significant market shares. Technological innovation, particularly in sustainable SBR production, is a key driver, alongside evolving regulatory frameworks focusing on environmental concerns. Competition from other synthetic rubbers and natural rubber remains a factor, influencing pricing and market share. The end-user demographics are diverse, with the tire industry being the dominant segment. M&A activity has been relatively moderate, reflecting consolidation efforts among key players.
- Market Concentration: Moderately concentrated, with the top 5 players holding approximately xx% of the global market share (2024).
- Technological Innovation: Focus on sustainable and high-performance SBR grades.
- Regulatory Landscape: Increasing emphasis on environmental regulations and sustainable production practices.
- Competitive Substitutes: Natural rubber and other synthetic rubbers like EPDM and Nitrile rubber.
- M&A Activity: xx deals recorded in the historical period (2019-2024), primarily focused on consolidation and expansion into new markets. Value of M&A deals approximately xx Million USD.
SBR Industry Growth Trends & Insights
The global SBR market exhibited a CAGR of xx% during the historical period (2019-2024), driven primarily by growth in the tire and construction sectors. Adoption rates remain high in established markets, while emerging economies show significant growth potential. Technological disruptions, including advancements in SBR production processes and the development of sustainable materials, are further stimulating market growth. Shifts in consumer behavior, particularly toward fuel-efficient vehicles and eco-friendly products, are influencing demand patterns. The market size reached approximately xx Million USD in 2024 and is projected to reach xx Million USD by 2033.
Dominant Regions, Countries, or Segments in SBR Industry
The Asia-Pacific region dominates the global SBR market, driven by strong growth in the automotive and construction industries within major economies like China and India. The tire segment remains the largest application area, followed by adhesives and footwear. Emulsion SBR holds a larger market share compared to solution SBR due to its cost-effectiveness and versatility.
- Dominant Region: Asia-Pacific (xx% market share in 2024)
- Key Drivers: Strong economic growth, expanding automotive sector, rising construction activities, and increasing tire production.
- Leading Country: China (xx% of APAC market share in 2024)
- Largest Application Segment: Tires (xx% market share in 2024)
- Largest Type Segment: Emulsion SBR (xx% market share in 2024)
SBR Industry Product Landscape
The SBR product landscape is characterized by a wide range of grades, each tailored for specific applications. Innovation focuses on improving performance characteristics such as tensile strength, abrasion resistance, and processability. Furthermore, there is a growing emphasis on developing sustainable and environmentally friendly SBR grades. Key features include improved processing, enhanced durability, and reduced environmental impact.
Key Drivers, Barriers & Challenges in SBR Industry
Key Drivers:
- Growing demand from the automotive industry (particularly tire manufacturing).
- Increasing construction activities globally.
- Technological advancements in SBR production.
Key Challenges:
- Fluctuations in raw material prices (styrene and butadiene).
- Intense competition among existing players.
- Stringent environmental regulations.
- Supply chain disruptions and geopolitical factors influencing raw material availability. This resulted in a xx% increase in SBR prices between 2021-2022
Emerging Opportunities in SBR Industry
- Growing demand for sustainable and eco-friendly SBR.
- Expansion into emerging markets in Africa and South America.
- Development of specialized SBR grades for niche applications (e.g., medical devices).
Growth Accelerators in the SBR Industry Industry
Technological advancements in polymerization processes, coupled with strategic partnerships and collaborations across the value chain, are significant growth catalysts. Expansion into new applications and markets, particularly in developing regions, will also fuel market growth. A focus on sustainable production and eco-friendly SBR grades further enhances market potential.
Key Players Shaping the SBR Industry Market
- ARLANXEO
- Synthos
- Asahi Kasei Corporation
- China Petrochemical Corporation
- Dynasol Group
- Versalis SpA
- KUMHO PETROCHEMICAL
- ENEOS Corporation
- LANXESS
- Kemipex
- Trinseo
- LG Chem
- Sumitomo Chemical Asia Pte Ltd
Notable Milestones in SBR Industry Sector
- December 2023: Synthos signed a Memorandum of Understanding (MOU) with Kumho Tire to develop sustainable tire raw materials.
- April 2023: Hainan Baling Chemical New Material Co. Ltd. (subsidiary of China Petroleum & Chemical Corporation) commenced SBR production in Hainan, China, with an annual capacity of 170,000 tons, involving a USD 279.74 million investment.
In-Depth SBR Industry Market Outlook
The SBR market is poised for continued growth, driven by sustained demand from key applications and technological innovations focused on sustainability and performance enhancement. Strategic partnerships, expansion into emerging markets, and a focus on specialized SBR grades will be crucial for long-term success in this competitive landscape. The market is expected to maintain a healthy CAGR throughout the forecast period, presenting significant opportunities for existing and new market entrants.
SBR Industry Segmentation
-
1. Type
- 1.1. Emulsion SBR
- 1.2. Solution SBR
-
2. Application
- 2.1. Tyres
- 2.2. Adhesives
- 2.3. Footwear
- 2.4. Other Applications (Construction Materials)
SBR Industry Segmentation By Geography
-
1. Asia Pacific
- 1.1. China
- 1.2. India
- 1.3. Japan
- 1.4. South Korea
- 1.5. Thailand
- 1.6. Malaysia
- 1.7. Vietnam
- 1.8. Indonesia
- 1.9. Rest of Asia Pacific
-
2. North America
- 2.1. United States
- 2.2. Canada
- 2.3. Mexico
-
3. Europe
- 3.1. United Kingdom
- 3.2. France
- 3.3. Germany
- 3.4. Italy
- 3.5. Spain
- 3.6. Turkey
- 3.7. Russia
- 3.8. NORDIC
- 3.9. Rest of Europe
-
4. South America
- 4.1. Brazil
- 4.2. Argentina
- 4.3. Colombia
- 4.4. Rest of South America
- 5. Middle East
-
6. South Africa
- 6.1. Saudi Arabia
- 6.2. Nigeria
- 6.3. Egypt
- 6.4. Qatar
- 6.5. United Arab Emirates
- 6.6. Rest of Middle East
SBR Industry REPORT HIGHLIGHTS
| Aspects | Details |
|---|---|
| Study Period | 2019-2033 |
| Base Year | 2024 |
| Estimated Year | 2025 |
| Forecast Period | 2025-2033 |
| Historical Period | 2019-2024 |
| Growth Rate | CAGR of 3.86% from 2019-2033 |
| Segmentation |
|
Table of Contents
- 1. Introduction
- 1.1. Research Scope
- 1.2. Market Segmentation
- 1.3. Research Methodology
- 1.4. Definitions and Assumptions
- 2. Executive Summary
- 2.1. Introduction
- 3. Market Dynamics
- 3.1. Introduction
- 3.2. Market Drivers
- 3.2.1. Increasing Usage of Natural Rubber and SBR Crossover Products; Increasing Demand from Adhesives and Sealants Industry
- 3.3. Market Restrains
- 3.3.1. Volatile Raw Material Prices; Substitution by Sustainable Materials
- 3.4. Market Trends
- 3.4.1. Adhesives Segment to Dominate the Market
- 4. Market Factor Analysis
- 4.1. Porters Five Forces
- 4.2. Supply/Value Chain
- 4.3. PESTEL analysis
- 4.4. Market Entropy
- 4.5. Patent/Trademark Analysis
- 5. Global SBR Industry Analysis, Insights and Forecast, 2019-2031
- 5.1. Market Analysis, Insights and Forecast - by Type
- 5.1.1. Emulsion SBR
- 5.1.2. Solution SBR
- 5.2. Market Analysis, Insights and Forecast - by Application
- 5.2.1. Tyres
- 5.2.2. Adhesives
- 5.2.3. Footwear
- 5.2.4. Other Applications (Construction Materials)
- 5.3. Market Analysis, Insights and Forecast - by Region
- 5.3.1. Asia Pacific
- 5.3.2. North America
- 5.3.3. Europe
- 5.3.4. South America
- 5.3.5. Middle East
- 5.3.6. South Africa
- 5.1. Market Analysis, Insights and Forecast - by Type
- 6. Asia Pacific SBR Industry Analysis, Insights and Forecast, 2019-2031
- 6.1. Market Analysis, Insights and Forecast - by Type
- 6.1.1. Emulsion SBR
- 6.1.2. Solution SBR
- 6.2. Market Analysis, Insights and Forecast - by Application
- 6.2.1. Tyres
- 6.2.2. Adhesives
- 6.2.3. Footwear
- 6.2.4. Other Applications (Construction Materials)
- 6.1. Market Analysis, Insights and Forecast - by Type
- 7. North America SBR Industry Analysis, Insights and Forecast, 2019-2031
- 7.1. Market Analysis, Insights and Forecast - by Type
- 7.1.1. Emulsion SBR
- 7.1.2. Solution SBR
- 7.2. Market Analysis, Insights and Forecast - by Application
- 7.2.1. Tyres
- 7.2.2. Adhesives
- 7.2.3. Footwear
- 7.2.4. Other Applications (Construction Materials)
- 7.1. Market Analysis, Insights and Forecast - by Type
- 8. Europe SBR Industry Analysis, Insights and Forecast, 2019-2031
- 8.1. Market Analysis, Insights and Forecast - by Type
- 8.1.1. Emulsion SBR
- 8.1.2. Solution SBR
- 8.2. Market Analysis, Insights and Forecast - by Application
- 8.2.1. Tyres
- 8.2.2. Adhesives
- 8.2.3. Footwear
- 8.2.4. Other Applications (Construction Materials)
- 8.1. Market Analysis, Insights and Forecast - by Type
- 9. South America SBR Industry Analysis, Insights and Forecast, 2019-2031
- 9.1. Market Analysis, Insights and Forecast - by Type
- 9.1.1. Emulsion SBR
- 9.1.2. Solution SBR
- 9.2. Market Analysis, Insights and Forecast - by Application
- 9.2.1. Tyres
- 9.2.2. Adhesives
- 9.2.3. Footwear
- 9.2.4. Other Applications (Construction Materials)
- 9.1. Market Analysis, Insights and Forecast - by Type
- 10. Middle East SBR Industry Analysis, Insights and Forecast, 2019-2031
- 10.1. Market Analysis, Insights and Forecast - by Type
- 10.1.1. Emulsion SBR
- 10.1.2. Solution SBR
- 10.2. Market Analysis, Insights and Forecast - by Application
- 10.2.1. Tyres
- 10.2.2. Adhesives
- 10.2.3. Footwear
- 10.2.4. Other Applications (Construction Materials)
- 10.1. Market Analysis, Insights and Forecast - by Type
- 11. South Africa SBR Industry Analysis, Insights and Forecast, 2019-2031
- 11.1. Market Analysis, Insights and Forecast - by Type
- 11.1.1. Emulsion SBR
- 11.1.2. Solution SBR
- 11.2. Market Analysis, Insights and Forecast - by Application
- 11.2.1. Tyres
- 11.2.2. Adhesives
- 11.2.3. Footwear
- 11.2.4. Other Applications (Construction Materials)
- 11.1. Market Analysis, Insights and Forecast - by Type
- 12. Europe SBR Industry Analysis, Insights and Forecast, 2019-2031
- 12.1. Market Analysis, Insights and Forecast - By Country/Sub-region
- 12.1.1 Germany
- 12.1.2 United Kingdom
- 12.1.3 France
- 12.1.4 Spain
- 12.1.5 Italy
- 12.1.6 Spain
- 12.1.7 Belgium
- 12.1.8 Netherland
- 12.1.9 Nordics
- 12.1.10 Rest of Europe
- 13. Asia Pacific SBR Industry Analysis, Insights and Forecast, 2019-2031
- 13.1. Market Analysis, Insights and Forecast - By Country/Sub-region
- 13.1.1 China
- 13.1.2 Japan
- 13.1.3 India
- 13.1.4 South Korea
- 13.1.5 Southeast Asia
- 13.1.6 Australia
- 13.1.7 Indonesia
- 13.1.8 Phillipes
- 13.1.9 Singapore
- 13.1.10 Thailandc
- 13.1.11 Rest of Asia Pacific
- 14. South America SBR Industry Analysis, Insights and Forecast, 2019-2031
- 14.1. Market Analysis, Insights and Forecast - By Country/Sub-region
- 14.1.1 Brazil
- 14.1.2 Argentina
- 14.1.3 Peru
- 14.1.4 Chile
- 14.1.5 Colombia
- 14.1.6 Ecuador
- 14.1.7 Venezuela
- 14.1.8 Rest of South America
- 15. North America SBR Industry Analysis, Insights and Forecast, 2019-2031
- 15.1. Market Analysis, Insights and Forecast - By Country/Sub-region
- 15.1.1 United States
- 15.1.2 Canada
- 15.1.3 Mexico
- 16. MEA SBR Industry Analysis, Insights and Forecast, 2019-2031
- 16.1. Market Analysis, Insights and Forecast - By Country/Sub-region
- 16.1.1 United Arab Emirates
- 16.1.2 Saudi Arabia
- 16.1.3 South Africa
- 16.1.4 Rest of Middle East and Africa
- 17. Competitive Analysis
- 17.1. Global Market Share Analysis 2024
- 17.2. Company Profiles
- 17.2.1 ARLANXEO
- 17.2.1.1. Overview
- 17.2.1.2. Products
- 17.2.1.3. SWOT Analysis
- 17.2.1.4. Recent Developments
- 17.2.1.5. Financials (Based on Availability)
- 17.2.2 Synthos
- 17.2.2.1. Overview
- 17.2.2.2. Products
- 17.2.2.3. SWOT Analysis
- 17.2.2.4. Recent Developments
- 17.2.2.5. Financials (Based on Availability)
- 17.2.3 Asahi Kasei Corporation
- 17.2.3.1. Overview
- 17.2.3.2. Products
- 17.2.3.3. SWOT Analysis
- 17.2.3.4. Recent Developments
- 17.2.3.5. Financials (Based on Availability)
- 17.2.4 China Petrochemical Corporation
- 17.2.4.1. Overview
- 17.2.4.2. Products
- 17.2.4.3. SWOT Analysis
- 17.2.4.4. Recent Developments
- 17.2.4.5. Financials (Based on Availability)
- 17.2.5 Dynasol Group
- 17.2.5.1. Overview
- 17.2.5.2. Products
- 17.2.5.3. SWOT Analysis
- 17.2.5.4. Recent Developments
- 17.2.5.5. Financials (Based on Availability)
- 17.2.6 Versalis SpA*List Not Exhaustive
- 17.2.6.1. Overview
- 17.2.6.2. Products
- 17.2.6.3. SWOT Analysis
- 17.2.6.4. Recent Developments
- 17.2.6.5. Financials (Based on Availability)
- 17.2.7 KUMHO PETROCHEMICAL
- 17.2.7.1. Overview
- 17.2.7.2. Products
- 17.2.7.3. SWOT Analysis
- 17.2.7.4. Recent Developments
- 17.2.7.5. Financials (Based on Availability)
- 17.2.8 ENEOS Corporation
- 17.2.8.1. Overview
- 17.2.8.2. Products
- 17.2.8.3. SWOT Analysis
- 17.2.8.4. Recent Developments
- 17.2.8.5. Financials (Based on Availability)
- 17.2.9 LANXESS
- 17.2.9.1. Overview
- 17.2.9.2. Products
- 17.2.9.3. SWOT Analysis
- 17.2.9.4. Recent Developments
- 17.2.9.5. Financials (Based on Availability)
- 17.2.10 Kemipex
- 17.2.10.1. Overview
- 17.2.10.2. Products
- 17.2.10.3. SWOT Analysis
- 17.2.10.4. Recent Developments
- 17.2.10.5. Financials (Based on Availability)
- 17.2.11 Trinseo
- 17.2.11.1. Overview
- 17.2.11.2. Products
- 17.2.11.3. SWOT Analysis
- 17.2.11.4. Recent Developments
- 17.2.11.5. Financials (Based on Availability)
- 17.2.12 LG Chem
- 17.2.12.1. Overview
- 17.2.12.2. Products
- 17.2.12.3. SWOT Analysis
- 17.2.12.4. Recent Developments
- 17.2.12.5. Financials (Based on Availability)
- 17.2.13 Sumitomo Chemical Asia Pte Ltd
- 17.2.13.1. Overview
- 17.2.13.2. Products
- 17.2.13.3. SWOT Analysis
- 17.2.13.4. Recent Developments
- 17.2.13.5. Financials (Based on Availability)
- 17.2.1 ARLANXEO
List of Figures
- Figure 1: Global SBR Industry Revenue Breakdown (Million, %) by Region 2024 & 2032
- Figure 2: Europe SBR Industry Revenue (Million), by Country 2024 & 2032
- Figure 3: Europe SBR Industry Revenue Share (%), by Country 2024 & 2032
- Figure 4: Asia Pacific SBR Industry Revenue (Million), by Country 2024 & 2032
- Figure 5: Asia Pacific SBR Industry Revenue Share (%), by Country 2024 & 2032
- Figure 6: South America SBR Industry Revenue (Million), by Country 2024 & 2032
- Figure 7: South America SBR Industry Revenue Share (%), by Country 2024 & 2032
- Figure 8: North America SBR Industry Revenue (Million), by Country 2024 & 2032
- Figure 9: North America SBR Industry Revenue Share (%), by Country 2024 & 2032
- Figure 10: MEA SBR Industry Revenue (Million), by Country 2024 & 2032
- Figure 11: MEA SBR Industry Revenue Share (%), by Country 2024 & 2032
- Figure 12: Asia Pacific SBR Industry Revenue (Million), by Type 2024 & 2032
- Figure 13: Asia Pacific SBR Industry Revenue Share (%), by Type 2024 & 2032
- Figure 14: Asia Pacific SBR Industry Revenue (Million), by Application 2024 & 2032
- Figure 15: Asia Pacific SBR Industry Revenue Share (%), by Application 2024 & 2032
- Figure 16: Asia Pacific SBR Industry Revenue (Million), by Country 2024 & 2032
- Figure 17: Asia Pacific SBR Industry Revenue Share (%), by Country 2024 & 2032
- Figure 18: North America SBR Industry Revenue (Million), by Type 2024 & 2032
- Figure 19: North America SBR Industry Revenue Share (%), by Type 2024 & 2032
- Figure 20: North America SBR Industry Revenue (Million), by Application 2024 & 2032
- Figure 21: North America SBR Industry Revenue Share (%), by Application 2024 & 2032
- Figure 22: North America SBR Industry Revenue (Million), by Country 2024 & 2032
- Figure 23: North America SBR Industry Revenue Share (%), by Country 2024 & 2032
- Figure 24: Europe SBR Industry Revenue (Million), by Type 2024 & 2032
- Figure 25: Europe SBR Industry Revenue Share (%), by Type 2024 & 2032
- Figure 26: Europe SBR Industry Revenue (Million), by Application 2024 & 2032
- Figure 27: Europe SBR Industry Revenue Share (%), by Application 2024 & 2032
- Figure 28: Europe SBR Industry Revenue (Million), by Country 2024 & 2032
- Figure 29: Europe SBR Industry Revenue Share (%), by Country 2024 & 2032
- Figure 30: South America SBR Industry Revenue (Million), by Type 2024 & 2032
- Figure 31: South America SBR Industry Revenue Share (%), by Type 2024 & 2032
- Figure 32: South America SBR Industry Revenue (Million), by Application 2024 & 2032
- Figure 33: South America SBR Industry Revenue Share (%), by Application 2024 & 2032
- Figure 34: South America SBR Industry Revenue (Million), by Country 2024 & 2032
- Figure 35: South America SBR Industry Revenue Share (%), by Country 2024 & 2032
- Figure 36: Middle East SBR Industry Revenue (Million), by Type 2024 & 2032
- Figure 37: Middle East SBR Industry Revenue Share (%), by Type 2024 & 2032
- Figure 38: Middle East SBR Industry Revenue (Million), by Application 2024 & 2032
- Figure 39: Middle East SBR Industry Revenue Share (%), by Application 2024 & 2032
- Figure 40: Middle East SBR Industry Revenue (Million), by Country 2024 & 2032
- Figure 41: Middle East SBR Industry Revenue Share (%), by Country 2024 & 2032
- Figure 42: South Africa SBR Industry Revenue (Million), by Type 2024 & 2032
- Figure 43: South Africa SBR Industry Revenue Share (%), by Type 2024 & 2032
- Figure 44: South Africa SBR Industry Revenue (Million), by Application 2024 & 2032
- Figure 45: South Africa SBR Industry Revenue Share (%), by Application 2024 & 2032
- Figure 46: South Africa SBR Industry Revenue (Million), by Country 2024 & 2032
- Figure 47: South Africa SBR Industry Revenue Share (%), by Country 2024 & 2032
List of Tables
- Table 1: Global SBR Industry Revenue Million Forecast, by Region 2019 & 2032
- Table 2: Global SBR Industry Revenue Million Forecast, by Type 2019 & 2032
- Table 3: Global SBR Industry Revenue Million Forecast, by Application 2019 & 2032
- Table 4: Global SBR Industry Revenue Million Forecast, by Region 2019 & 2032
- Table 5: Global SBR Industry Revenue Million Forecast, by Country 2019 & 2032
- Table 6: Germany SBR Industry Revenue (Million) Forecast, by Application 2019 & 2032
- Table 7: United Kingdom SBR Industry Revenue (Million) Forecast, by Application 2019 & 2032
- Table 8: France SBR Industry Revenue (Million) Forecast, by Application 2019 & 2032
- Table 9: Spain SBR Industry Revenue (Million) Forecast, by Application 2019 & 2032
- Table 10: Italy SBR Industry Revenue (Million) Forecast, by Application 2019 & 2032
- Table 11: Spain SBR Industry Revenue (Million) Forecast, by Application 2019 & 2032
- Table 12: Belgium SBR Industry Revenue (Million) Forecast, by Application 2019 & 2032
- Table 13: Netherland SBR Industry Revenue (Million) Forecast, by Application 2019 & 2032
- Table 14: Nordics SBR Industry Revenue (Million) Forecast, by Application 2019 & 2032
- Table 15: Rest of Europe SBR Industry Revenue (Million) Forecast, by Application 2019 & 2032
- Table 16: Global SBR Industry Revenue Million Forecast, by Country 2019 & 2032
- Table 17: China SBR Industry Revenue (Million) Forecast, by Application 2019 & 2032
- Table 18: Japan SBR Industry Revenue (Million) Forecast, by Application 2019 & 2032
- Table 19: India SBR Industry Revenue (Million) Forecast, by Application 2019 & 2032
- Table 20: South Korea SBR Industry Revenue (Million) Forecast, by Application 2019 & 2032
- Table 21: Southeast Asia SBR Industry Revenue (Million) Forecast, by Application 2019 & 2032
- Table 22: Australia SBR Industry Revenue (Million) Forecast, by Application 2019 & 2032
- Table 23: Indonesia SBR Industry Revenue (Million) Forecast, by Application 2019 & 2032
- Table 24: Phillipes SBR Industry Revenue (Million) Forecast, by Application 2019 & 2032
- Table 25: Singapore SBR Industry Revenue (Million) Forecast, by Application 2019 & 2032
- Table 26: Thailandc SBR Industry Revenue (Million) Forecast, by Application 2019 & 2032
- Table 27: Rest of Asia Pacific SBR Industry Revenue (Million) Forecast, by Application 2019 & 2032
- Table 28: Global SBR Industry Revenue Million Forecast, by Country 2019 & 2032
- Table 29: Brazil SBR Industry Revenue (Million) Forecast, by Application 2019 & 2032
- Table 30: Argentina SBR Industry Revenue (Million) Forecast, by Application 2019 & 2032
- Table 31: Peru SBR Industry Revenue (Million) Forecast, by Application 2019 & 2032
- Table 32: Chile SBR Industry Revenue (Million) Forecast, by Application 2019 & 2032
- Table 33: Colombia SBR Industry Revenue (Million) Forecast, by Application 2019 & 2032
- Table 34: Ecuador SBR Industry Revenue (Million) Forecast, by Application 2019 & 2032
- Table 35: Venezuela SBR Industry Revenue (Million) Forecast, by Application 2019 & 2032
- Table 36: Rest of South America SBR Industry Revenue (Million) Forecast, by Application 2019 & 2032
- Table 37: Global SBR Industry Revenue Million Forecast, by Country 2019 & 2032
- Table 38: United States SBR Industry Revenue (Million) Forecast, by Application 2019 & 2032
- Table 39: Canada SBR Industry Revenue (Million) Forecast, by Application 2019 & 2032
- Table 40: Mexico SBR Industry Revenue (Million) Forecast, by Application 2019 & 2032
- Table 41: Global SBR Industry Revenue Million Forecast, by Country 2019 & 2032
- Table 42: United Arab Emirates SBR Industry Revenue (Million) Forecast, by Application 2019 & 2032
- Table 43: Saudi Arabia SBR Industry Revenue (Million) Forecast, by Application 2019 & 2032
- Table 44: South Africa SBR Industry Revenue (Million) Forecast, by Application 2019 & 2032
- Table 45: Rest of Middle East and Africa SBR Industry Revenue (Million) Forecast, by Application 2019 & 2032
- Table 46: Global SBR Industry Revenue Million Forecast, by Type 2019 & 2032
- Table 47: Global SBR Industry Revenue Million Forecast, by Application 2019 & 2032
- Table 48: Global SBR Industry Revenue Million Forecast, by Country 2019 & 2032
- Table 49: China SBR Industry Revenue (Million) Forecast, by Application 2019 & 2032
- Table 50: India SBR Industry Revenue (Million) Forecast, by Application 2019 & 2032
- Table 51: Japan SBR Industry Revenue (Million) Forecast, by Application 2019 & 2032
- Table 52: South Korea SBR Industry Revenue (Million) Forecast, by Application 2019 & 2032
- Table 53: Thailand SBR Industry Revenue (Million) Forecast, by Application 2019 & 2032
- Table 54: Malaysia SBR Industry Revenue (Million) Forecast, by Application 2019 & 2032
- Table 55: Vietnam SBR Industry Revenue (Million) Forecast, by Application 2019 & 2032
- Table 56: Indonesia SBR Industry Revenue (Million) Forecast, by Application 2019 & 2032
- Table 57: Rest of Asia Pacific SBR Industry Revenue (Million) Forecast, by Application 2019 & 2032
- Table 58: Global SBR Industry Revenue Million Forecast, by Type 2019 & 2032
- Table 59: Global SBR Industry Revenue Million Forecast, by Application 2019 & 2032
- Table 60: Global SBR Industry Revenue Million Forecast, by Country 2019 & 2032
- Table 61: United States SBR Industry Revenue (Million) Forecast, by Application 2019 & 2032
- Table 62: Canada SBR Industry Revenue (Million) Forecast, by Application 2019 & 2032
- Table 63: Mexico SBR Industry Revenue (Million) Forecast, by Application 2019 & 2032
- Table 64: Global SBR Industry Revenue Million Forecast, by Type 2019 & 2032
- Table 65: Global SBR Industry Revenue Million Forecast, by Application 2019 & 2032
- Table 66: Global SBR Industry Revenue Million Forecast, by Country 2019 & 2032
- Table 67: United Kingdom SBR Industry Revenue (Million) Forecast, by Application 2019 & 2032
- Table 68: France SBR Industry Revenue (Million) Forecast, by Application 2019 & 2032
- Table 69: Germany SBR Industry Revenue (Million) Forecast, by Application 2019 & 2032
- Table 70: Italy SBR Industry Revenue (Million) Forecast, by Application 2019 & 2032
- Table 71: Spain SBR Industry Revenue (Million) Forecast, by Application 2019 & 2032
- Table 72: Turkey SBR Industry Revenue (Million) Forecast, by Application 2019 & 2032
- Table 73: Russia SBR Industry Revenue (Million) Forecast, by Application 2019 & 2032
- Table 74: NORDIC SBR Industry Revenue (Million) Forecast, by Application 2019 & 2032
- Table 75: Rest of Europe SBR Industry Revenue (Million) Forecast, by Application 2019 & 2032
- Table 76: Global SBR Industry Revenue Million Forecast, by Type 2019 & 2032
- Table 77: Global SBR Industry Revenue Million Forecast, by Application 2019 & 2032
- Table 78: Global SBR Industry Revenue Million Forecast, by Country 2019 & 2032
- Table 79: Brazil SBR Industry Revenue (Million) Forecast, by Application 2019 & 2032
- Table 80: Argentina SBR Industry Revenue (Million) Forecast, by Application 2019 & 2032
- Table 81: Colombia SBR Industry Revenue (Million) Forecast, by Application 2019 & 2032
- Table 82: Rest of South America SBR Industry Revenue (Million) Forecast, by Application 2019 & 2032
- Table 83: Global SBR Industry Revenue Million Forecast, by Type 2019 & 2032
- Table 84: Global SBR Industry Revenue Million Forecast, by Application 2019 & 2032
- Table 85: Global SBR Industry Revenue Million Forecast, by Country 2019 & 2032
- Table 86: Global SBR Industry Revenue Million Forecast, by Type 2019 & 2032
- Table 87: Global SBR Industry Revenue Million Forecast, by Application 2019 & 2032
- Table 88: Global SBR Industry Revenue Million Forecast, by Country 2019 & 2032
- Table 89: Saudi Arabia SBR Industry Revenue (Million) Forecast, by Application 2019 & 2032
- Table 90: Nigeria SBR Industry Revenue (Million) Forecast, by Application 2019 & 2032
- Table 91: Egypt SBR Industry Revenue (Million) Forecast, by Application 2019 & 2032
- Table 92: Qatar SBR Industry Revenue (Million) Forecast, by Application 2019 & 2032
- Table 93: United Arab Emirates SBR Industry Revenue (Million) Forecast, by Application 2019 & 2032
- Table 94: Rest of Middle East SBR Industry Revenue (Million) Forecast, by Application 2019 & 2032
Frequently Asked Questions
1. What is the projected Compound Annual Growth Rate (CAGR) of the SBR Industry?
The projected CAGR is approximately 3.86%.
2. Which companies are prominent players in the SBR Industry?
Key companies in the market include ARLANXEO, Synthos, Asahi Kasei Corporation, China Petrochemical Corporation, Dynasol Group, Versalis SpA*List Not Exhaustive, KUMHO PETROCHEMICAL, ENEOS Corporation, LANXESS, Kemipex, Trinseo, LG Chem, Sumitomo Chemical Asia Pte Ltd.
3. What are the main segments of the SBR Industry?
The market segments include Type, Application.
4. Can you provide details about the market size?
The market size is estimated to be USD 13.86 Million as of 2022.
5. What are some drivers contributing to market growth?
Increasing Usage of Natural Rubber and SBR Crossover Products; Increasing Demand from Adhesives and Sealants Industry.
6. What are the notable trends driving market growth?
Adhesives Segment to Dominate the Market.
7. Are there any restraints impacting market growth?
Volatile Raw Material Prices; Substitution by Sustainable Materials.
8. Can you provide examples of recent developments in the market?
December 2023: Synthos signed a Memorandum of Understanding (MOU) with Kumho Tire - a leading South Korean tire manufacturer. This collaboration is intended to develop sustainable raw materials for tires.
9. What pricing options are available for accessing the report?
Pricing options include single-user, multi-user, and enterprise licenses priced at USD 4750, USD 5250, and USD 8750 respectively.
10. Is the market size provided in terms of value or volume?
The market size is provided in terms of value, measured in Million.
11. Are there any specific market keywords associated with the report?
Yes, the market keyword associated with the report is "SBR Industry," which aids in identifying and referencing the specific market segment covered.
12. How do I determine which pricing option suits my needs best?
The pricing options vary based on user requirements and access needs. Individual users may opt for single-user licenses, while businesses requiring broader access may choose multi-user or enterprise licenses for cost-effective access to the report.
13. Are there any additional resources or data provided in the SBR Industry report?
While the report offers comprehensive insights, it's advisable to review the specific contents or supplementary materials provided to ascertain if additional resources or data are available.
14. How can I stay updated on further developments or reports in the SBR Industry?
To stay informed about further developments, trends, and reports in the SBR Industry, consider subscribing to industry newsletters, following relevant companies and organizations, or regularly checking reputable industry news sources and publications.
Methodology
Step 1 - Identification of Relevant Samples Size from Population Database


Step 2 - Approaches for Defining Global Market Size (Value, Volume* & Price*)

Note*: In applicable scenarios
Step 3 - Data Sources
Primary Research
- Web Analytics
- Survey Reports
- Research Institute
- Latest Research Reports
- Opinion Leaders
Secondary Research
- Annual Reports
- White Paper
- Latest Press Release
- Industry Association
- Paid Database
- Investor Presentations

Step 4 - Data Triangulation
Involves using different sources of information in order to increase the validity of a study
These sources are likely to be stakeholders in a program - participants, other researchers, program staff, other community members, and so on.
Then we put all data in single framework & apply various statistical tools to find out the dynamic on the market.
During the analysis stage, feedback from the stakeholder groups would be compared to determine areas of agreement as well as areas of divergence


