
Key Insights
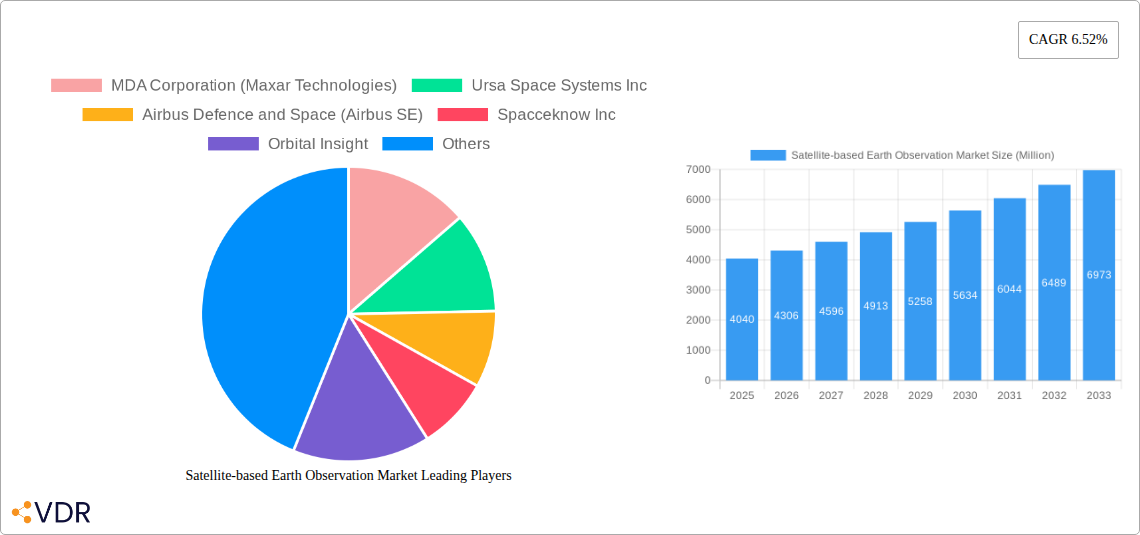
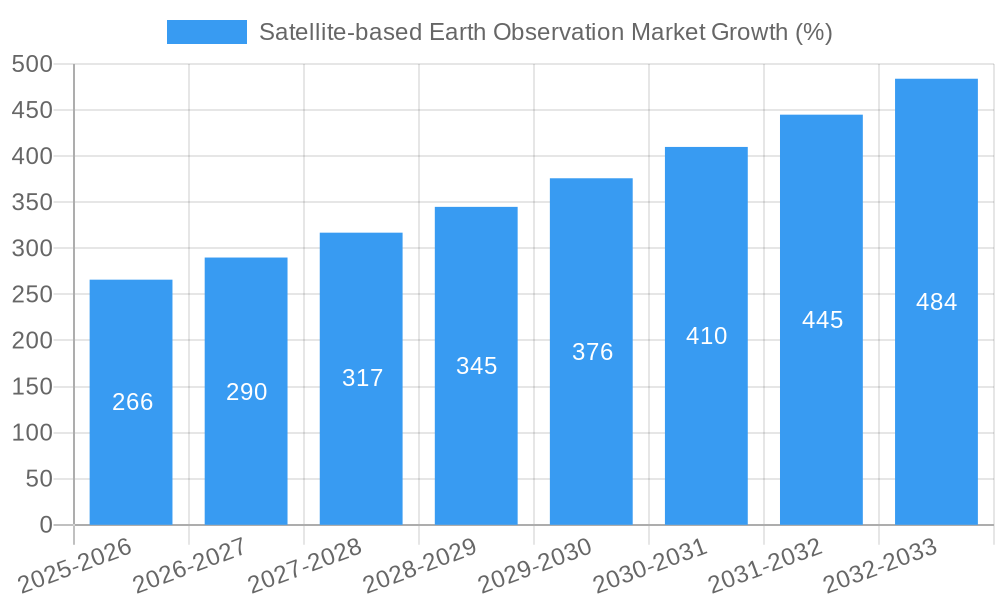
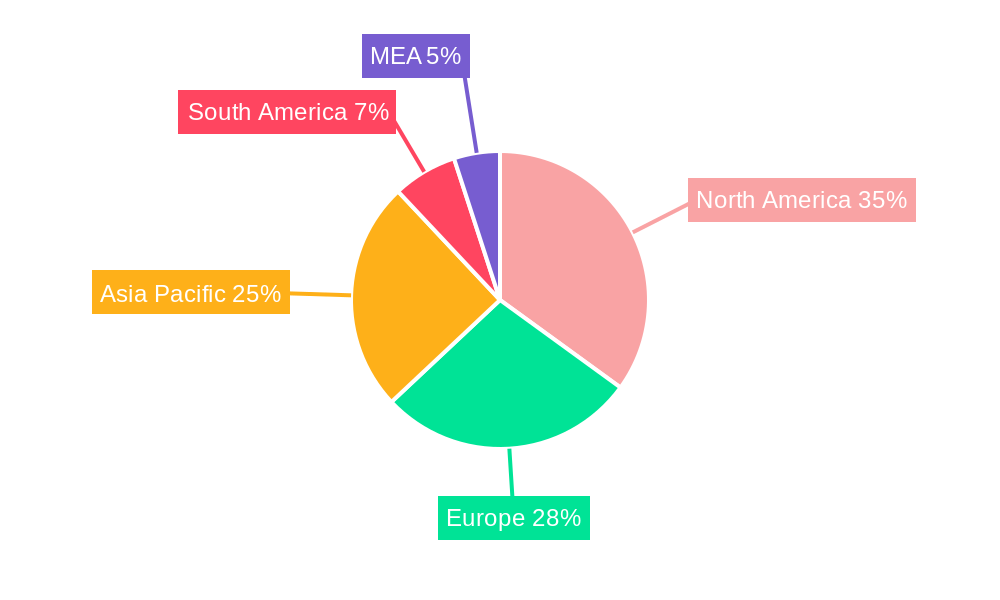
The global satellite-based Earth observation market is experiencing robust growth, projected to reach \$4.04 billion in 2025 and expand at a Compound Annual Growth Rate (CAGR) of 6.52% from 2025 to 2033. This expansion is driven by increasing demand across diverse sectors. Government initiatives promoting sustainable development and disaster management are key factors, alongside the rising adoption of advanced technologies like Synthetic Aperture Radar (SAR) and optical imagery for precise data acquisition. The agriculture sector benefits significantly from satellite-based monitoring for crop yield prediction and precision farming, while urban development leverages this technology for efficient infrastructure planning and public safety. Furthermore, the environmental sector utilizes these services for climate change monitoring, deforestation tracking, and resource management. The market is segmented by service (data and value-added services), technology (SAR and optical), and application (urban development, agriculture, climate monitoring, energy, infrastructure, disaster management, and others). North America currently holds a significant market share, driven by technological advancements and substantial government investments. However, the Asia-Pacific region exhibits substantial growth potential due to increasing infrastructure development and a rising focus on sustainable practices.
Competition within the market is fierce, with major players including MDA Corporation (Maxar Technologies), Ursa Space Systems, Airbus Defence and Space, SpaceKnow, Orbital Insight, and Planet Labs, each vying for market share through technological innovation and strategic partnerships. The continuous improvement in satellite technology, leading to higher resolution imagery and enhanced data analytics capabilities, contributes to market expansion. However, challenges exist, such as the high initial investment costs associated with satellite technology and the need for specialized expertise in data interpretation and analysis. Despite these constraints, the ongoing development of cost-effective solutions and the increasing accessibility of satellite data are expected to drive continued market growth over the forecast period, with particular expansion in regions with developing economies and significant infrastructure needs.
Satellite-based Earth Observation Market: A Comprehensive Report (2019-2033)
This in-depth report provides a comprehensive analysis of the Satellite-based Earth Observation market, encompassing market dynamics, growth trends, regional dominance, product landscape, key players, and future outlook. The study period covers 2019-2033, with a base year of 2025 and a forecast period of 2025-2033. The market is segmented by service (Data, Value-Added-Service), technology (Synthetic Aperture Radar (SAR), Optical), and application (Urban Development, Agriculture, Climate & Environment, Energy, Infrastructure Monitoring, Disaster Management, Other). The report is essential for industry professionals, investors, and strategic decision-makers seeking to understand and capitalize on opportunities within this rapidly evolving sector. The total market size in 2025 is estimated at xx Million.
Satellite-based Earth Observation Market Market Dynamics & Structure
The satellite-based Earth observation market is characterized by a moderately concentrated landscape, with several major players competing alongside numerous smaller, specialized firms. Market concentration is expected to remain relatively stable during the forecast period, although strategic partnerships and acquisitions will influence the competitive dynamics. Technological innovation, particularly in SAR and hyperspectral imaging, is a major driver of growth. Regulatory frameworks, including data privacy regulations and access to space, significantly impact market accessibility. The rise of cloud computing and AI significantly alters data processing and analysis, posing both opportunities and challenges. Competition from alternative data sources, such as drones and aerial imagery, represents a substitutional threat.
- Market Concentration: Moderately concentrated, with a top 5 market share of approximately 60%.
- Technological Innovation: Key drivers include advancements in SAR, hyperspectral imaging, and AI-powered analytics.
- Regulatory Landscape: Varied by region, impacting data access and usage. Data privacy regulations pose a significant challenge.
- Competitive Substitutes: Drones and aerial photography present increasing competition, particularly for lower-altitude applications.
- M&A Activity: A moderate level of M&A activity is observed, driven by companies seeking to expand their technology portfolios and geographic reach. An estimated xx M&A deals occurred during the historical period (2019-2024).
- End-User Demographics: Government agencies, commercial businesses, and research institutions are the primary end-users.
Satellite-based Earth Observation Market Growth Trends & Insights
The satellite-based Earth observation market is experiencing robust growth, driven by increasing demand for geospatial intelligence across various sectors. Technological advancements, particularly in high-resolution imagery, improved data processing, and the integration of AI, are accelerating market expansion. The market is witnessing an increase in adoption rates across various applications, including urban development, precision agriculture, and environmental monitoring. This is fueled by rising awareness of the value of Earth observation data for informed decision-making and efficient resource management. The market is expected to exhibit a Compound Annual Growth Rate (CAGR) of xx% during the forecast period (2025-2033), reaching an estimated value of xx Million by 2033. Market penetration is expected to increase significantly, particularly in developing economies where access to traditional data sources is limited. Consumer behavior shifts towards data-driven decision making are also contributing to market growth.
Dominant Regions, Countries, or Segments in Satellite-based Earth Observation Market
North America currently holds the largest market share in the satellite-based Earth observation market, driven by substantial government investment, robust private sector activity, and advanced technological capabilities. However, the Asia-Pacific region is projected to witness the fastest growth rate during the forecast period, fueled by rapid urbanization, economic expansion, and increasing demand for infrastructure development. Within market segmentation:
By Service: The Value-Added-Service segment is expected to exhibit faster growth than the Data segment, owing to the increasing demand for advanced analytical services and customized solutions.
By Technology: The Optical segment currently dominates the market due to its wide-ranging applications and mature technology, while the SAR segment is expected to experience significant growth due to its capability to penetrate cloud cover and provide valuable information in adverse weather conditions.
By Application: Agriculture, urban development, and environmental monitoring are the most prominent application segments driving market growth.
Key Drivers for North America: Strong government support, high technological expertise, and a well-established commercial space industry.
Key Drivers for Asia-Pacific: Rapid economic growth, increasing urbanization, and significant investments in infrastructure development.
Key Drivers for Europe: Strong research and development activities and increasing government investments in the space sector.
Satellite-based Earth Observation Market Product Landscape
The satellite-based Earth observation market features a diverse range of products, including high-resolution optical and SAR imagery, hyperspectral data, and value-added services like analytics and data integration platforms. Innovations focus on improved sensor technologies (e.g., higher resolution, wider swath), advanced data processing algorithms (e.g., AI-powered analytics), and the development of user-friendly data access platforms. Unique selling propositions often revolve around data quality, spatial and temporal resolution, and the ability to provide actionable intelligence tailored to specific customer needs. Technological advancements are rapidly changing the landscape, particularly the integration of AI and machine learning for automated analysis and interpretation of large datasets.
Key Drivers, Barriers & Challenges in Satellite-based Earth Observation Market
Key Drivers:
- Increasing demand for geospatial intelligence across various sectors (agriculture, urban planning, environmental monitoring).
- Technological advancements in sensor technology, data processing, and AI-driven analytics.
- Government investments in space exploration and Earth observation initiatives.
Key Barriers and Challenges:
- High costs associated with satellite development, launch, and operation.
- Data processing and analysis can be computationally intensive and require specialized expertise.
- Regulatory hurdles related to data privacy and access to space resources. These hurdles create significant variability by region. xx% of companies surveyed reported significant regulatory constraints.
Emerging Opportunities in Satellite-based Earth Observation Market
- Growing demand for real-time data and analytics for disaster response and emergency management.
- Expansion into new applications, such as precision agriculture, climate change monitoring, and autonomous vehicle navigation.
- Utilization of smallsat constellations for cost-effective data acquisition and improved temporal resolution.
Growth Accelerators in the Satellite-based Earth Observation Market Industry
Technological breakthroughs in areas like hyperspectral imaging and AI-driven analytics are major growth catalysts. Strategic partnerships between satellite operators, data analytics firms, and end-users create synergies and foster market expansion. Market expansion strategies targeting untapped markets (e.g., developing economies) are critical for long-term growth.
Key Players Shaping the Satellite-based Earth Observation Market Market
- MDA Corporation (Maxar Technologies)
- Ursa Space Systems Inc
- Airbus Defence and Space (Airbus SE)
- Spacceknow Inc
- Orbital Insight
- BLACKSKY TECHNOLOGY INC
- ESRI INC
- PlanetIQ LLC
- L3harris Technologies Inc
- Descartes Lab
- PLANET LABS PBC
- EOS Data Analytics Inc
- Capella Space
- IMAGESAT International (I S I) LTD
- ICEYE
Notable Milestones in Satellite-based Earth Observation Market Sector
- March 2024: The US Navy awarded Planet Labs a contract for maritime surveillance using AI-powered satellite imagery analysis.
- March 2024: ICEYE launched ICEYE Ocean Vision, a SAR product family for maritime domain awareness, enhancing vessel detection capabilities.
In-Depth Satellite-based Earth Observation Market Market Outlook
The satellite-based Earth observation market is poised for continued strong growth, driven by the increasing demand for geospatial intelligence and technological advancements. Strategic partnerships and the development of innovative applications will play a crucial role in shaping the future of this market. The market presents substantial opportunities for companies that can offer high-quality data, advanced analytics, and customized solutions tailored to specific customer needs. Further consolidation through mergers and acquisitions is likely to shape the competitive landscape in the coming years.
Satellite-based Earth Observation Market Segmentation
-
1. Service
- 1.1. Data
- 1.2. Value-Added-Service
-
2. Technology
- 2.1. Synthetic Aperture Radar (SAR)
- 2.2. Optical
-
3. Application
- 3.1. Urban Development (Includes Public Safety)
- 3.2. Agriculture
- 3.3. Climate and Environment Services
- 3.4. Energy
- 3.5. Infrastructure Monitoring
- 3.6. Disaster and Emergency Management
- 3.7. Other Applications
Satellite-based Earth Observation Market Segmentation By Geography
- 1. North America
- 2. Europe
- 3. Asia Pacific
- 4. Middle East and Africa
- 5. Latin America
Satellite-based Earth Observation Market REPORT HIGHLIGHTS
| Aspects | Details |
|---|---|
| Study Period | 2019-2033 |
| Base Year | 2024 |
| Estimated Year | 2025 |
| Forecast Period | 2025-2033 |
| Historical Period | 2019-2024 |
| Growth Rate | CAGR of 6.52% from 2019-2033 |
| Segmentation |
|
Table of Contents
- 1. Introduction
- 1.1. Research Scope
- 1.2. Market Segmentation
- 1.3. Research Methodology
- 1.4. Definitions and Assumptions
- 2. Executive Summary
- 2.1. Introduction
- 3. Market Dynamics
- 3.1. Introduction
- 3.2. Market Drivers
- 3.2.1. Increasing Requirement for Efficient Monitoring of Vast Land Areas; Rising Smart City Initiatives; Big Data and Imagery Analytics
- 3.3. Market Restrains
- 3.3.1. Availability of Open-source Data for Various Countries
- 3.4. Market Trends
- 3.4.1. Urban Development to be the Fastest Growing Application
- 4. Market Factor Analysis
- 4.1. Porters Five Forces
- 4.2. Supply/Value Chain
- 4.3. PESTEL analysis
- 4.4. Market Entropy
- 4.5. Patent/Trademark Analysis
- 5. Global Satellite-based Earth Observation Market Analysis, Insights and Forecast, 2019-2031
- 5.1. Market Analysis, Insights and Forecast - by Service
- 5.1.1. Data
- 5.1.2. Value-Added-Service
- 5.2. Market Analysis, Insights and Forecast - by Technology
- 5.2.1. Synthetic Aperture Radar (SAR)
- 5.2.2. Optical
- 5.3. Market Analysis, Insights and Forecast - by Application
- 5.3.1. Urban Development (Includes Public Safety)
- 5.3.2. Agriculture
- 5.3.3. Climate and Environment Services
- 5.3.4. Energy
- 5.3.5. Infrastructure Monitoring
- 5.3.6. Disaster and Emergency Management
- 5.3.7. Other Applications
- 5.4. Market Analysis, Insights and Forecast - by Region
- 5.4.1. North America
- 5.4.2. Europe
- 5.4.3. Asia Pacific
- 5.4.4. Middle East and Africa
- 5.4.5. Latin America
- 5.1. Market Analysis, Insights and Forecast - by Service
- 6. North America Satellite-based Earth Observation Market Analysis, Insights and Forecast, 2019-2031
- 6.1. Market Analysis, Insights and Forecast - by Service
- 6.1.1. Data
- 6.1.2. Value-Added-Service
- 6.2. Market Analysis, Insights and Forecast - by Technology
- 6.2.1. Synthetic Aperture Radar (SAR)
- 6.2.2. Optical
- 6.3. Market Analysis, Insights and Forecast - by Application
- 6.3.1. Urban Development (Includes Public Safety)
- 6.3.2. Agriculture
- 6.3.3. Climate and Environment Services
- 6.3.4. Energy
- 6.3.5. Infrastructure Monitoring
- 6.3.6. Disaster and Emergency Management
- 6.3.7. Other Applications
- 6.1. Market Analysis, Insights and Forecast - by Service
- 7. Europe Satellite-based Earth Observation Market Analysis, Insights and Forecast, 2019-2031
- 7.1. Market Analysis, Insights and Forecast - by Service
- 7.1.1. Data
- 7.1.2. Value-Added-Service
- 7.2. Market Analysis, Insights and Forecast - by Technology
- 7.2.1. Synthetic Aperture Radar (SAR)
- 7.2.2. Optical
- 7.3. Market Analysis, Insights and Forecast - by Application
- 7.3.1. Urban Development (Includes Public Safety)
- 7.3.2. Agriculture
- 7.3.3. Climate and Environment Services
- 7.3.4. Energy
- 7.3.5. Infrastructure Monitoring
- 7.3.6. Disaster and Emergency Management
- 7.3.7. Other Applications
- 7.1. Market Analysis, Insights and Forecast - by Service
- 8. Asia Pacific Satellite-based Earth Observation Market Analysis, Insights and Forecast, 2019-2031
- 8.1. Market Analysis, Insights and Forecast - by Service
- 8.1.1. Data
- 8.1.2. Value-Added-Service
- 8.2. Market Analysis, Insights and Forecast - by Technology
- 8.2.1. Synthetic Aperture Radar (SAR)
- 8.2.2. Optical
- 8.3. Market Analysis, Insights and Forecast - by Application
- 8.3.1. Urban Development (Includes Public Safety)
- 8.3.2. Agriculture
- 8.3.3. Climate and Environment Services
- 8.3.4. Energy
- 8.3.5. Infrastructure Monitoring
- 8.3.6. Disaster and Emergency Management
- 8.3.7. Other Applications
- 8.1. Market Analysis, Insights and Forecast - by Service
- 9. Middle East and Africa Satellite-based Earth Observation Market Analysis, Insights and Forecast, 2019-2031
- 9.1. Market Analysis, Insights and Forecast - by Service
- 9.1.1. Data
- 9.1.2. Value-Added-Service
- 9.2. Market Analysis, Insights and Forecast - by Technology
- 9.2.1. Synthetic Aperture Radar (SAR)
- 9.2.2. Optical
- 9.3. Market Analysis, Insights and Forecast - by Application
- 9.3.1. Urban Development (Includes Public Safety)
- 9.3.2. Agriculture
- 9.3.3. Climate and Environment Services
- 9.3.4. Energy
- 9.3.5. Infrastructure Monitoring
- 9.3.6. Disaster and Emergency Management
- 9.3.7. Other Applications
- 9.1. Market Analysis, Insights and Forecast - by Service
- 10. Latin America Satellite-based Earth Observation Market Analysis, Insights and Forecast, 2019-2031
- 10.1. Market Analysis, Insights and Forecast - by Service
- 10.1.1. Data
- 10.1.2. Value-Added-Service
- 10.2. Market Analysis, Insights and Forecast - by Technology
- 10.2.1. Synthetic Aperture Radar (SAR)
- 10.2.2. Optical
- 10.3. Market Analysis, Insights and Forecast - by Application
- 10.3.1. Urban Development (Includes Public Safety)
- 10.3.2. Agriculture
- 10.3.3. Climate and Environment Services
- 10.3.4. Energy
- 10.3.5. Infrastructure Monitoring
- 10.3.6. Disaster and Emergency Management
- 10.3.7. Other Applications
- 10.1. Market Analysis, Insights and Forecast - by Service
- 11. North America Satellite-based Earth Observation Market Analysis, Insights and Forecast, 2019-2031
- 11.1. Market Analysis, Insights and Forecast - By Country/Sub-region
- 11.1.1 United States
- 11.1.2 Canada
- 11.1.3 Mexico
- 12. Europe Satellite-based Earth Observation Market Analysis, Insights and Forecast, 2019-2031
- 12.1. Market Analysis, Insights and Forecast - By Country/Sub-region
- 12.1.1 Germany
- 12.1.2 United Kingdom
- 12.1.3 France
- 12.1.4 Spain
- 12.1.5 Italy
- 12.1.6 Spain
- 12.1.7 Belgium
- 12.1.8 Netherland
- 12.1.9 Nordics
- 12.1.10 Rest of Europe
- 13. Asia Pacific Satellite-based Earth Observation Market Analysis, Insights and Forecast, 2019-2031
- 13.1. Market Analysis, Insights and Forecast - By Country/Sub-region
- 13.1.1 China
- 13.1.2 Japan
- 13.1.3 India
- 13.1.4 South Korea
- 13.1.5 Southeast Asia
- 13.1.6 Australia
- 13.1.7 Indonesia
- 13.1.8 Phillipes
- 13.1.9 Singapore
- 13.1.10 Thailandc
- 13.1.11 Rest of Asia Pacific
- 14. South America Satellite-based Earth Observation Market Analysis, Insights and Forecast, 2019-2031
- 14.1. Market Analysis, Insights and Forecast - By Country/Sub-region
- 14.1.1 Brazil
- 14.1.2 Argentina
- 14.1.3 Peru
- 14.1.4 Chile
- 14.1.5 Colombia
- 14.1.6 Ecuador
- 14.1.7 Venezuela
- 14.1.8 Rest of South America
- 15. North America Satellite-based Earth Observation Market Analysis, Insights and Forecast, 2019-2031
- 15.1. Market Analysis, Insights and Forecast - By Country/Sub-region
- 15.1.1 United States
- 15.1.2 Canada
- 15.1.3 Mexico
- 16. MEA Satellite-based Earth Observation Market Analysis, Insights and Forecast, 2019-2031
- 16.1. Market Analysis, Insights and Forecast - By Country/Sub-region
- 16.1.1 United Arab Emirates
- 16.1.2 Saudi Arabia
- 16.1.3 South Africa
- 16.1.4 Rest of Middle East and Africa
- 17. Competitive Analysis
- 17.1. Global Market Share Analysis 2024
- 17.2. Company Profiles
- 17.2.1 MDA Corporation (Maxar Technologies)
- 17.2.1.1. Overview
- 17.2.1.2. Products
- 17.2.1.3. SWOT Analysis
- 17.2.1.4. Recent Developments
- 17.2.1.5. Financials (Based on Availability)
- 17.2.2 Ursa Space Systems Inc
- 17.2.2.1. Overview
- 17.2.2.2. Products
- 17.2.2.3. SWOT Analysis
- 17.2.2.4. Recent Developments
- 17.2.2.5. Financials (Based on Availability)
- 17.2.3 Airbus Defence and Space (Airbus SE)
- 17.2.3.1. Overview
- 17.2.3.2. Products
- 17.2.3.3. SWOT Analysis
- 17.2.3.4. Recent Developments
- 17.2.3.5. Financials (Based on Availability)
- 17.2.4 Spacceknow Inc
- 17.2.4.1. Overview
- 17.2.4.2. Products
- 17.2.4.3. SWOT Analysis
- 17.2.4.4. Recent Developments
- 17.2.4.5. Financials (Based on Availability)
- 17.2.5 Orbital Insight
- 17.2.5.1. Overview
- 17.2.5.2. Products
- 17.2.5.3. SWOT Analysis
- 17.2.5.4. Recent Developments
- 17.2.5.5. Financials (Based on Availability)
- 17.2.6 BLACKSKY TECHNOLOGY INC
- 17.2.6.1. Overview
- 17.2.6.2. Products
- 17.2.6.3. SWOT Analysis
- 17.2.6.4. Recent Developments
- 17.2.6.5. Financials (Based on Availability)
- 17.2.7 ESRI INC
- 17.2.7.1. Overview
- 17.2.7.2. Products
- 17.2.7.3. SWOT Analysis
- 17.2.7.4. Recent Developments
- 17.2.7.5. Financials (Based on Availability)
- 17.2.8 PlanetIQ LLC
- 17.2.8.1. Overview
- 17.2.8.2. Products
- 17.2.8.3. SWOT Analysis
- 17.2.8.4. Recent Developments
- 17.2.8.5. Financials (Based on Availability)
- 17.2.9 L3harris Technologies Inc
- 17.2.9.1. Overview
- 17.2.9.2. Products
- 17.2.9.3. SWOT Analysis
- 17.2.9.4. Recent Developments
- 17.2.9.5. Financials (Based on Availability)
- 17.2.10 Descartes Lab
- 17.2.10.1. Overview
- 17.2.10.2. Products
- 17.2.10.3. SWOT Analysis
- 17.2.10.4. Recent Developments
- 17.2.10.5. Financials (Based on Availability)
- 17.2.11 PLANET LABS PBC
- 17.2.11.1. Overview
- 17.2.11.2. Products
- 17.2.11.3. SWOT Analysis
- 17.2.11.4. Recent Developments
- 17.2.11.5. Financials (Based on Availability)
- 17.2.12 EOS Data Analytics Inc
- 17.2.12.1. Overview
- 17.2.12.2. Products
- 17.2.12.3. SWOT Analysis
- 17.2.12.4. Recent Developments
- 17.2.12.5. Financials (Based on Availability)
- 17.2.13 Capella Space
- 17.2.13.1. Overview
- 17.2.13.2. Products
- 17.2.13.3. SWOT Analysis
- 17.2.13.4. Recent Developments
- 17.2.13.5. Financials (Based on Availability)
- 17.2.14 IMAGESAT International (I S I) LTD
- 17.2.14.1. Overview
- 17.2.14.2. Products
- 17.2.14.3. SWOT Analysis
- 17.2.14.4. Recent Developments
- 17.2.14.5. Financials (Based on Availability)
- 17.2.15 ICEYE
- 17.2.15.1. Overview
- 17.2.15.2. Products
- 17.2.15.3. SWOT Analysis
- 17.2.15.4. Recent Developments
- 17.2.15.5. Financials (Based on Availability)
- 17.2.1 MDA Corporation (Maxar Technologies)
List of Figures
- Figure 1: Global Satellite-based Earth Observation Market Revenue Breakdown (Million, %) by Region 2024 & 2032
- Figure 2: Global Satellite-based Earth Observation Market Volume Breakdown (K Unit, %) by Region 2024 & 2032
- Figure 3: North America Satellite-based Earth Observation Market Revenue (Million), by Country 2024 & 2032
- Figure 4: North America Satellite-based Earth Observation Market Volume (K Unit), by Country 2024 & 2032
- Figure 5: North America Satellite-based Earth Observation Market Revenue Share (%), by Country 2024 & 2032
- Figure 6: North America Satellite-based Earth Observation Market Volume Share (%), by Country 2024 & 2032
- Figure 7: Europe Satellite-based Earth Observation Market Revenue (Million), by Country 2024 & 2032
- Figure 8: Europe Satellite-based Earth Observation Market Volume (K Unit), by Country 2024 & 2032
- Figure 9: Europe Satellite-based Earth Observation Market Revenue Share (%), by Country 2024 & 2032
- Figure 10: Europe Satellite-based Earth Observation Market Volume Share (%), by Country 2024 & 2032
- Figure 11: Asia Pacific Satellite-based Earth Observation Market Revenue (Million), by Country 2024 & 2032
- Figure 12: Asia Pacific Satellite-based Earth Observation Market Volume (K Unit), by Country 2024 & 2032
- Figure 13: Asia Pacific Satellite-based Earth Observation Market Revenue Share (%), by Country 2024 & 2032
- Figure 14: Asia Pacific Satellite-based Earth Observation Market Volume Share (%), by Country 2024 & 2032
- Figure 15: South America Satellite-based Earth Observation Market Revenue (Million), by Country 2024 & 2032
- Figure 16: South America Satellite-based Earth Observation Market Volume (K Unit), by Country 2024 & 2032
- Figure 17: South America Satellite-based Earth Observation Market Revenue Share (%), by Country 2024 & 2032
- Figure 18: South America Satellite-based Earth Observation Market Volume Share (%), by Country 2024 & 2032
- Figure 19: North America Satellite-based Earth Observation Market Revenue (Million), by Country 2024 & 2032
- Figure 20: North America Satellite-based Earth Observation Market Volume (K Unit), by Country 2024 & 2032
- Figure 21: North America Satellite-based Earth Observation Market Revenue Share (%), by Country 2024 & 2032
- Figure 22: North America Satellite-based Earth Observation Market Volume Share (%), by Country 2024 & 2032
- Figure 23: MEA Satellite-based Earth Observation Market Revenue (Million), by Country 2024 & 2032
- Figure 24: MEA Satellite-based Earth Observation Market Volume (K Unit), by Country 2024 & 2032
- Figure 25: MEA Satellite-based Earth Observation Market Revenue Share (%), by Country 2024 & 2032
- Figure 26: MEA Satellite-based Earth Observation Market Volume Share (%), by Country 2024 & 2032
- Figure 27: North America Satellite-based Earth Observation Market Revenue (Million), by Service 2024 & 2032
- Figure 28: North America Satellite-based Earth Observation Market Volume (K Unit), by Service 2024 & 2032
- Figure 29: North America Satellite-based Earth Observation Market Revenue Share (%), by Service 2024 & 2032
- Figure 30: North America Satellite-based Earth Observation Market Volume Share (%), by Service 2024 & 2032
- Figure 31: North America Satellite-based Earth Observation Market Revenue (Million), by Technology 2024 & 2032
- Figure 32: North America Satellite-based Earth Observation Market Volume (K Unit), by Technology 2024 & 2032
- Figure 33: North America Satellite-based Earth Observation Market Revenue Share (%), by Technology 2024 & 2032
- Figure 34: North America Satellite-based Earth Observation Market Volume Share (%), by Technology 2024 & 2032
- Figure 35: North America Satellite-based Earth Observation Market Revenue (Million), by Application 2024 & 2032
- Figure 36: North America Satellite-based Earth Observation Market Volume (K Unit), by Application 2024 & 2032
- Figure 37: North America Satellite-based Earth Observation Market Revenue Share (%), by Application 2024 & 2032
- Figure 38: North America Satellite-based Earth Observation Market Volume Share (%), by Application 2024 & 2032
- Figure 39: North America Satellite-based Earth Observation Market Revenue (Million), by Country 2024 & 2032
- Figure 40: North America Satellite-based Earth Observation Market Volume (K Unit), by Country 2024 & 2032
- Figure 41: North America Satellite-based Earth Observation Market Revenue Share (%), by Country 2024 & 2032
- Figure 42: North America Satellite-based Earth Observation Market Volume Share (%), by Country 2024 & 2032
- Figure 43: Europe Satellite-based Earth Observation Market Revenue (Million), by Service 2024 & 2032
- Figure 44: Europe Satellite-based Earth Observation Market Volume (K Unit), by Service 2024 & 2032
- Figure 45: Europe Satellite-based Earth Observation Market Revenue Share (%), by Service 2024 & 2032
- Figure 46: Europe Satellite-based Earth Observation Market Volume Share (%), by Service 2024 & 2032
- Figure 47: Europe Satellite-based Earth Observation Market Revenue (Million), by Technology 2024 & 2032
- Figure 48: Europe Satellite-based Earth Observation Market Volume (K Unit), by Technology 2024 & 2032
- Figure 49: Europe Satellite-based Earth Observation Market Revenue Share (%), by Technology 2024 & 2032
- Figure 50: Europe Satellite-based Earth Observation Market Volume Share (%), by Technology 2024 & 2032
- Figure 51: Europe Satellite-based Earth Observation Market Revenue (Million), by Application 2024 & 2032
- Figure 52: Europe Satellite-based Earth Observation Market Volume (K Unit), by Application 2024 & 2032
- Figure 53: Europe Satellite-based Earth Observation Market Revenue Share (%), by Application 2024 & 2032
- Figure 54: Europe Satellite-based Earth Observation Market Volume Share (%), by Application 2024 & 2032
- Figure 55: Europe Satellite-based Earth Observation Market Revenue (Million), by Country 2024 & 2032
- Figure 56: Europe Satellite-based Earth Observation Market Volume (K Unit), by Country 2024 & 2032
- Figure 57: Europe Satellite-based Earth Observation Market Revenue Share (%), by Country 2024 & 2032
- Figure 58: Europe Satellite-based Earth Observation Market Volume Share (%), by Country 2024 & 2032
- Figure 59: Asia Pacific Satellite-based Earth Observation Market Revenue (Million), by Service 2024 & 2032
- Figure 60: Asia Pacific Satellite-based Earth Observation Market Volume (K Unit), by Service 2024 & 2032
- Figure 61: Asia Pacific Satellite-based Earth Observation Market Revenue Share (%), by Service 2024 & 2032
- Figure 62: Asia Pacific Satellite-based Earth Observation Market Volume Share (%), by Service 2024 & 2032
- Figure 63: Asia Pacific Satellite-based Earth Observation Market Revenue (Million), by Technology 2024 & 2032
- Figure 64: Asia Pacific Satellite-based Earth Observation Market Volume (K Unit), by Technology 2024 & 2032
- Figure 65: Asia Pacific Satellite-based Earth Observation Market Revenue Share (%), by Technology 2024 & 2032
- Figure 66: Asia Pacific Satellite-based Earth Observation Market Volume Share (%), by Technology 2024 & 2032
- Figure 67: Asia Pacific Satellite-based Earth Observation Market Revenue (Million), by Application 2024 & 2032
- Figure 68: Asia Pacific Satellite-based Earth Observation Market Volume (K Unit), by Application 2024 & 2032
- Figure 69: Asia Pacific Satellite-based Earth Observation Market Revenue Share (%), by Application 2024 & 2032
- Figure 70: Asia Pacific Satellite-based Earth Observation Market Volume Share (%), by Application 2024 & 2032
- Figure 71: Asia Pacific Satellite-based Earth Observation Market Revenue (Million), by Country 2024 & 2032
- Figure 72: Asia Pacific Satellite-based Earth Observation Market Volume (K Unit), by Country 2024 & 2032
- Figure 73: Asia Pacific Satellite-based Earth Observation Market Revenue Share (%), by Country 2024 & 2032
- Figure 74: Asia Pacific Satellite-based Earth Observation Market Volume Share (%), by Country 2024 & 2032
- Figure 75: Middle East and Africa Satellite-based Earth Observation Market Revenue (Million), by Service 2024 & 2032
- Figure 76: Middle East and Africa Satellite-based Earth Observation Market Volume (K Unit), by Service 2024 & 2032
- Figure 77: Middle East and Africa Satellite-based Earth Observation Market Revenue Share (%), by Service 2024 & 2032
- Figure 78: Middle East and Africa Satellite-based Earth Observation Market Volume Share (%), by Service 2024 & 2032
- Figure 79: Middle East and Africa Satellite-based Earth Observation Market Revenue (Million), by Technology 2024 & 2032
- Figure 80: Middle East and Africa Satellite-based Earth Observation Market Volume (K Unit), by Technology 2024 & 2032
- Figure 81: Middle East and Africa Satellite-based Earth Observation Market Revenue Share (%), by Technology 2024 & 2032
- Figure 82: Middle East and Africa Satellite-based Earth Observation Market Volume Share (%), by Technology 2024 & 2032
- Figure 83: Middle East and Africa Satellite-based Earth Observation Market Revenue (Million), by Application 2024 & 2032
- Figure 84: Middle East and Africa Satellite-based Earth Observation Market Volume (K Unit), by Application 2024 & 2032
- Figure 85: Middle East and Africa Satellite-based Earth Observation Market Revenue Share (%), by Application 2024 & 2032
- Figure 86: Middle East and Africa Satellite-based Earth Observation Market Volume Share (%), by Application 2024 & 2032
- Figure 87: Middle East and Africa Satellite-based Earth Observation Market Revenue (Million), by Country 2024 & 2032
- Figure 88: Middle East and Africa Satellite-based Earth Observation Market Volume (K Unit), by Country 2024 & 2032
- Figure 89: Middle East and Africa Satellite-based Earth Observation Market Revenue Share (%), by Country 2024 & 2032
- Figure 90: Middle East and Africa Satellite-based Earth Observation Market Volume Share (%), by Country 2024 & 2032
- Figure 91: Latin America Satellite-based Earth Observation Market Revenue (Million), by Service 2024 & 2032
- Figure 92: Latin America Satellite-based Earth Observation Market Volume (K Unit), by Service 2024 & 2032
- Figure 93: Latin America Satellite-based Earth Observation Market Revenue Share (%), by Service 2024 & 2032
- Figure 94: Latin America Satellite-based Earth Observation Market Volume Share (%), by Service 2024 & 2032
- Figure 95: Latin America Satellite-based Earth Observation Market Revenue (Million), by Technology 2024 & 2032
- Figure 96: Latin America Satellite-based Earth Observation Market Volume (K Unit), by Technology 2024 & 2032
- Figure 97: Latin America Satellite-based Earth Observation Market Revenue Share (%), by Technology 2024 & 2032
- Figure 98: Latin America Satellite-based Earth Observation Market Volume Share (%), by Technology 2024 & 2032
- Figure 99: Latin America Satellite-based Earth Observation Market Revenue (Million), by Application 2024 & 2032
- Figure 100: Latin America Satellite-based Earth Observation Market Volume (K Unit), by Application 2024 & 2032
- Figure 101: Latin America Satellite-based Earth Observation Market Revenue Share (%), by Application 2024 & 2032
- Figure 102: Latin America Satellite-based Earth Observation Market Volume Share (%), by Application 2024 & 2032
- Figure 103: Latin America Satellite-based Earth Observation Market Revenue (Million), by Country 2024 & 2032
- Figure 104: Latin America Satellite-based Earth Observation Market Volume (K Unit), by Country 2024 & 2032
- Figure 105: Latin America Satellite-based Earth Observation Market Revenue Share (%), by Country 2024 & 2032
- Figure 106: Latin America Satellite-based Earth Observation Market Volume Share (%), by Country 2024 & 2032
List of Tables
- Table 1: Global Satellite-based Earth Observation Market Revenue Million Forecast, by Region 2019 & 2032
- Table 2: Global Satellite-based Earth Observation Market Volume K Unit Forecast, by Region 2019 & 2032
- Table 3: Global Satellite-based Earth Observation Market Revenue Million Forecast, by Service 2019 & 2032
- Table 4: Global Satellite-based Earth Observation Market Volume K Unit Forecast, by Service 2019 & 2032
- Table 5: Global Satellite-based Earth Observation Market Revenue Million Forecast, by Technology 2019 & 2032
- Table 6: Global Satellite-based Earth Observation Market Volume K Unit Forecast, by Technology 2019 & 2032
- Table 7: Global Satellite-based Earth Observation Market Revenue Million Forecast, by Application 2019 & 2032
- Table 8: Global Satellite-based Earth Observation Market Volume K Unit Forecast, by Application 2019 & 2032
- Table 9: Global Satellite-based Earth Observation Market Revenue Million Forecast, by Region 2019 & 2032
- Table 10: Global Satellite-based Earth Observation Market Volume K Unit Forecast, by Region 2019 & 2032
- Table 11: Global Satellite-based Earth Observation Market Revenue Million Forecast, by Country 2019 & 2032
- Table 12: Global Satellite-based Earth Observation Market Volume K Unit Forecast, by Country 2019 & 2032
- Table 13: United States Satellite-based Earth Observation Market Revenue (Million) Forecast, by Application 2019 & 2032
- Table 14: United States Satellite-based Earth Observation Market Volume (K Unit) Forecast, by Application 2019 & 2032
- Table 15: Canada Satellite-based Earth Observation Market Revenue (Million) Forecast, by Application 2019 & 2032
- Table 16: Canada Satellite-based Earth Observation Market Volume (K Unit) Forecast, by Application 2019 & 2032
- Table 17: Mexico Satellite-based Earth Observation Market Revenue (Million) Forecast, by Application 2019 & 2032
- Table 18: Mexico Satellite-based Earth Observation Market Volume (K Unit) Forecast, by Application 2019 & 2032
- Table 19: Global Satellite-based Earth Observation Market Revenue Million Forecast, by Country 2019 & 2032
- Table 20: Global Satellite-based Earth Observation Market Volume K Unit Forecast, by Country 2019 & 2032
- Table 21: Germany Satellite-based Earth Observation Market Revenue (Million) Forecast, by Application 2019 & 2032
- Table 22: Germany Satellite-based Earth Observation Market Volume (K Unit) Forecast, by Application 2019 & 2032
- Table 23: United Kingdom Satellite-based Earth Observation Market Revenue (Million) Forecast, by Application 2019 & 2032
- Table 24: United Kingdom Satellite-based Earth Observation Market Volume (K Unit) Forecast, by Application 2019 & 2032
- Table 25: France Satellite-based Earth Observation Market Revenue (Million) Forecast, by Application 2019 & 2032
- Table 26: France Satellite-based Earth Observation Market Volume (K Unit) Forecast, by Application 2019 & 2032
- Table 27: Spain Satellite-based Earth Observation Market Revenue (Million) Forecast, by Application 2019 & 2032
- Table 28: Spain Satellite-based Earth Observation Market Volume (K Unit) Forecast, by Application 2019 & 2032
- Table 29: Italy Satellite-based Earth Observation Market Revenue (Million) Forecast, by Application 2019 & 2032
- Table 30: Italy Satellite-based Earth Observation Market Volume (K Unit) Forecast, by Application 2019 & 2032
- Table 31: Spain Satellite-based Earth Observation Market Revenue (Million) Forecast, by Application 2019 & 2032
- Table 32: Spain Satellite-based Earth Observation Market Volume (K Unit) Forecast, by Application 2019 & 2032
- Table 33: Belgium Satellite-based Earth Observation Market Revenue (Million) Forecast, by Application 2019 & 2032
- Table 34: Belgium Satellite-based Earth Observation Market Volume (K Unit) Forecast, by Application 2019 & 2032
- Table 35: Netherland Satellite-based Earth Observation Market Revenue (Million) Forecast, by Application 2019 & 2032
- Table 36: Netherland Satellite-based Earth Observation Market Volume (K Unit) Forecast, by Application 2019 & 2032
- Table 37: Nordics Satellite-based Earth Observation Market Revenue (Million) Forecast, by Application 2019 & 2032
- Table 38: Nordics Satellite-based Earth Observation Market Volume (K Unit) Forecast, by Application 2019 & 2032
- Table 39: Rest of Europe Satellite-based Earth Observation Market Revenue (Million) Forecast, by Application 2019 & 2032
- Table 40: Rest of Europe Satellite-based Earth Observation Market Volume (K Unit) Forecast, by Application 2019 & 2032
- Table 41: Global Satellite-based Earth Observation Market Revenue Million Forecast, by Country 2019 & 2032
- Table 42: Global Satellite-based Earth Observation Market Volume K Unit Forecast, by Country 2019 & 2032
- Table 43: China Satellite-based Earth Observation Market Revenue (Million) Forecast, by Application 2019 & 2032
- Table 44: China Satellite-based Earth Observation Market Volume (K Unit) Forecast, by Application 2019 & 2032
- Table 45: Japan Satellite-based Earth Observation Market Revenue (Million) Forecast, by Application 2019 & 2032
- Table 46: Japan Satellite-based Earth Observation Market Volume (K Unit) Forecast, by Application 2019 & 2032
- Table 47: India Satellite-based Earth Observation Market Revenue (Million) Forecast, by Application 2019 & 2032
- Table 48: India Satellite-based Earth Observation Market Volume (K Unit) Forecast, by Application 2019 & 2032
- Table 49: South Korea Satellite-based Earth Observation Market Revenue (Million) Forecast, by Application 2019 & 2032
- Table 50: South Korea Satellite-based Earth Observation Market Volume (K Unit) Forecast, by Application 2019 & 2032
- Table 51: Southeast Asia Satellite-based Earth Observation Market Revenue (Million) Forecast, by Application 2019 & 2032
- Table 52: Southeast Asia Satellite-based Earth Observation Market Volume (K Unit) Forecast, by Application 2019 & 2032
- Table 53: Australia Satellite-based Earth Observation Market Revenue (Million) Forecast, by Application 2019 & 2032
- Table 54: Australia Satellite-based Earth Observation Market Volume (K Unit) Forecast, by Application 2019 & 2032
- Table 55: Indonesia Satellite-based Earth Observation Market Revenue (Million) Forecast, by Application 2019 & 2032
- Table 56: Indonesia Satellite-based Earth Observation Market Volume (K Unit) Forecast, by Application 2019 & 2032
- Table 57: Phillipes Satellite-based Earth Observation Market Revenue (Million) Forecast, by Application 2019 & 2032
- Table 58: Phillipes Satellite-based Earth Observation Market Volume (K Unit) Forecast, by Application 2019 & 2032
- Table 59: Singapore Satellite-based Earth Observation Market Revenue (Million) Forecast, by Application 2019 & 2032
- Table 60: Singapore Satellite-based Earth Observation Market Volume (K Unit) Forecast, by Application 2019 & 2032
- Table 61: Thailandc Satellite-based Earth Observation Market Revenue (Million) Forecast, by Application 2019 & 2032
- Table 62: Thailandc Satellite-based Earth Observation Market Volume (K Unit) Forecast, by Application 2019 & 2032
- Table 63: Rest of Asia Pacific Satellite-based Earth Observation Market Revenue (Million) Forecast, by Application 2019 & 2032
- Table 64: Rest of Asia Pacific Satellite-based Earth Observation Market Volume (K Unit) Forecast, by Application 2019 & 2032
- Table 65: Global Satellite-based Earth Observation Market Revenue Million Forecast, by Country 2019 & 2032
- Table 66: Global Satellite-based Earth Observation Market Volume K Unit Forecast, by Country 2019 & 2032
- Table 67: Brazil Satellite-based Earth Observation Market Revenue (Million) Forecast, by Application 2019 & 2032
- Table 68: Brazil Satellite-based Earth Observation Market Volume (K Unit) Forecast, by Application 2019 & 2032
- Table 69: Argentina Satellite-based Earth Observation Market Revenue (Million) Forecast, by Application 2019 & 2032
- Table 70: Argentina Satellite-based Earth Observation Market Volume (K Unit) Forecast, by Application 2019 & 2032
- Table 71: Peru Satellite-based Earth Observation Market Revenue (Million) Forecast, by Application 2019 & 2032
- Table 72: Peru Satellite-based Earth Observation Market Volume (K Unit) Forecast, by Application 2019 & 2032
- Table 73: Chile Satellite-based Earth Observation Market Revenue (Million) Forecast, by Application 2019 & 2032
- Table 74: Chile Satellite-based Earth Observation Market Volume (K Unit) Forecast, by Application 2019 & 2032
- Table 75: Colombia Satellite-based Earth Observation Market Revenue (Million) Forecast, by Application 2019 & 2032
- Table 76: Colombia Satellite-based Earth Observation Market Volume (K Unit) Forecast, by Application 2019 & 2032
- Table 77: Ecuador Satellite-based Earth Observation Market Revenue (Million) Forecast, by Application 2019 & 2032
- Table 78: Ecuador Satellite-based Earth Observation Market Volume (K Unit) Forecast, by Application 2019 & 2032
- Table 79: Venezuela Satellite-based Earth Observation Market Revenue (Million) Forecast, by Application 2019 & 2032
- Table 80: Venezuela Satellite-based Earth Observation Market Volume (K Unit) Forecast, by Application 2019 & 2032
- Table 81: Rest of South America Satellite-based Earth Observation Market Revenue (Million) Forecast, by Application 2019 & 2032
- Table 82: Rest of South America Satellite-based Earth Observation Market Volume (K Unit) Forecast, by Application 2019 & 2032
- Table 83: Global Satellite-based Earth Observation Market Revenue Million Forecast, by Country 2019 & 2032
- Table 84: Global Satellite-based Earth Observation Market Volume K Unit Forecast, by Country 2019 & 2032
- Table 85: United States Satellite-based Earth Observation Market Revenue (Million) Forecast, by Application 2019 & 2032
- Table 86: United States Satellite-based Earth Observation Market Volume (K Unit) Forecast, by Application 2019 & 2032
- Table 87: Canada Satellite-based Earth Observation Market Revenue (Million) Forecast, by Application 2019 & 2032
- Table 88: Canada Satellite-based Earth Observation Market Volume (K Unit) Forecast, by Application 2019 & 2032
- Table 89: Mexico Satellite-based Earth Observation Market Revenue (Million) Forecast, by Application 2019 & 2032
- Table 90: Mexico Satellite-based Earth Observation Market Volume (K Unit) Forecast, by Application 2019 & 2032
- Table 91: Global Satellite-based Earth Observation Market Revenue Million Forecast, by Country 2019 & 2032
- Table 92: Global Satellite-based Earth Observation Market Volume K Unit Forecast, by Country 2019 & 2032
- Table 93: United Arab Emirates Satellite-based Earth Observation Market Revenue (Million) Forecast, by Application 2019 & 2032
- Table 94: United Arab Emirates Satellite-based Earth Observation Market Volume (K Unit) Forecast, by Application 2019 & 2032
- Table 95: Saudi Arabia Satellite-based Earth Observation Market Revenue (Million) Forecast, by Application 2019 & 2032
- Table 96: Saudi Arabia Satellite-based Earth Observation Market Volume (K Unit) Forecast, by Application 2019 & 2032
- Table 97: South Africa Satellite-based Earth Observation Market Revenue (Million) Forecast, by Application 2019 & 2032
- Table 98: South Africa Satellite-based Earth Observation Market Volume (K Unit) Forecast, by Application 2019 & 2032
- Table 99: Rest of Middle East and Africa Satellite-based Earth Observation Market Revenue (Million) Forecast, by Application 2019 & 2032
- Table 100: Rest of Middle East and Africa Satellite-based Earth Observation Market Volume (K Unit) Forecast, by Application 2019 & 2032
- Table 101: Global Satellite-based Earth Observation Market Revenue Million Forecast, by Service 2019 & 2032
- Table 102: Global Satellite-based Earth Observation Market Volume K Unit Forecast, by Service 2019 & 2032
- Table 103: Global Satellite-based Earth Observation Market Revenue Million Forecast, by Technology 2019 & 2032
- Table 104: Global Satellite-based Earth Observation Market Volume K Unit Forecast, by Technology 2019 & 2032
- Table 105: Global Satellite-based Earth Observation Market Revenue Million Forecast, by Application 2019 & 2032
- Table 106: Global Satellite-based Earth Observation Market Volume K Unit Forecast, by Application 2019 & 2032
- Table 107: Global Satellite-based Earth Observation Market Revenue Million Forecast, by Country 2019 & 2032
- Table 108: Global Satellite-based Earth Observation Market Volume K Unit Forecast, by Country 2019 & 2032
- Table 109: Global Satellite-based Earth Observation Market Revenue Million Forecast, by Service 2019 & 2032
- Table 110: Global Satellite-based Earth Observation Market Volume K Unit Forecast, by Service 2019 & 2032
- Table 111: Global Satellite-based Earth Observation Market Revenue Million Forecast, by Technology 2019 & 2032
- Table 112: Global Satellite-based Earth Observation Market Volume K Unit Forecast, by Technology 2019 & 2032
- Table 113: Global Satellite-based Earth Observation Market Revenue Million Forecast, by Application 2019 & 2032
- Table 114: Global Satellite-based Earth Observation Market Volume K Unit Forecast, by Application 2019 & 2032
- Table 115: Global Satellite-based Earth Observation Market Revenue Million Forecast, by Country 2019 & 2032
- Table 116: Global Satellite-based Earth Observation Market Volume K Unit Forecast, by Country 2019 & 2032
- Table 117: Global Satellite-based Earth Observation Market Revenue Million Forecast, by Service 2019 & 2032
- Table 118: Global Satellite-based Earth Observation Market Volume K Unit Forecast, by Service 2019 & 2032
- Table 119: Global Satellite-based Earth Observation Market Revenue Million Forecast, by Technology 2019 & 2032
- Table 120: Global Satellite-based Earth Observation Market Volume K Unit Forecast, by Technology 2019 & 2032
- Table 121: Global Satellite-based Earth Observation Market Revenue Million Forecast, by Application 2019 & 2032
- Table 122: Global Satellite-based Earth Observation Market Volume K Unit Forecast, by Application 2019 & 2032
- Table 123: Global Satellite-based Earth Observation Market Revenue Million Forecast, by Country 2019 & 2032
- Table 124: Global Satellite-based Earth Observation Market Volume K Unit Forecast, by Country 2019 & 2032
- Table 125: Global Satellite-based Earth Observation Market Revenue Million Forecast, by Service 2019 & 2032
- Table 126: Global Satellite-based Earth Observation Market Volume K Unit Forecast, by Service 2019 & 2032
- Table 127: Global Satellite-based Earth Observation Market Revenue Million Forecast, by Technology 2019 & 2032
- Table 128: Global Satellite-based Earth Observation Market Volume K Unit Forecast, by Technology 2019 & 2032
- Table 129: Global Satellite-based Earth Observation Market Revenue Million Forecast, by Application 2019 & 2032
- Table 130: Global Satellite-based Earth Observation Market Volume K Unit Forecast, by Application 2019 & 2032
- Table 131: Global Satellite-based Earth Observation Market Revenue Million Forecast, by Country 2019 & 2032
- Table 132: Global Satellite-based Earth Observation Market Volume K Unit Forecast, by Country 2019 & 2032
- Table 133: Global Satellite-based Earth Observation Market Revenue Million Forecast, by Service 2019 & 2032
- Table 134: Global Satellite-based Earth Observation Market Volume K Unit Forecast, by Service 2019 & 2032
- Table 135: Global Satellite-based Earth Observation Market Revenue Million Forecast, by Technology 2019 & 2032
- Table 136: Global Satellite-based Earth Observation Market Volume K Unit Forecast, by Technology 2019 & 2032
- Table 137: Global Satellite-based Earth Observation Market Revenue Million Forecast, by Application 2019 & 2032
- Table 138: Global Satellite-based Earth Observation Market Volume K Unit Forecast, by Application 2019 & 2032
- Table 139: Global Satellite-based Earth Observation Market Revenue Million Forecast, by Country 2019 & 2032
- Table 140: Global Satellite-based Earth Observation Market Volume K Unit Forecast, by Country 2019 & 2032
Frequently Asked Questions
1. What is the projected Compound Annual Growth Rate (CAGR) of the Satellite-based Earth Observation Market?
The projected CAGR is approximately 6.52%.
2. Which companies are prominent players in the Satellite-based Earth Observation Market?
Key companies in the market include MDA Corporation (Maxar Technologies), Ursa Space Systems Inc, Airbus Defence and Space (Airbus SE), Spacceknow Inc, Orbital Insight, BLACKSKY TECHNOLOGY INC, ESRI INC, PlanetIQ LLC, L3harris Technologies Inc, Descartes Lab, PLANET LABS PBC, EOS Data Analytics Inc, Capella Space, IMAGESAT International (I S I) LTD, ICEYE.
3. What are the main segments of the Satellite-based Earth Observation Market?
The market segments include Service, Technology, Application.
4. Can you provide details about the market size?
The market size is estimated to be USD 4.04 Million as of 2022.
5. What are some drivers contributing to market growth?
Increasing Requirement for Efficient Monitoring of Vast Land Areas; Rising Smart City Initiatives; Big Data and Imagery Analytics.
6. What are the notable trends driving market growth?
Urban Development to be the Fastest Growing Application.
7. Are there any restraints impacting market growth?
Availability of Open-source Data for Various Countries.
8. Can you provide examples of recent developments in the market?
March 2024 - the US Navy awarded Planet Labs a contract for maritime surveillance in the Pacific. The company’s satellite imagery will be used for vessel detection and monitoring by the Naval Information Warfare Center Pacific. For this initiative, Planet will collaborate with SynMax, a data analytics organization specializing in artificial intelligence (AI) and satellite imagery, to deliver actionable intelligence to its customers.
9. What pricing options are available for accessing the report?
Pricing options include single-user, multi-user, and enterprise licenses priced at USD 4750, USD 5250, and USD 8750 respectively.
10. Is the market size provided in terms of value or volume?
The market size is provided in terms of value, measured in Million and volume, measured in K Unit.
11. Are there any specific market keywords associated with the report?
Yes, the market keyword associated with the report is "Satellite-based Earth Observation Market," which aids in identifying and referencing the specific market segment covered.
12. How do I determine which pricing option suits my needs best?
The pricing options vary based on user requirements and access needs. Individual users may opt for single-user licenses, while businesses requiring broader access may choose multi-user or enterprise licenses for cost-effective access to the report.
13. Are there any additional resources or data provided in the Satellite-based Earth Observation Market report?
While the report offers comprehensive insights, it's advisable to review the specific contents or supplementary materials provided to ascertain if additional resources or data are available.
14. How can I stay updated on further developments or reports in the Satellite-based Earth Observation Market?
To stay informed about further developments, trends, and reports in the Satellite-based Earth Observation Market, consider subscribing to industry newsletters, following relevant companies and organizations, or regularly checking reputable industry news sources and publications.
Methodology
Step 1 - Identification of Relevant Samples Size from Population Database


Step 2 - Approaches for Defining Global Market Size (Value, Volume* & Price*)

Note*: In applicable scenarios
Step 3 - Data Sources
Primary Research
- Web Analytics
- Survey Reports
- Research Institute
- Latest Research Reports
- Opinion Leaders
Secondary Research
- Annual Reports
- White Paper
- Latest Press Release
- Industry Association
- Paid Database
- Investor Presentations

Step 4 - Data Triangulation
Involves using different sources of information in order to increase the validity of a study
These sources are likely to be stakeholders in a program - participants, other researchers, program staff, other community members, and so on.
Then we put all data in single framework & apply various statistical tools to find out the dynamic on the market.
During the analysis stage, feedback from the stakeholder groups would be compared to determine areas of agreement as well as areas of divergence


