

Key Insights
The Satcom On The Move (SOTM) antenna market is experiencing robust growth, projected to reach a significant valuation by 2033. Driven by escalating demand from both military and civil sectors, particularly for continuous connectivity in challenging environments, the market is set to expand at a Compound Annual Growth Rate (CAGR) of approximately 15% over the forecast period. The military application segment remains a dominant force, fueled by the need for secure and reliable satellite communication for reconnaissance, surveillance, and tactical operations. Concurrently, the civil sector is witnessing substantial uptake, propelled by advancements in satellite technology, the proliferation of broadband internet access, and the growing adoption of SOTM antennas in critical infrastructure, transportation (including maritime and aviation), and emergency services. The increasing deployment of Low Earth Orbit (LEO) and Medium Earth Orbit (MEO) satellite constellations is further augmenting market potential by offering enhanced bandwidth and reduced latency, making SOTM solutions more attractive for a wider range of applications.
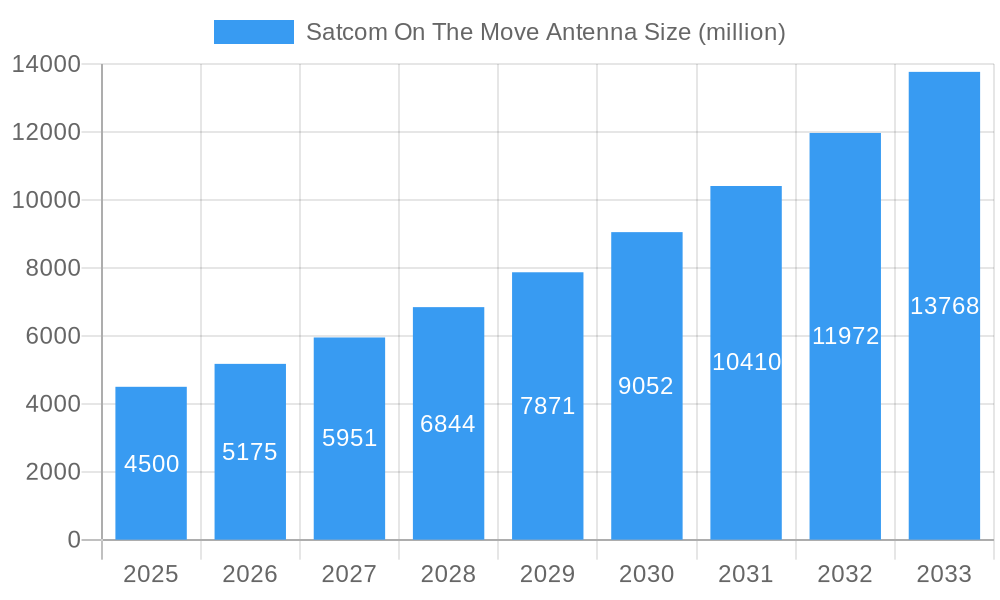
Satcom On The Move Antenna Market Size (In Billion)
Key technological advancements and evolving market dynamics are shaping the Satcom On The Move antenna landscape. Innovations in phased array antennas and flat panel antennas are driving miniaturization, increased efficiency, and lower power consumption, making these systems more adaptable for diverse platforms. The growing emphasis on multi-orbit capabilities, allowing seamless switching between different satellite constellations (GEO, MEO, LEO), is a critical trend enabling uninterrupted connectivity. While the market presents immense opportunities, certain restraints, such as the high initial cost of advanced SOTM systems and the stringent regulatory landscape governing satellite spectrum, pose challenges. However, the ongoing technological evolution, coupled with strategic partnerships and investments by key industry players like Aselsan, BAE Systems, Honeywell, and Viasat, is expected to mitigate these restraints and propel sustained market expansion. Geographically, North America and Europe are anticipated to lead market revenue due to significant defense spending and the early adoption of advanced satellite communication technologies. The Asia Pacific region, with its rapidly growing economies and increasing need for connectivity in remote areas, represents a high-growth potential market.
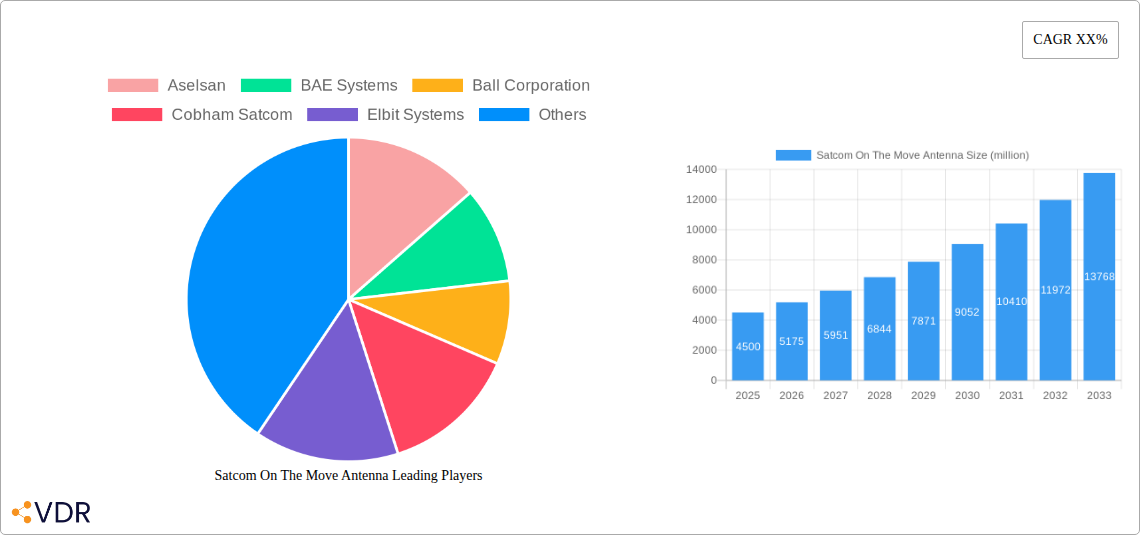
Satcom On The Move Antenna Company Market Share
Here's the SEO-optimized report description for Satcom On The Move Antenna, designed for maximum visibility and industry engagement:
Satcom On The Move Antenna Market Analysis 2019-2033: Trends, Opportunities & Forecasts
Gain unparalleled insights into the dynamic Satcom On The Move (SOTM) Antenna market with this comprehensive report. Covering a study period of 2019–2033, with a base and estimated year of 2025, and a forecast period of 2025–2033, this analysis provides deep dives into market structure, growth trends, regional dominance, product innovation, and critical growth drivers. Essential for industry professionals seeking to understand the evolving landscape of mobile satellite communications.
Satcom On The Move Antenna Market Dynamics & Structure
The global Satcom On The Move Antenna market exhibits moderate to high concentration, with key players investing heavily in technological advancements to secure market share. Innovations in phased array and electronically steered antennas are critical drivers, promising enhanced performance and reduced form factors. Regulatory frameworks, particularly those concerning spectrum allocation and satellite terminal certifications, play a significant role in shaping market access and product development. Competitive product substitutes, such as 5G and terrestrial wireless networks, are present, but SOTM antennas offer unparalleled connectivity in remote and mobile environments. End-user demographics are increasingly diverse, spanning military operations, critical infrastructure, transportation, and leisure. Mergers and acquisitions (M&A) are a notable trend, with companies seeking to consolidate capabilities and expand their product portfolios. For instance, M&A deal volumes are projected to increase by 15% over the forecast period, driven by the demand for integrated satcom solutions. Barriers to innovation include high R&D costs and the long development cycles inherent in aerospace and defense technologies.
- Market Concentration: Moderate to high, driven by significant R&D investments and strategic acquisitions.
- Technological Innovation: Focus on phased array, electronically steered antennas, and multi-band capabilities.
- Regulatory Frameworks: Spectrum allocation and certification are key influencing factors.
- Competitive Substitutes: Terrestrial wireless and 5G networks, but with limitations in reach.
- End-User Demographics: Diverse, including defense, transportation, and energy sectors.
- M&A Trends: Increasing consolidation to offer integrated solutions, with an estimated 15% increase in deal volume.
Satcom On The Move Antenna Growth Trends & Insights
The Satcom On The Move Antenna market is poised for substantial growth, fueled by increasing demand for ubiquitous connectivity across various applications. The market size is projected to expand from an estimated $3,500 million in 2025 to over $7,200 million by 2033, exhibiting a compound annual growth rate (CAGR) of approximately 9.5%. Adoption rates are accelerating, particularly within the defense sector for tactical communications and intelligence, surveillance, and reconnaissance (ISR) missions. Technological disruptions are continuously redefining the market, with the advent of LEO satellite constellations enabling smaller, more affordable, and higher-throughput SOTM terminals. Consumer behavior shifts are also contributing, as individuals and businesses in remote areas demand seamless internet access for remote work, IoT applications, and advanced entertainment. Market penetration in the civil aviation and maritime sectors is expected to see significant increases, driven by passenger connectivity demands and operational efficiency improvements. The evolution towards multi-band antennas capable of operating across Ku, Ka, and soon Q/V bands will further drive adoption by offering greater flexibility and resilience in connectivity.
Dominant Regions, Countries, or Segments in Satcom On The Move Antenna
The Military application segment is unequivocally the dominant force driving growth in the Satcom On The Move Antenna market. This dominance is underpinned by substantial government defense budgets, ongoing geopolitical realignments, and the critical need for secure, reliable, and always-on communication for deployed forces. The United States, as the largest defense spender globally, spearheads this demand, with significant investments in advanced communication technologies for its various branches.
- Dominant Application Segment: Military. This segment is expected to command a market share of over 65% by 2033, driven by defense modernization programs and operational requirements.
- Key Regional Driver: North America, particularly the United States, due to its extensive military presence and advanced technological adoption. Europe also represents a significant market, with increasing defense cooperation and modernization initiatives.
- Technological Preference: Ku Band remains prevalent due to its established infrastructure and widespread use, but Ka Band adoption is rapidly increasing for higher bandwidth applications. Q and V Band technologies are emerging, promising even greater capacity for specialized military applications.
- Growth Factors:
- Escalating Defense Spending: Countries worldwide are increasing their defense budgets, prioritizing advanced communication systems.
- Demand for Real-Time Intelligence: Military operations require immediate data transmission for ISR, command, and control, making SOTM critical.
- LEO Constellation Integration: The deployment of LEO satellites is enabling smaller, more agile, and cost-effective SOTM solutions for tactical use.
- Enhanced Mobility and Autonomy: SOTM antennas enable autonomous operations and enhanced situational awareness for ground, air, and sea platforms.
- Market Share & Potential: The military segment is projected to grow at a CAGR of 10.2%, significantly outpacing other segments. Its market share is expected to remain robust throughout the forecast period, reflecting the sustained strategic importance of satcom in defense.
Satcom On The Move Antenna Product Landscape
The Satcom On The Move Antenna product landscape is characterized by rapid innovation, with a focus on miniaturization, increased bandwidth, and multi-band capabilities. Leading companies are developing electronically steered arrays (ESAs) that offer seamless tracking without moving parts, enhancing reliability and reducing maintenance. Applications span military ISR, border surveillance, and tactical communications; civil aviation for in-flight Wi-Fi; maritime for crew welfare and operational efficiency; and land mobile for emergency response and remote enterprise connectivity. Performance metrics are increasingly impressive, with data rates reaching several hundred Mbps and low latency achieved through integration with LEO satellite networks. Unique selling propositions include ultra-low profile designs, robust environmental resistance, and integration with advanced satellite modems and management systems. Technological advancements are pushing towards higher frequencies (Q/V Band) for greater capacity and the development of hybrid solutions combining satellite and terrestrial networks.
Key Drivers, Barriers & Challenges in Satcom On The Move Antenna
Key Drivers:
- Growing demand for mobile broadband: The increasing need for constant connectivity across all modes of transport and in remote areas.
- Advancements in satellite technology: The proliferation of LEO constellations offering higher speeds and lower latency.
- Defense modernization programs: Significant investments in satcom for military operations and intelligence gathering.
- IoT and M2M communication: The expansion of the Internet of Things requires reliable connectivity in remote locations.
Barriers & Challenges:
- High initial cost of equipment: SOTM terminals can be expensive, particularly for smaller organizations.
- Spectrum availability and interference: Competition for satellite spectrum and potential interference from other sources.
- Regulatory complexities: Navigating different national and international regulations for satellite terminals.
- Supply chain disruptions: Potential delays in component sourcing and manufacturing.
- Integration challenges: Ensuring seamless compatibility with existing terrestrial networks and platforms.
Emerging Opportunities in Satcom On The Move Antenna
Emerging opportunities in the Satcom On The Move Antenna sector are abundant, driven by evolving technological capabilities and expanding market needs. The rapid deployment of Low Earth Orbit (LEO) satellite constellations is a significant catalyst, enabling the development of smaller, more affordable, and higher-performance SOTM terminals for a wider consumer base. Untapped markets in rural broadband, disaster response, and remote industrial operations present substantial growth potential. Innovative applications such as real-time environmental monitoring, autonomous vehicle connectivity, and enhanced in-flight passenger services are gaining traction. Furthermore, the increasing demand for reliable connectivity in the global logistics and transportation sectors, including long-haul trucking and inland waterways, represents a growing niche. The development of integrated satcom-terrestrial hybrid solutions also offers opportunities for seamless and resilient connectivity across diverse environments.
Growth Accelerators in the Satcom On The Move Antenna Industry
The Satcom On The Move Antenna industry is propelled by several key growth accelerators. The continuous innovation in antenna design, particularly the shift towards electronically steered arrays (ESAs), significantly reduces size, weight, and power (SWaP) requirements, making SOTM solutions more adaptable to various platforms. Strategic partnerships between antenna manufacturers, satellite operators, and service providers are crucial for delivering end-to-end solutions and expanding market reach. The increasing adoption of cloud-based services and edge computing in mobile environments further necessitates robust and continuous connectivity, directly benefiting SOTM adoption. Furthermore, government initiatives promoting digital inclusion and connectivity in underserved regions are creating new market segments and driving demand for affordable and reliable SOTM solutions.
Key Players Shaping the Satcom On The Move Antenna Market
- Aselsan
- BAE Systems
- Ball Corporation
- Cobham Satcom
- Elbit Systems
- General Dynamics
- Gilat Satellite Networks
- Honeywell
- Hughes Network Systems
- Indra Sistemas
- Iridium Communications
- L3Harris Technologies
- Leonardo DRS
- ND SatCom
- Singapore Technologies Engineering
- Thales
- Viasat
Notable Milestones in Satcom On The Move Antenna Sector
- 2020: Launch of new, compact ESA terminals for military applications by L3Harris Technologies, enabling easier integration onto smaller vehicles.
- 2021: Viasat announces advancements in its Ka-band SOTM antenna technology, offering higher throughput for commercial aviation.
- 2022: Cobham Satcom and Inmarsat partner to develop next-generation SOTM terminals for maritime and land-mobile users.
- 2023: Elbit Systems introduces a new generation of multi-band SOTM antennas supporting simultaneous operation across multiple frequency bands for enhanced flexibility.
- 2024: Gilat Satellite Networks showcases innovative SOTM solutions leveraging LEO satellite constellations for improved performance and cost-efficiency.
In-Depth Satcom On The Move Antenna Market Outlook
The future outlook for the Satcom On The Move Antenna market is exceptionally bright, characterized by sustained innovation and expanding application reach. Growth accelerators such as advancements in phased array technology, the continued rollout of LEO satellite constellations, and increasing defense spending will continue to fuel market expansion. Strategic partnerships and the development of integrated satcom-terrestrial solutions will broaden accessibility and enhance service offerings. Emerging opportunities in sectors like autonomous mobility, advanced IoT deployments, and global broadband initiatives present significant untapped potential. The market is poised for robust growth, driven by the fundamental human and industrial need for seamless, reliable connectivity, irrespective of location or platform.
Satcom On The Move Antenna Segmentation
-
1. Application
- 1.1. Military
- 1.2. Civil
-
2. Types
- 2.1. Ku Band
- 2.2. Ka Band
- 2.3. Q and V Band
Satcom On The Move Antenna Segmentation By Geography
-
1. North America
- 1.1. United States
- 1.2. Canada
- 1.3. Mexico
-
2. South America
- 2.1. Brazil
- 2.2. Argentina
- 2.3. Rest of South America
-
3. Europe
- 3.1. United Kingdom
- 3.2. Germany
- 3.3. France
- 3.4. Italy
- 3.5. Spain
- 3.6. Russia
- 3.7. Benelux
- 3.8. Nordics
- 3.9. Rest of Europe
-
4. Middle East & Africa
- 4.1. Turkey
- 4.2. Israel
- 4.3. GCC
- 4.4. North Africa
- 4.5. South Africa
- 4.6. Rest of Middle East & Africa
-
5. Asia Pacific
- 5.1. China
- 5.2. India
- 5.3. Japan
- 5.4. South Korea
- 5.5. ASEAN
- 5.6. Oceania
- 5.7. Rest of Asia Pacific
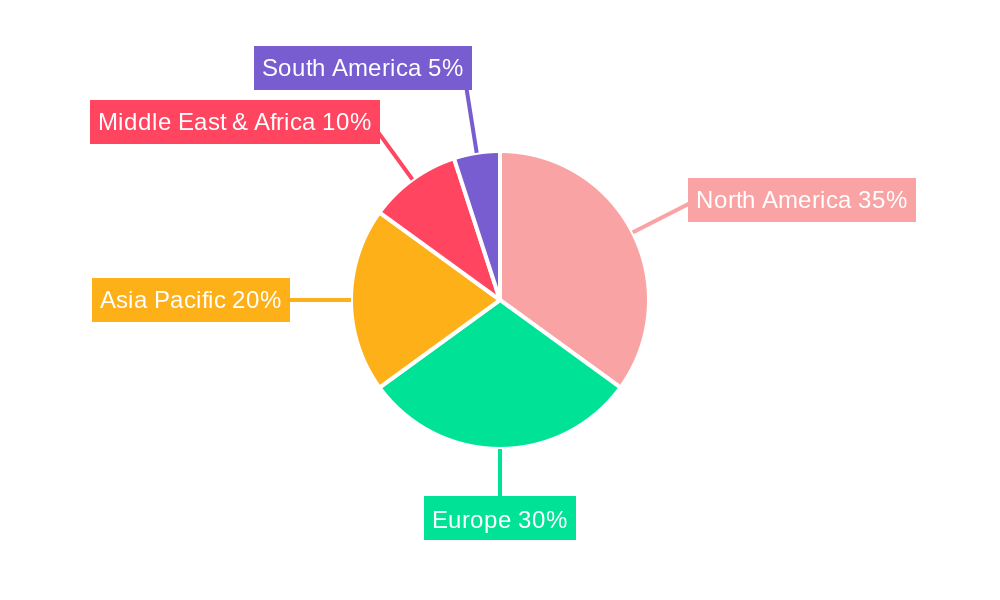
Satcom On The Move Antenna Regional Market Share
Geographic Coverage of Satcom On The Move Antenna
Satcom On The Move Antenna REPORT HIGHLIGHTS
| Aspects | Details |
|---|---|
| Study Period | 2020-2034 |
| Base Year | 2025 |
| Estimated Year | 2026 |
| Forecast Period | 2026-2034 |
| Historical Period | 2020-2025 |
| Growth Rate | CAGR of 14.1% from 2020-2034 |
| Segmentation |
|
Table of Contents
- 1. Introduction
- 1.1. Research Scope
- 1.2. Market Segmentation
- 1.3. Research Objective
- 1.4. Definitions and Assumptions
- 2. Executive Summary
- 2.1. Market Snapshot
- 3. Market Dynamics
- 3.1. Market Drivers
- 3.2. Market Restrains
- 3.3. Market Trends
- 3.4. Market Opportunities
- 4. Market Factor Analysis
- 4.1. Porters Five Forces
- 4.1.1. Bargaining Power of Suppliers
- 4.1.2. Bargaining Power of Buyers
- 4.1.3. Threat of New Entrants
- 4.1.4. Threat of Substitutes
- 4.1.5. Competitive Rivalry
- 4.2. PESTEL analysis
- 4.3. BCG Analysis
- 4.3.1. Stars (High Growth, High Market Share)
- 4.3.2. Cash Cows (Low Growth, High Market Share)
- 4.3.3. Question Mark (High Growth, Low Market Share)
- 4.3.4. Dogs (Low Growth, Low Market Share)
- 4.4. Ansoff Matrix Analysis
- 4.5. Supply Chain Analysis
- 4.6. Regulatory Landscape
- 4.7. Current Market Potential and Opportunity Assessment (TAM–SAM–SOM Framework)
- 4.8. VDR Analyst Note
- 4.1. Porters Five Forces
- 5. Market Analysis, Insights and Forecast 2021-2033
- 5.1. Market Analysis, Insights and Forecast - by Application
- 5.1.1. Military
- 5.1.2. Civil
- 5.2. Market Analysis, Insights and Forecast - by Types
- 5.2.1. Ku Band
- 5.2.2. Ka Band
- 5.2.3. Q and V Band
- 5.3. Market Analysis, Insights and Forecast - by Region
- 5.3.1. North America
- 5.3.2. South America
- 5.3.3. Europe
- 5.3.4. Middle East & Africa
- 5.3.5. Asia Pacific
- 5.1. Market Analysis, Insights and Forecast - by Application
- 6. Global Satcom On The Move Antenna Analysis, Insights and Forecast, 2021-2033
- 6.1. Market Analysis, Insights and Forecast - by Application
- 6.1.1. Military
- 6.1.2. Civil
- 6.2. Market Analysis, Insights and Forecast - by Types
- 6.2.1. Ku Band
- 6.2.2. Ka Band
- 6.2.3. Q and V Band
- 6.1. Market Analysis, Insights and Forecast - by Application
- 7. North America Satcom On The Move Antenna Analysis, Insights and Forecast, 2021-2033
- 7.1. Market Analysis, Insights and Forecast - by Application
- 7.1.1. Military
- 7.1.2. Civil
- 7.2. Market Analysis, Insights and Forecast - by Types
- 7.2.1. Ku Band
- 7.2.2. Ka Band
- 7.2.3. Q and V Band
- 7.1. Market Analysis, Insights and Forecast - by Application
- 8. South America Satcom On The Move Antenna Analysis, Insights and Forecast, 2021-2033
- 8.1. Market Analysis, Insights and Forecast - by Application
- 8.1.1. Military
- 8.1.2. Civil
- 8.2. Market Analysis, Insights and Forecast - by Types
- 8.2.1. Ku Band
- 8.2.2. Ka Band
- 8.2.3. Q and V Band
- 8.1. Market Analysis, Insights and Forecast - by Application
- 9. Europe Satcom On The Move Antenna Analysis, Insights and Forecast, 2021-2033
- 9.1. Market Analysis, Insights and Forecast - by Application
- 9.1.1. Military
- 9.1.2. Civil
- 9.2. Market Analysis, Insights and Forecast - by Types
- 9.2.1. Ku Band
- 9.2.2. Ka Band
- 9.2.3. Q and V Band
- 9.1. Market Analysis, Insights and Forecast - by Application
- 10. Middle East & Africa Satcom On The Move Antenna Analysis, Insights and Forecast, 2021-2033
- 10.1. Market Analysis, Insights and Forecast - by Application
- 10.1.1. Military
- 10.1.2. Civil
- 10.2. Market Analysis, Insights and Forecast - by Types
- 10.2.1. Ku Band
- 10.2.2. Ka Band
- 10.2.3. Q and V Band
- 10.1. Market Analysis, Insights and Forecast - by Application
- 11. Asia Pacific Satcom On The Move Antenna Analysis, Insights and Forecast, 2021-2033
- 11.1. Market Analysis, Insights and Forecast - by Application
- 11.1.1. Military
- 11.1.2. Civil
- 11.2. Market Analysis, Insights and Forecast - by Types
- 11.2.1. Ku Band
- 11.2.2. Ka Band
- 11.2.3. Q and V Band
- 11.1. Market Analysis, Insights and Forecast - by Application
- 12. Competitive Analysis
- 12.1. Company Profiles
- 12.1.1 Aselsan
- 12.1.1.1. Company Overview
- 12.1.1.2. Products
- 12.1.1.3. Company Financials
- 12.1.1.4. SWOT Analysis
- 12.1.2 BAE Systems
- 12.1.2.1. Company Overview
- 12.1.2.2. Products
- 12.1.2.3. Company Financials
- 12.1.2.4. SWOT Analysis
- 12.1.3 Ball Corporation
- 12.1.3.1. Company Overview
- 12.1.3.2. Products
- 12.1.3.3. Company Financials
- 12.1.3.4. SWOT Analysis
- 12.1.4 Cobham Satcom
- 12.1.4.1. Company Overview
- 12.1.4.2. Products
- 12.1.4.3. Company Financials
- 12.1.4.4. SWOT Analysis
- 12.1.5 Elbit Systems
- 12.1.5.1. Company Overview
- 12.1.5.2. Products
- 12.1.5.3. Company Financials
- 12.1.5.4. SWOT Analysis
- 12.1.6 General Dynamics
- 12.1.6.1. Company Overview
- 12.1.6.2. Products
- 12.1.6.3. Company Financials
- 12.1.6.4. SWOT Analysis
- 12.1.7 Gilat Satellite Networks
- 12.1.7.1. Company Overview
- 12.1.7.2. Products
- 12.1.7.3. Company Financials
- 12.1.7.4. SWOT Analysis
- 12.1.8 Honeywell
- 12.1.8.1. Company Overview
- 12.1.8.2. Products
- 12.1.8.3. Company Financials
- 12.1.8.4. SWOT Analysis
- 12.1.9 Hughes Network Systems
- 12.1.9.1. Company Overview
- 12.1.9.2. Products
- 12.1.9.3. Company Financials
- 12.1.9.4. SWOT Analysis
- 12.1.10 Indra Sistemas
- 12.1.10.1. Company Overview
- 12.1.10.2. Products
- 12.1.10.3. Company Financials
- 12.1.10.4. SWOT Analysis
- 12.1.11 Iridium Communications
- 12.1.11.1. Company Overview
- 12.1.11.2. Products
- 12.1.11.3. Company Financials
- 12.1.11.4. SWOT Analysis
- 12.1.12 L3Harris Technologies
- 12.1.12.1. Company Overview
- 12.1.12.2. Products
- 12.1.12.3. Company Financials
- 12.1.12.4. SWOT Analysis
- 12.1.13 Leonardo DRS
- 12.1.13.1. Company Overview
- 12.1.13.2. Products
- 12.1.13.3. Company Financials
- 12.1.13.4. SWOT Analysis
- 12.1.14 ND SatCom
- 12.1.14.1. Company Overview
- 12.1.14.2. Products
- 12.1.14.3. Company Financials
- 12.1.14.4. SWOT Analysis
- 12.1.15 Singapore Technologies Engineering
- 12.1.15.1. Company Overview
- 12.1.15.2. Products
- 12.1.15.3. Company Financials
- 12.1.15.4. SWOT Analysis
- 12.1.16 Thales
- 12.1.16.1. Company Overview
- 12.1.16.2. Products
- 12.1.16.3. Company Financials
- 12.1.16.4. SWOT Analysis
- 12.1.17 Viasat
- 12.1.17.1. Company Overview
- 12.1.17.2. Products
- 12.1.17.3. Company Financials
- 12.1.17.4. SWOT Analysis
- 12.1.1 Aselsan
- 12.2. Market Entropy
- 12.2.1 Company's Key Areas Served
- 12.2.2 Recent Developments
- 12.3. Company Market Share Analysis 2025
- 12.3.1 Top 5 Companies Market Share Analysis
- 12.3.2 Top 3 Companies Market Share Analysis
- 12.4. List of Potential Customers
- 13. Research Methodology
List of Figures
- Figure 1: Global Satcom On The Move Antenna Revenue Breakdown (undefined, %) by Region 2025 & 2033
- Figure 2: Global Satcom On The Move Antenna Volume Breakdown (K, %) by Region 2025 & 2033
- Figure 3: North America Satcom On The Move Antenna Revenue (undefined), by Application 2025 & 2033
- Figure 4: North America Satcom On The Move Antenna Volume (K), by Application 2025 & 2033
- Figure 5: North America Satcom On The Move Antenna Revenue Share (%), by Application 2025 & 2033
- Figure 6: North America Satcom On The Move Antenna Volume Share (%), by Application 2025 & 2033
- Figure 7: North America Satcom On The Move Antenna Revenue (undefined), by Types 2025 & 2033
- Figure 8: North America Satcom On The Move Antenna Volume (K), by Types 2025 & 2033
- Figure 9: North America Satcom On The Move Antenna Revenue Share (%), by Types 2025 & 2033
- Figure 10: North America Satcom On The Move Antenna Volume Share (%), by Types 2025 & 2033
- Figure 11: North America Satcom On The Move Antenna Revenue (undefined), by Country 2025 & 2033
- Figure 12: North America Satcom On The Move Antenna Volume (K), by Country 2025 & 2033
- Figure 13: North America Satcom On The Move Antenna Revenue Share (%), by Country 2025 & 2033
- Figure 14: North America Satcom On The Move Antenna Volume Share (%), by Country 2025 & 2033
- Figure 15: South America Satcom On The Move Antenna Revenue (undefined), by Application 2025 & 2033
- Figure 16: South America Satcom On The Move Antenna Volume (K), by Application 2025 & 2033
- Figure 17: South America Satcom On The Move Antenna Revenue Share (%), by Application 2025 & 2033
- Figure 18: South America Satcom On The Move Antenna Volume Share (%), by Application 2025 & 2033
- Figure 19: South America Satcom On The Move Antenna Revenue (undefined), by Types 2025 & 2033
- Figure 20: South America Satcom On The Move Antenna Volume (K), by Types 2025 & 2033
- Figure 21: South America Satcom On The Move Antenna Revenue Share (%), by Types 2025 & 2033
- Figure 22: South America Satcom On The Move Antenna Volume Share (%), by Types 2025 & 2033
- Figure 23: South America Satcom On The Move Antenna Revenue (undefined), by Country 2025 & 2033
- Figure 24: South America Satcom On The Move Antenna Volume (K), by Country 2025 & 2033
- Figure 25: South America Satcom On The Move Antenna Revenue Share (%), by Country 2025 & 2033
- Figure 26: South America Satcom On The Move Antenna Volume Share (%), by Country 2025 & 2033
- Figure 27: Europe Satcom On The Move Antenna Revenue (undefined), by Application 2025 & 2033
- Figure 28: Europe Satcom On The Move Antenna Volume (K), by Application 2025 & 2033
- Figure 29: Europe Satcom On The Move Antenna Revenue Share (%), by Application 2025 & 2033
- Figure 30: Europe Satcom On The Move Antenna Volume Share (%), by Application 2025 & 2033
- Figure 31: Europe Satcom On The Move Antenna Revenue (undefined), by Types 2025 & 2033
- Figure 32: Europe Satcom On The Move Antenna Volume (K), by Types 2025 & 2033
- Figure 33: Europe Satcom On The Move Antenna Revenue Share (%), by Types 2025 & 2033
- Figure 34: Europe Satcom On The Move Antenna Volume Share (%), by Types 2025 & 2033
- Figure 35: Europe Satcom On The Move Antenna Revenue (undefined), by Country 2025 & 2033
- Figure 36: Europe Satcom On The Move Antenna Volume (K), by Country 2025 & 2033
- Figure 37: Europe Satcom On The Move Antenna Revenue Share (%), by Country 2025 & 2033
- Figure 38: Europe Satcom On The Move Antenna Volume Share (%), by Country 2025 & 2033
- Figure 39: Middle East & Africa Satcom On The Move Antenna Revenue (undefined), by Application 2025 & 2033
- Figure 40: Middle East & Africa Satcom On The Move Antenna Volume (K), by Application 2025 & 2033
- Figure 41: Middle East & Africa Satcom On The Move Antenna Revenue Share (%), by Application 2025 & 2033
- Figure 42: Middle East & Africa Satcom On The Move Antenna Volume Share (%), by Application 2025 & 2033
- Figure 43: Middle East & Africa Satcom On The Move Antenna Revenue (undefined), by Types 2025 & 2033
- Figure 44: Middle East & Africa Satcom On The Move Antenna Volume (K), by Types 2025 & 2033
- Figure 45: Middle East & Africa Satcom On The Move Antenna Revenue Share (%), by Types 2025 & 2033
- Figure 46: Middle East & Africa Satcom On The Move Antenna Volume Share (%), by Types 2025 & 2033
- Figure 47: Middle East & Africa Satcom On The Move Antenna Revenue (undefined), by Country 2025 & 2033
- Figure 48: Middle East & Africa Satcom On The Move Antenna Volume (K), by Country 2025 & 2033
- Figure 49: Middle East & Africa Satcom On The Move Antenna Revenue Share (%), by Country 2025 & 2033
- Figure 50: Middle East & Africa Satcom On The Move Antenna Volume Share (%), by Country 2025 & 2033
- Figure 51: Asia Pacific Satcom On The Move Antenna Revenue (undefined), by Application 2025 & 2033
- Figure 52: Asia Pacific Satcom On The Move Antenna Volume (K), by Application 2025 & 2033
- Figure 53: Asia Pacific Satcom On The Move Antenna Revenue Share (%), by Application 2025 & 2033
- Figure 54: Asia Pacific Satcom On The Move Antenna Volume Share (%), by Application 2025 & 2033
- Figure 55: Asia Pacific Satcom On The Move Antenna Revenue (undefined), by Types 2025 & 2033
- Figure 56: Asia Pacific Satcom On The Move Antenna Volume (K), by Types 2025 & 2033
- Figure 57: Asia Pacific Satcom On The Move Antenna Revenue Share (%), by Types 2025 & 2033
- Figure 58: Asia Pacific Satcom On The Move Antenna Volume Share (%), by Types 2025 & 2033
- Figure 59: Asia Pacific Satcom On The Move Antenna Revenue (undefined), by Country 2025 & 2033
- Figure 60: Asia Pacific Satcom On The Move Antenna Volume (K), by Country 2025 & 2033
- Figure 61: Asia Pacific Satcom On The Move Antenna Revenue Share (%), by Country 2025 & 2033
- Figure 62: Asia Pacific Satcom On The Move Antenna Volume Share (%), by Country 2025 & 2033
List of Tables
- Table 1: Global Satcom On The Move Antenna Revenue undefined Forecast, by Application 2020 & 2033
- Table 2: Global Satcom On The Move Antenna Volume K Forecast, by Application 2020 & 2033
- Table 3: Global Satcom On The Move Antenna Revenue undefined Forecast, by Types 2020 & 2033
- Table 4: Global Satcom On The Move Antenna Volume K Forecast, by Types 2020 & 2033
- Table 5: Global Satcom On The Move Antenna Revenue undefined Forecast, by Region 2020 & 2033
- Table 6: Global Satcom On The Move Antenna Volume K Forecast, by Region 2020 & 2033
- Table 7: Global Satcom On The Move Antenna Revenue undefined Forecast, by Application 2020 & 2033
- Table 8: Global Satcom On The Move Antenna Volume K Forecast, by Application 2020 & 2033
- Table 9: Global Satcom On The Move Antenna Revenue undefined Forecast, by Types 2020 & 2033
- Table 10: Global Satcom On The Move Antenna Volume K Forecast, by Types 2020 & 2033
- Table 11: Global Satcom On The Move Antenna Revenue undefined Forecast, by Country 2020 & 2033
- Table 12: Global Satcom On The Move Antenna Volume K Forecast, by Country 2020 & 2033
- Table 13: United States Satcom On The Move Antenna Revenue (undefined) Forecast, by Application 2020 & 2033
- Table 14: United States Satcom On The Move Antenna Volume (K) Forecast, by Application 2020 & 2033
- Table 15: Canada Satcom On The Move Antenna Revenue (undefined) Forecast, by Application 2020 & 2033
- Table 16: Canada Satcom On The Move Antenna Volume (K) Forecast, by Application 2020 & 2033
- Table 17: Mexico Satcom On The Move Antenna Revenue (undefined) Forecast, by Application 2020 & 2033
- Table 18: Mexico Satcom On The Move Antenna Volume (K) Forecast, by Application 2020 & 2033
- Table 19: Global Satcom On The Move Antenna Revenue undefined Forecast, by Application 2020 & 2033
- Table 20: Global Satcom On The Move Antenna Volume K Forecast, by Application 2020 & 2033
- Table 21: Global Satcom On The Move Antenna Revenue undefined Forecast, by Types 2020 & 2033
- Table 22: Global Satcom On The Move Antenna Volume K Forecast, by Types 2020 & 2033
- Table 23: Global Satcom On The Move Antenna Revenue undefined Forecast, by Country 2020 & 2033
- Table 24: Global Satcom On The Move Antenna Volume K Forecast, by Country 2020 & 2033
- Table 25: Brazil Satcom On The Move Antenna Revenue (undefined) Forecast, by Application 2020 & 2033
- Table 26: Brazil Satcom On The Move Antenna Volume (K) Forecast, by Application 2020 & 2033
- Table 27: Argentina Satcom On The Move Antenna Revenue (undefined) Forecast, by Application 2020 & 2033
- Table 28: Argentina Satcom On The Move Antenna Volume (K) Forecast, by Application 2020 & 2033
- Table 29: Rest of South America Satcom On The Move Antenna Revenue (undefined) Forecast, by Application 2020 & 2033
- Table 30: Rest of South America Satcom On The Move Antenna Volume (K) Forecast, by Application 2020 & 2033
- Table 31: Global Satcom On The Move Antenna Revenue undefined Forecast, by Application 2020 & 2033
- Table 32: Global Satcom On The Move Antenna Volume K Forecast, by Application 2020 & 2033
- Table 33: Global Satcom On The Move Antenna Revenue undefined Forecast, by Types 2020 & 2033
- Table 34: Global Satcom On The Move Antenna Volume K Forecast, by Types 2020 & 2033
- Table 35: Global Satcom On The Move Antenna Revenue undefined Forecast, by Country 2020 & 2033
- Table 36: Global Satcom On The Move Antenna Volume K Forecast, by Country 2020 & 2033
- Table 37: United Kingdom Satcom On The Move Antenna Revenue (undefined) Forecast, by Application 2020 & 2033
- Table 38: United Kingdom Satcom On The Move Antenna Volume (K) Forecast, by Application 2020 & 2033
- Table 39: Germany Satcom On The Move Antenna Revenue (undefined) Forecast, by Application 2020 & 2033
- Table 40: Germany Satcom On The Move Antenna Volume (K) Forecast, by Application 2020 & 2033
- Table 41: France Satcom On The Move Antenna Revenue (undefined) Forecast, by Application 2020 & 2033
- Table 42: France Satcom On The Move Antenna Volume (K) Forecast, by Application 2020 & 2033
- Table 43: Italy Satcom On The Move Antenna Revenue (undefined) Forecast, by Application 2020 & 2033
- Table 44: Italy Satcom On The Move Antenna Volume (K) Forecast, by Application 2020 & 2033
- Table 45: Spain Satcom On The Move Antenna Revenue (undefined) Forecast, by Application 2020 & 2033
- Table 46: Spain Satcom On The Move Antenna Volume (K) Forecast, by Application 2020 & 2033
- Table 47: Russia Satcom On The Move Antenna Revenue (undefined) Forecast, by Application 2020 & 2033
- Table 48: Russia Satcom On The Move Antenna Volume (K) Forecast, by Application 2020 & 2033
- Table 49: Benelux Satcom On The Move Antenna Revenue (undefined) Forecast, by Application 2020 & 2033
- Table 50: Benelux Satcom On The Move Antenna Volume (K) Forecast, by Application 2020 & 2033
- Table 51: Nordics Satcom On The Move Antenna Revenue (undefined) Forecast, by Application 2020 & 2033
- Table 52: Nordics Satcom On The Move Antenna Volume (K) Forecast, by Application 2020 & 2033
- Table 53: Rest of Europe Satcom On The Move Antenna Revenue (undefined) Forecast, by Application 2020 & 2033
- Table 54: Rest of Europe Satcom On The Move Antenna Volume (K) Forecast, by Application 2020 & 2033
- Table 55: Global Satcom On The Move Antenna Revenue undefined Forecast, by Application 2020 & 2033
- Table 56: Global Satcom On The Move Antenna Volume K Forecast, by Application 2020 & 2033
- Table 57: Global Satcom On The Move Antenna Revenue undefined Forecast, by Types 2020 & 2033
- Table 58: Global Satcom On The Move Antenna Volume K Forecast, by Types 2020 & 2033
- Table 59: Global Satcom On The Move Antenna Revenue undefined Forecast, by Country 2020 & 2033
- Table 60: Global Satcom On The Move Antenna Volume K Forecast, by Country 2020 & 2033
- Table 61: Turkey Satcom On The Move Antenna Revenue (undefined) Forecast, by Application 2020 & 2033
- Table 62: Turkey Satcom On The Move Antenna Volume (K) Forecast, by Application 2020 & 2033
- Table 63: Israel Satcom On The Move Antenna Revenue (undefined) Forecast, by Application 2020 & 2033
- Table 64: Israel Satcom On The Move Antenna Volume (K) Forecast, by Application 2020 & 2033
- Table 65: GCC Satcom On The Move Antenna Revenue (undefined) Forecast, by Application 2020 & 2033
- Table 66: GCC Satcom On The Move Antenna Volume (K) Forecast, by Application 2020 & 2033
- Table 67: North Africa Satcom On The Move Antenna Revenue (undefined) Forecast, by Application 2020 & 2033
- Table 68: North Africa Satcom On The Move Antenna Volume (K) Forecast, by Application 2020 & 2033
- Table 69: South Africa Satcom On The Move Antenna Revenue (undefined) Forecast, by Application 2020 & 2033
- Table 70: South Africa Satcom On The Move Antenna Volume (K) Forecast, by Application 2020 & 2033
- Table 71: Rest of Middle East & Africa Satcom On The Move Antenna Revenue (undefined) Forecast, by Application 2020 & 2033
- Table 72: Rest of Middle East & Africa Satcom On The Move Antenna Volume (K) Forecast, by Application 2020 & 2033
- Table 73: Global Satcom On The Move Antenna Revenue undefined Forecast, by Application 2020 & 2033
- Table 74: Global Satcom On The Move Antenna Volume K Forecast, by Application 2020 & 2033
- Table 75: Global Satcom On The Move Antenna Revenue undefined Forecast, by Types 2020 & 2033
- Table 76: Global Satcom On The Move Antenna Volume K Forecast, by Types 2020 & 2033
- Table 77: Global Satcom On The Move Antenna Revenue undefined Forecast, by Country 2020 & 2033
- Table 78: Global Satcom On The Move Antenna Volume K Forecast, by Country 2020 & 2033
- Table 79: China Satcom On The Move Antenna Revenue (undefined) Forecast, by Application 2020 & 2033
- Table 80: China Satcom On The Move Antenna Volume (K) Forecast, by Application 2020 & 2033
- Table 81: India Satcom On The Move Antenna Revenue (undefined) Forecast, by Application 2020 & 2033
- Table 82: India Satcom On The Move Antenna Volume (K) Forecast, by Application 2020 & 2033
- Table 83: Japan Satcom On The Move Antenna Revenue (undefined) Forecast, by Application 2020 & 2033
- Table 84: Japan Satcom On The Move Antenna Volume (K) Forecast, by Application 2020 & 2033
- Table 85: South Korea Satcom On The Move Antenna Revenue (undefined) Forecast, by Application 2020 & 2033
- Table 86: South Korea Satcom On The Move Antenna Volume (K) Forecast, by Application 2020 & 2033
- Table 87: ASEAN Satcom On The Move Antenna Revenue (undefined) Forecast, by Application 2020 & 2033
- Table 88: ASEAN Satcom On The Move Antenna Volume (K) Forecast, by Application 2020 & 2033
- Table 89: Oceania Satcom On The Move Antenna Revenue (undefined) Forecast, by Application 2020 & 2033
- Table 90: Oceania Satcom On The Move Antenna Volume (K) Forecast, by Application 2020 & 2033
- Table 91: Rest of Asia Pacific Satcom On The Move Antenna Revenue (undefined) Forecast, by Application 2020 & 2033
- Table 92: Rest of Asia Pacific Satcom On The Move Antenna Volume (K) Forecast, by Application 2020 & 2033
Frequently Asked Questions
1. What is the projected Compound Annual Growth Rate (CAGR) of the Satcom On The Move Antenna?
The projected CAGR is approximately 14.1%.
2. Which companies are prominent players in the Satcom On The Move Antenna?
Key companies in the market include Aselsan, BAE Systems, Ball Corporation, Cobham Satcom, Elbit Systems, General Dynamics, Gilat Satellite Networks, Honeywell, Hughes Network Systems, Indra Sistemas, Iridium Communications, L3Harris Technologies, Leonardo DRS, ND SatCom, Singapore Technologies Engineering, Thales, Viasat.
3. What are the main segments of the Satcom On The Move Antenna?
The market segments include Application, Types.
4. Can you provide details about the market size?
The market size is estimated to be USD XXX N/A as of 2022.
5. What are some drivers contributing to market growth?
N/A
6. What are the notable trends driving market growth?
N/A
7. Are there any restraints impacting market growth?
N/A
8. Can you provide examples of recent developments in the market?
N/A
9. What pricing options are available for accessing the report?
Pricing options include single-user, multi-user, and enterprise licenses priced at USD 3350.00, USD 5025.00, and USD 6700.00 respectively.
10. Is the market size provided in terms of value or volume?
The market size is provided in terms of value, measured in N/A and volume, measured in K.
11. Are there any specific market keywords associated with the report?
Yes, the market keyword associated with the report is "Satcom On The Move Antenna," which aids in identifying and referencing the specific market segment covered.
12. How do I determine which pricing option suits my needs best?
The pricing options vary based on user requirements and access needs. Individual users may opt for single-user licenses, while businesses requiring broader access may choose multi-user or enterprise licenses for cost-effective access to the report.
13. Are there any additional resources or data provided in the Satcom On The Move Antenna report?
While the report offers comprehensive insights, it's advisable to review the specific contents or supplementary materials provided to ascertain if additional resources or data are available.
14. How can I stay updated on further developments or reports in the Satcom On The Move Antenna?
To stay informed about further developments, trends, and reports in the Satcom On The Move Antenna, consider subscribing to industry newsletters, following relevant companies and organizations, or regularly checking reputable industry news sources and publications.
Methodology
Step 1 - Identification of Relevant Samples Size from Population Database


Step 2 - Approaches for Defining Global Market Size (Value, Volume* & Price*)

Note*: In applicable scenarios
Step 3 - Data Sources
Primary Research
- Web Analytics
- Survey Reports
- Research Institute
- Latest Research Reports
- Opinion Leaders
Secondary Research
- Annual Reports
- White Paper
- Latest Press Release
- Industry Association
- Paid Database
- Investor Presentations

Step 4 - Data Triangulation
Involves using different sources of information in order to increase the validity of a study
These sources are likely to be stakeholders in a program - participants, other researchers, program staff, other community members, and so on.
Then we put all data in single framework & apply various statistical tools to find out the dynamic on the market.
During the analysis stage, feedback from the stakeholder groups would be compared to determine areas of agreement as well as areas of divergence