
Key Insights
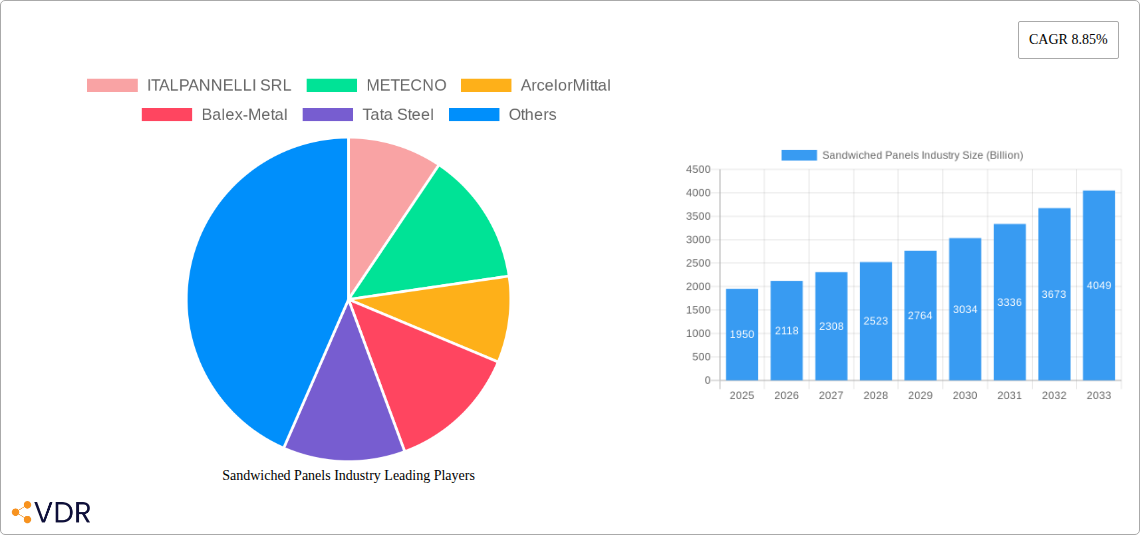
The global sandwiched panels market, valued at $1.95 billion in 2025, is projected to experience robust growth, driven by a compound annual growth rate (CAGR) of 8.85% from 2025 to 2033. This expansion is fueled by several key factors. The increasing demand for energy-efficient buildings in both residential and commercial sectors is a primary driver, as sandwiched panels offer superior insulation properties compared to traditional construction materials. Furthermore, the rising adoption of prefabricated and modular construction methods, which leverage the ease and speed of installation offered by sandwiched panels, is significantly contributing to market growth. Growth is also spurred by the construction boom in developing economies, particularly in Asia-Pacific, where infrastructure development projects and urbanization are creating substantial demand. The diverse application range of sandwiched panels, encompassing building walls, roofs, and cold storage facilities, further broadens market appeal. While material costs and potential supply chain disruptions pose challenges, technological advancements leading to lighter, stronger, and more sustainable panel options are expected to mitigate these restraints. The market segmentation, encompassing various core materials (EPS, PUR, PIR, glass wool) and skin materials (OSB, plywood, cement board), provides opportunities for specialized product development and catering to diverse project requirements.
The competitive landscape is characterized by a mix of established multinational corporations and regional players. Key players like Kingspan Group, Owens Corning, and ArcelorMittal are leveraging their technological expertise and established distribution networks to maintain market leadership. However, the market also presents opportunities for smaller players specializing in niche applications or regions. The ongoing focus on sustainability within the construction industry presents further growth avenues, with manufacturers increasingly emphasizing the use of recycled materials and eco-friendly production processes within sandwiched panel manufacturing. The forecast period (2025-2033) anticipates continued market expansion, driven by the aforementioned factors, though regional variations will likely exist due to differing construction trends and economic conditions. Specific regional growth will be influenced by factors like government regulations supporting green building initiatives and the overall economic health of those regions.
Sandwiched Panels Industry Market Report: 2019-2033
This comprehensive report provides an in-depth analysis of the global sandwiched panels industry, encompassing market dynamics, growth trends, regional segmentation, product landscape, key players, and future outlook. With a study period spanning 2019-2033, a base year of 2025, and a forecast period of 2025-2033, this report is an invaluable resource for industry professionals, investors, and strategic decision-makers. The total market size is projected to reach xx Billion by 2033.
Sandwiched Panels Industry Market Dynamics & Structure
The sandwiched panels market, valued at xx Billion in 2025, exhibits a moderately concentrated structure with key players like Kingspan Group and ArcelorMittal holding significant market share. Technological innovation, particularly in insulation materials and core technologies, is a key driver, alongside stringent building codes and energy efficiency regulations. The industry faces competition from alternative building materials like traditional brick and concrete, but sandwiched panels' superior insulation and faster installation times provide a competitive edge. The market witnesses continuous mergers and acquisitions (M&A) activity, with approximately xx M&A deals recorded between 2019 and 2024. End-user demographics are expanding, driven by increasing construction activity in both residential and commercial sectors globally.
- Market Concentration: Moderately concentrated, with top players holding xx% market share.
- Technological Innovation: Focus on improved insulation, lighter weight panels, and faster installation methods.
- Regulatory Framework: Stringent building codes and energy efficiency standards drive demand.
- Competitive Substitutes: Traditional building materials (brick, concrete) pose a competitive threat.
- M&A Activity: Approximately xx deals between 2019-2024, signifying consolidation.
- End-user Demographics: Growth driven by residential and commercial construction booms.
Sandwiched Panels Industry Growth Trends & Insights
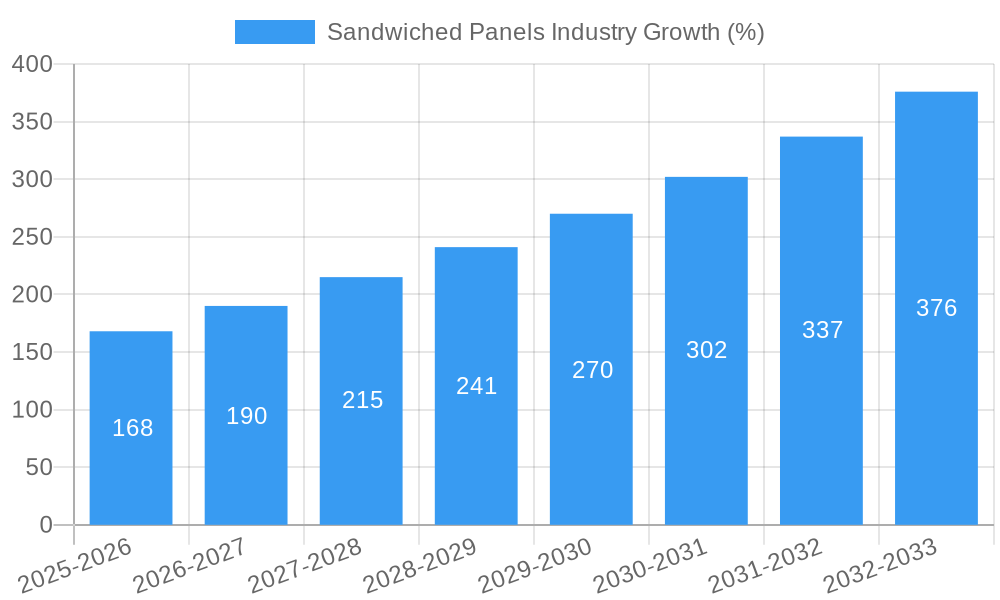
The global sandwiched panels market is experiencing robust growth, driven by factors such as increasing demand for energy-efficient buildings, rapid urbanization, and rising disposable incomes. The market size is projected to expand at a Compound Annual Growth Rate (CAGR) of xx% during the forecast period (2025-2033), reaching an estimated xx Billion by 2033. This growth is fueled by several key trends: a shift towards sustainable construction practices, technological advancements leading to improved panel performance, and increasing adoption in diverse applications like cold storage facilities. Consumer preferences are also evolving, with a greater emphasis on aesthetics, durability, and cost-effectiveness. The market penetration rate for sandwiched panels in the construction industry is expected to reach xx% by 2033. Technological disruptions, such as the introduction of innovative insulation materials and automated manufacturing processes, are further accelerating market expansion.
Dominant Regions, Countries, or Segments in Sandwiched Panels Industry
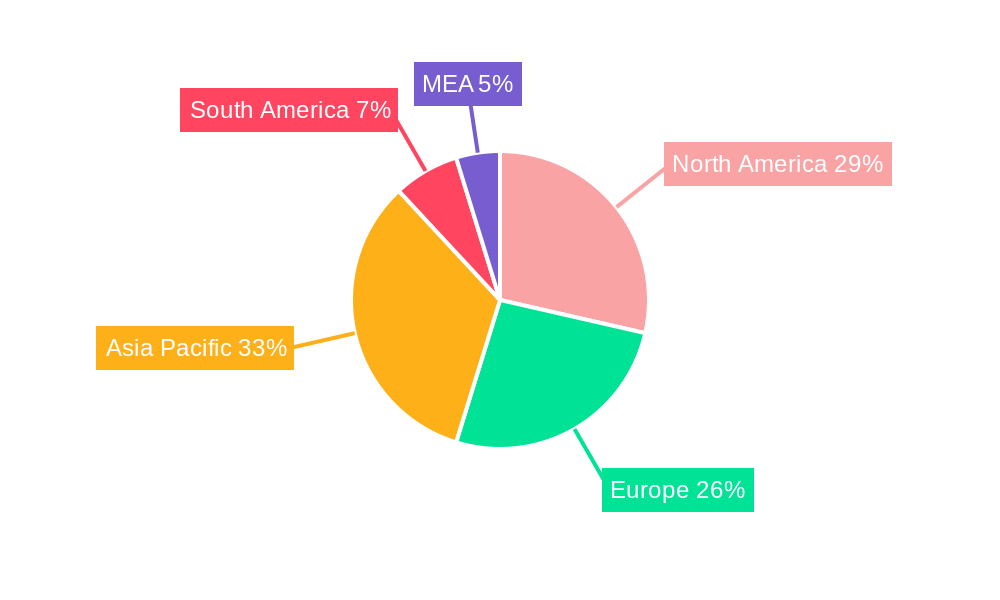
North America and Europe currently dominate the sandwiched panels market, driven by robust construction activity and stringent energy efficiency regulations. However, Asia-Pacific is poised for significant growth due to rapid urbanization and industrialization. Within product segments, EPS panels hold the largest market share due to their cost-effectiveness, while PUR/PIR panels are experiencing faster growth due to their superior insulation properties. In terms of skin materials, OSB is the most widely used due to its strength and cost-effectiveness. The building wall application dominates, but growth is also significant in building roofs and cold storage.
- Key Regional Drivers:
- North America: Stringent building codes and high adoption rates.
- Europe: Emphasis on sustainable construction and energy efficiency.
- Asia-Pacific: Rapid urbanization and industrialization driving demand.
- Key Segment Drivers:
- EPS Panels: Cost-effectiveness and wide availability.
- PUR/PIR Panels: Superior insulation properties driving growth.
- OSB Skin Material: Strength, cost-effectiveness, and widespread usage.
- Building Wall Application: Largest market share due to widespread use.
Sandwiched Panels Industry Product Landscape
The sandwiched panels market offers a diverse range of products, catering to various application needs and performance requirements. Innovations focus on enhancing insulation properties, improving structural integrity, and reducing weight. Advancements in insulation materials, such as vacuum insulated panels (VIPs), are leading to increased energy efficiency. Furthermore, the development of lighter and stronger core materials is improving the overall performance of the panels. The unique selling propositions (USPs) of sandwiched panels include superior insulation, rapid construction, and design flexibility.
Key Drivers, Barriers & Challenges in Sandwiched Panels Industry
Key Drivers: Stringent energy efficiency regulations, rising construction activity, growth of the cold storage sector, and advancements in insulation technology are driving market growth. Government incentives and subsidies for green building materials further stimulate adoption.
Key Challenges: Fluctuations in raw material prices, especially for polymers and insulation materials, pose a significant challenge. Supply chain disruptions, especially those related to core materials, can impact production and delivery. Intense competition from substitute materials and the need to overcome public perception regarding the longevity and durability of such panels present further hurdles. The impact of these challenges can translate to xx% reduction in annual market growth under certain circumstances.
Emerging Opportunities in Sandwiched Panels Industry
Emerging opportunities lie in expanding into untapped markets, particularly in developing economies with growing construction sectors. The development of innovative applications, such as prefabricated modular buildings and specialized panels for extreme climates, present significant potential. Evolving consumer preferences towards sustainable and energy-efficient building materials also create opportunities for eco-friendly panels.
Growth Accelerators in the Sandwiched Panels Industry
Technological breakthroughs in insulation materials, such as aerogel and vacuum insulation panels, offer significant growth potential. Strategic partnerships and collaborations among manufacturers, suppliers, and construction companies can optimize supply chains and improve product offerings. Market expansion strategies, focusing on developing economies and new application areas, are critical to long-term growth.
Key Players Shaping the Sandwiched Panels Industry Market
- ITALPANNELLI SRL
- METECNO
- ArcelorMittal
- Balex-Metal
- Tata Steel
- Rautaruukki Corporation
- Premium Building Systems
- Owens Corning
- Kingspan Group
- Multicolor Steels (India) Pvt Ltd
- Cornerstone Building Brands
- DANA Group of Companies
- Zamil Industrial Pre-Engineered Buildings Co Ltd
- Jiangsu Jingxue Insulation Technology Co Ltd
- Alubel SpA
- Nucor Building Systems
- Manni Group SpA
- PFB Corporation(Riverside)
Notable Milestones in Sandwiched Panels Industry Sector
- January 2022: Owens Corning introduced its FOAMGLAS Perinsul SIP, enhancing energy efficiency in high-performance buildings. This innovation significantly improves the insulation performance of sandwiched panels, driving further market growth.
- June 2022: Owens Corning's acquisition of WearDeck expands its product portfolio and expertise in weather-resistant decking and structural lumber, strengthening its market position and diversification.
In-Depth Sandwiched Panels Industry Market Outlook
The sandwiched panels market is poised for sustained growth, driven by technological advancements, increasing demand for energy-efficient buildings, and expansion into new markets. Strategic partnerships and innovations in sustainable materials will further fuel market expansion. The future holds significant opportunities for companies that can effectively leverage technological breakthroughs, address supply chain challenges, and adapt to evolving consumer preferences. The market is projected to exhibit a strong growth trajectory throughout the forecast period, driven by factors identified above, ultimately reaching xx Billion by 2033.
Sandwiched Panels Industry Segmentation
-
1. Product
- 1.1. EPS (Expanded Polystyrene) Panel
- 1.2. Rigid Po
- 1.3. Glass Wool Panel
- 1.4. Other Products (Extruded Polystyrene Foam)
-
2. Skin Material
- 2.1. Oriented Strand Board (OSB)
- 2.2. Plywood
- 2.3. Other Skin Materials (Cement Board)
-
3. Application
- 3.1. Building Wall
- 3.2. Building Roof
- 3.3. Cold Storage
Sandwiched Panels Industry Segmentation By Geography
-
1. Asia Pacific
- 1.1. China
- 1.2. India
- 1.3. Japan
- 1.4. South Korea
- 1.5. Rest of Asia Pacific
-
2. North America
- 2.1. United States
- 2.2. Canada
- 2.3. Mexico
- 2.4. Rest of North America
-
3. Europe
- 3.1. Germany
- 3.2. United Kingdom
- 3.3. Italy
- 3.4. France
- 3.5. Rest of Europe
-
4. South America
- 4.1. Brazil
- 4.2. Argentina
- 4.3. Rest of South America
-
5. Middle East and Africa
- 5.1. Saudi Arabia
- 5.2. South Africa
- 5.3. Rest of Middle East and Africa
Sandwiched Panels Industry REPORT HIGHLIGHTS
| Aspects | Details |
|---|---|
| Study Period | 2019-2033 |
| Base Year | 2024 |
| Estimated Year | 2025 |
| Forecast Period | 2025-2033 |
| Historical Period | 2019-2024 |
| Growth Rate | CAGR of 8.85% from 2019-2033 |
| Segmentation |
|
Table of Contents
- 1. Introduction
- 1.1. Research Scope
- 1.2. Market Segmentation
- 1.3. Research Methodology
- 1.4. Definitions and Assumptions
- 2. Executive Summary
- 2.1. Introduction
- 3. Market Dynamics
- 3.1. Introduction
- 3.2. Market Drivers
- 3.2.1. Increasing Demand from Construction Sector; Increasing Cold Storage Applications
- 3.3. Market Restrains
- 3.3.1 Advancements in Building Technologies
- 3.3.2 such as Modular Construction Techniques; Other Restraints
- 3.4. Market Trends
- 3.4.1. Increasing Demand from Building Walls
- 4. Market Factor Analysis
- 4.1. Porters Five Forces
- 4.2. Supply/Value Chain
- 4.3. PESTEL analysis
- 4.4. Market Entropy
- 4.5. Patent/Trademark Analysis
- 5. Global Sandwiched Panels Industry Analysis, Insights and Forecast, 2019-2031
- 5.1. Market Analysis, Insights and Forecast - by Product
- 5.1.1. EPS (Expanded Polystyrene) Panel
- 5.1.2. Rigid Po
- 5.1.3. Glass Wool Panel
- 5.1.4. Other Products (Extruded Polystyrene Foam)
- 5.2. Market Analysis, Insights and Forecast - by Skin Material
- 5.2.1. Oriented Strand Board (OSB)
- 5.2.2. Plywood
- 5.2.3. Other Skin Materials (Cement Board)
- 5.3. Market Analysis, Insights and Forecast - by Application
- 5.3.1. Building Wall
- 5.3.2. Building Roof
- 5.3.3. Cold Storage
- 5.4. Market Analysis, Insights and Forecast - by Region
- 5.4.1. Asia Pacific
- 5.4.2. North America
- 5.4.3. Europe
- 5.4.4. South America
- 5.4.5. Middle East and Africa
- 5.1. Market Analysis, Insights and Forecast - by Product
- 6. Asia Pacific Sandwiched Panels Industry Analysis, Insights and Forecast, 2019-2031
- 6.1. Market Analysis, Insights and Forecast - by Product
- 6.1.1. EPS (Expanded Polystyrene) Panel
- 6.1.2. Rigid Po
- 6.1.3. Glass Wool Panel
- 6.1.4. Other Products (Extruded Polystyrene Foam)
- 6.2. Market Analysis, Insights and Forecast - by Skin Material
- 6.2.1. Oriented Strand Board (OSB)
- 6.2.2. Plywood
- 6.2.3. Other Skin Materials (Cement Board)
- 6.3. Market Analysis, Insights and Forecast - by Application
- 6.3.1. Building Wall
- 6.3.2. Building Roof
- 6.3.3. Cold Storage
- 6.1. Market Analysis, Insights and Forecast - by Product
- 7. North America Sandwiched Panels Industry Analysis, Insights and Forecast, 2019-2031
- 7.1. Market Analysis, Insights and Forecast - by Product
- 7.1.1. EPS (Expanded Polystyrene) Panel
- 7.1.2. Rigid Po
- 7.1.3. Glass Wool Panel
- 7.1.4. Other Products (Extruded Polystyrene Foam)
- 7.2. Market Analysis, Insights and Forecast - by Skin Material
- 7.2.1. Oriented Strand Board (OSB)
- 7.2.2. Plywood
- 7.2.3. Other Skin Materials (Cement Board)
- 7.3. Market Analysis, Insights and Forecast - by Application
- 7.3.1. Building Wall
- 7.3.2. Building Roof
- 7.3.3. Cold Storage
- 7.1. Market Analysis, Insights and Forecast - by Product
- 8. Europe Sandwiched Panels Industry Analysis, Insights and Forecast, 2019-2031
- 8.1. Market Analysis, Insights and Forecast - by Product
- 8.1.1. EPS (Expanded Polystyrene) Panel
- 8.1.2. Rigid Po
- 8.1.3. Glass Wool Panel
- 8.1.4. Other Products (Extruded Polystyrene Foam)
- 8.2. Market Analysis, Insights and Forecast - by Skin Material
- 8.2.1. Oriented Strand Board (OSB)
- 8.2.2. Plywood
- 8.2.3. Other Skin Materials (Cement Board)
- 8.3. Market Analysis, Insights and Forecast - by Application
- 8.3.1. Building Wall
- 8.3.2. Building Roof
- 8.3.3. Cold Storage
- 8.1. Market Analysis, Insights and Forecast - by Product
- 9. South America Sandwiched Panels Industry Analysis, Insights and Forecast, 2019-2031
- 9.1. Market Analysis, Insights and Forecast - by Product
- 9.1.1. EPS (Expanded Polystyrene) Panel
- 9.1.2. Rigid Po
- 9.1.3. Glass Wool Panel
- 9.1.4. Other Products (Extruded Polystyrene Foam)
- 9.2. Market Analysis, Insights and Forecast - by Skin Material
- 9.2.1. Oriented Strand Board (OSB)
- 9.2.2. Plywood
- 9.2.3. Other Skin Materials (Cement Board)
- 9.3. Market Analysis, Insights and Forecast - by Application
- 9.3.1. Building Wall
- 9.3.2. Building Roof
- 9.3.3. Cold Storage
- 9.1. Market Analysis, Insights and Forecast - by Product
- 10. Middle East and Africa Sandwiched Panels Industry Analysis, Insights and Forecast, 2019-2031
- 10.1. Market Analysis, Insights and Forecast - by Product
- 10.1.1. EPS (Expanded Polystyrene) Panel
- 10.1.2. Rigid Po
- 10.1.3. Glass Wool Panel
- 10.1.4. Other Products (Extruded Polystyrene Foam)
- 10.2. Market Analysis, Insights and Forecast - by Skin Material
- 10.2.1. Oriented Strand Board (OSB)
- 10.2.2. Plywood
- 10.2.3. Other Skin Materials (Cement Board)
- 10.3. Market Analysis, Insights and Forecast - by Application
- 10.3.1. Building Wall
- 10.3.2. Building Roof
- 10.3.3. Cold Storage
- 10.1. Market Analysis, Insights and Forecast - by Product
- 11. North America Sandwiched Panels Industry Analysis, Insights and Forecast, 2019-2031
- 11.1. Market Analysis, Insights and Forecast - By Country/Sub-region
- 11.1.1 United States
- 11.1.2 Canada
- 11.1.3 Mexic
- 12. Europe Sandwiched Panels Industry Analysis, Insights and Forecast, 2019-2031
- 12.1. Market Analysis, Insights and Forecast - By Country/Sub-region
- 12.1.1 Germany
- 12.1.2 France
- 12.1.3 Italy
- 12.1.4 United Kingdom
- 12.1.5 Netherlands
- 12.1.6 Rest of Europe
- 13. Asia Pacific Sandwiched Panels Industry Analysis, Insights and Forecast, 2019-2031
- 13.1. Market Analysis, Insights and Forecast - By Country/Sub-region
- 13.1.1 China
- 13.1.2 Japan
- 13.1.3 India
- 13.1.4 South Korea
- 13.1.5 Taiwan
- 13.1.6 Australia
- 13.1.7 Rest of Asia-Pacific
- 14. South America Sandwiched Panels Industry Analysis, Insights and Forecast, 2019-2031
- 14.1. Market Analysis, Insights and Forecast - By Country/Sub-region
- 14.1.1 Brazil
- 14.1.2 Argentina
- 14.1.3 Rest of South America
- 15. MEA Sandwiched Panels Industry Analysis, Insights and Forecast, 2019-2031
- 15.1. Market Analysis, Insights and Forecast - By Country/Sub-region
- 15.1.1 Middle East
- 15.1.2 Africa
- 16. Competitive Analysis
- 16.1. Global Market Share Analysis 2024
- 16.2. Company Profiles
- 16.2.1 ITALPANNELLI SRL
- 16.2.1.1. Overview
- 16.2.1.2. Products
- 16.2.1.3. SWOT Analysis
- 16.2.1.4. Recent Developments
- 16.2.1.5. Financials (Based on Availability)
- 16.2.2 METECNO
- 16.2.2.1. Overview
- 16.2.2.2. Products
- 16.2.2.3. SWOT Analysis
- 16.2.2.4. Recent Developments
- 16.2.2.5. Financials (Based on Availability)
- 16.2.3 ArcelorMittal
- 16.2.3.1. Overview
- 16.2.3.2. Products
- 16.2.3.3. SWOT Analysis
- 16.2.3.4. Recent Developments
- 16.2.3.5. Financials (Based on Availability)
- 16.2.4 Balex-Metal
- 16.2.4.1. Overview
- 16.2.4.2. Products
- 16.2.4.3. SWOT Analysis
- 16.2.4.4. Recent Developments
- 16.2.4.5. Financials (Based on Availability)
- 16.2.5 Tata Steel
- 16.2.5.1. Overview
- 16.2.5.2. Products
- 16.2.5.3. SWOT Analysis
- 16.2.5.4. Recent Developments
- 16.2.5.5. Financials (Based on Availability)
- 16.2.6 Rautaruukki Corporation
- 16.2.6.1. Overview
- 16.2.6.2. Products
- 16.2.6.3. SWOT Analysis
- 16.2.6.4. Recent Developments
- 16.2.6.5. Financials (Based on Availability)
- 16.2.7 Premium Building Systems
- 16.2.7.1. Overview
- 16.2.7.2. Products
- 16.2.7.3. SWOT Analysis
- 16.2.7.4. Recent Developments
- 16.2.7.5. Financials (Based on Availability)
- 16.2.8 Owens Corning
- 16.2.8.1. Overview
- 16.2.8.2. Products
- 16.2.8.3. SWOT Analysis
- 16.2.8.4. Recent Developments
- 16.2.8.5. Financials (Based on Availability)
- 16.2.9 Kingspan Group
- 16.2.9.1. Overview
- 16.2.9.2. Products
- 16.2.9.3. SWOT Analysis
- 16.2.9.4. Recent Developments
- 16.2.9.5. Financials (Based on Availability)
- 16.2.10 Multicolor Steels (India) Pvt Ltd
- 16.2.10.1. Overview
- 16.2.10.2. Products
- 16.2.10.3. SWOT Analysis
- 16.2.10.4. Recent Developments
- 16.2.10.5. Financials (Based on Availability)
- 16.2.11 Cornerstone Building Brands
- 16.2.11.1. Overview
- 16.2.11.2. Products
- 16.2.11.3. SWOT Analysis
- 16.2.11.4. Recent Developments
- 16.2.11.5. Financials (Based on Availability)
- 16.2.12 DANA Group of Companies
- 16.2.12.1. Overview
- 16.2.12.2. Products
- 16.2.12.3. SWOT Analysis
- 16.2.12.4. Recent Developments
- 16.2.12.5. Financials (Based on Availability)
- 16.2.13 Zamil Industrial Pre-Engineered Buildings Co Ltd
- 16.2.13.1. Overview
- 16.2.13.2. Products
- 16.2.13.3. SWOT Analysis
- 16.2.13.4. Recent Developments
- 16.2.13.5. Financials (Based on Availability)
- 16.2.14 Jiangsu Jingxue Insulation Technology Co Ltd
- 16.2.14.1. Overview
- 16.2.14.2. Products
- 16.2.14.3. SWOT Analysis
- 16.2.14.4. Recent Developments
- 16.2.14.5. Financials (Based on Availability)
- 16.2.15 Alubel SpA
- 16.2.15.1. Overview
- 16.2.15.2. Products
- 16.2.15.3. SWOT Analysis
- 16.2.15.4. Recent Developments
- 16.2.15.5. Financials (Based on Availability)
- 16.2.16 Nucor Building Systems
- 16.2.16.1. Overview
- 16.2.16.2. Products
- 16.2.16.3. SWOT Analysis
- 16.2.16.4. Recent Developments
- 16.2.16.5. Financials (Based on Availability)
- 16.2.17 Manni Group SpA
- 16.2.17.1. Overview
- 16.2.17.2. Products
- 16.2.17.3. SWOT Analysis
- 16.2.17.4. Recent Developments
- 16.2.17.5. Financials (Based on Availability)
- 16.2.18 PFB Corporation(Riverside)
- 16.2.18.1. Overview
- 16.2.18.2. Products
- 16.2.18.3. SWOT Analysis
- 16.2.18.4. Recent Developments
- 16.2.18.5. Financials (Based on Availability)
- 16.2.1 ITALPANNELLI SRL
List of Figures
- Figure 1: Global Sandwiched Panels Industry Revenue Breakdown (Billion, %) by Region 2024 & 2032
- Figure 2: Global Sandwiched Panels Industry Volume Breakdown (Square Meters, %) by Region 2024 & 2032
- Figure 3: North America Sandwiched Panels Industry Revenue (Billion), by Country 2024 & 2032
- Figure 4: North America Sandwiched Panels Industry Volume (Square Meters), by Country 2024 & 2032
- Figure 5: North America Sandwiched Panels Industry Revenue Share (%), by Country 2024 & 2032
- Figure 6: North America Sandwiched Panels Industry Volume Share (%), by Country 2024 & 2032
- Figure 7: Europe Sandwiched Panels Industry Revenue (Billion), by Country 2024 & 2032
- Figure 8: Europe Sandwiched Panels Industry Volume (Square Meters), by Country 2024 & 2032
- Figure 9: Europe Sandwiched Panels Industry Revenue Share (%), by Country 2024 & 2032
- Figure 10: Europe Sandwiched Panels Industry Volume Share (%), by Country 2024 & 2032
- Figure 11: Asia Pacific Sandwiched Panels Industry Revenue (Billion), by Country 2024 & 2032
- Figure 12: Asia Pacific Sandwiched Panels Industry Volume (Square Meters), by Country 2024 & 2032
- Figure 13: Asia Pacific Sandwiched Panels Industry Revenue Share (%), by Country 2024 & 2032
- Figure 14: Asia Pacific Sandwiched Panels Industry Volume Share (%), by Country 2024 & 2032
- Figure 15: South America Sandwiched Panels Industry Revenue (Billion), by Country 2024 & 2032
- Figure 16: South America Sandwiched Panels Industry Volume (Square Meters), by Country 2024 & 2032
- Figure 17: South America Sandwiched Panels Industry Revenue Share (%), by Country 2024 & 2032
- Figure 18: South America Sandwiched Panels Industry Volume Share (%), by Country 2024 & 2032
- Figure 19: MEA Sandwiched Panels Industry Revenue (Billion), by Country 2024 & 2032
- Figure 20: MEA Sandwiched Panels Industry Volume (Square Meters), by Country 2024 & 2032
- Figure 21: MEA Sandwiched Panels Industry Revenue Share (%), by Country 2024 & 2032
- Figure 22: MEA Sandwiched Panels Industry Volume Share (%), by Country 2024 & 2032
- Figure 23: Asia Pacific Sandwiched Panels Industry Revenue (Billion), by Product 2024 & 2032
- Figure 24: Asia Pacific Sandwiched Panels Industry Volume (Square Meters), by Product 2024 & 2032
- Figure 25: Asia Pacific Sandwiched Panels Industry Revenue Share (%), by Product 2024 & 2032
- Figure 26: Asia Pacific Sandwiched Panels Industry Volume Share (%), by Product 2024 & 2032
- Figure 27: Asia Pacific Sandwiched Panels Industry Revenue (Billion), by Skin Material 2024 & 2032
- Figure 28: Asia Pacific Sandwiched Panels Industry Volume (Square Meters), by Skin Material 2024 & 2032
- Figure 29: Asia Pacific Sandwiched Panels Industry Revenue Share (%), by Skin Material 2024 & 2032
- Figure 30: Asia Pacific Sandwiched Panels Industry Volume Share (%), by Skin Material 2024 & 2032
- Figure 31: Asia Pacific Sandwiched Panels Industry Revenue (Billion), by Application 2024 & 2032
- Figure 32: Asia Pacific Sandwiched Panels Industry Volume (Square Meters), by Application 2024 & 2032
- Figure 33: Asia Pacific Sandwiched Panels Industry Revenue Share (%), by Application 2024 & 2032
- Figure 34: Asia Pacific Sandwiched Panels Industry Volume Share (%), by Application 2024 & 2032
- Figure 35: Asia Pacific Sandwiched Panels Industry Revenue (Billion), by Country 2024 & 2032
- Figure 36: Asia Pacific Sandwiched Panels Industry Volume (Square Meters), by Country 2024 & 2032
- Figure 37: Asia Pacific Sandwiched Panels Industry Revenue Share (%), by Country 2024 & 2032
- Figure 38: Asia Pacific Sandwiched Panels Industry Volume Share (%), by Country 2024 & 2032
- Figure 39: North America Sandwiched Panels Industry Revenue (Billion), by Product 2024 & 2032
- Figure 40: North America Sandwiched Panels Industry Volume (Square Meters), by Product 2024 & 2032
- Figure 41: North America Sandwiched Panels Industry Revenue Share (%), by Product 2024 & 2032
- Figure 42: North America Sandwiched Panels Industry Volume Share (%), by Product 2024 & 2032
- Figure 43: North America Sandwiched Panels Industry Revenue (Billion), by Skin Material 2024 & 2032
- Figure 44: North America Sandwiched Panels Industry Volume (Square Meters), by Skin Material 2024 & 2032
- Figure 45: North America Sandwiched Panels Industry Revenue Share (%), by Skin Material 2024 & 2032
- Figure 46: North America Sandwiched Panels Industry Volume Share (%), by Skin Material 2024 & 2032
- Figure 47: North America Sandwiched Panels Industry Revenue (Billion), by Application 2024 & 2032
- Figure 48: North America Sandwiched Panels Industry Volume (Square Meters), by Application 2024 & 2032
- Figure 49: North America Sandwiched Panels Industry Revenue Share (%), by Application 2024 & 2032
- Figure 50: North America Sandwiched Panels Industry Volume Share (%), by Application 2024 & 2032
- Figure 51: North America Sandwiched Panels Industry Revenue (Billion), by Country 2024 & 2032
- Figure 52: North America Sandwiched Panels Industry Volume (Square Meters), by Country 2024 & 2032
- Figure 53: North America Sandwiched Panels Industry Revenue Share (%), by Country 2024 & 2032
- Figure 54: North America Sandwiched Panels Industry Volume Share (%), by Country 2024 & 2032
- Figure 55: Europe Sandwiched Panels Industry Revenue (Billion), by Product 2024 & 2032
- Figure 56: Europe Sandwiched Panels Industry Volume (Square Meters), by Product 2024 & 2032
- Figure 57: Europe Sandwiched Panels Industry Revenue Share (%), by Product 2024 & 2032
- Figure 58: Europe Sandwiched Panels Industry Volume Share (%), by Product 2024 & 2032
- Figure 59: Europe Sandwiched Panels Industry Revenue (Billion), by Skin Material 2024 & 2032
- Figure 60: Europe Sandwiched Panels Industry Volume (Square Meters), by Skin Material 2024 & 2032
- Figure 61: Europe Sandwiched Panels Industry Revenue Share (%), by Skin Material 2024 & 2032
- Figure 62: Europe Sandwiched Panels Industry Volume Share (%), by Skin Material 2024 & 2032
- Figure 63: Europe Sandwiched Panels Industry Revenue (Billion), by Application 2024 & 2032
- Figure 64: Europe Sandwiched Panels Industry Volume (Square Meters), by Application 2024 & 2032
- Figure 65: Europe Sandwiched Panels Industry Revenue Share (%), by Application 2024 & 2032
- Figure 66: Europe Sandwiched Panels Industry Volume Share (%), by Application 2024 & 2032
- Figure 67: Europe Sandwiched Panels Industry Revenue (Billion), by Country 2024 & 2032
- Figure 68: Europe Sandwiched Panels Industry Volume (Square Meters), by Country 2024 & 2032
- Figure 69: Europe Sandwiched Panels Industry Revenue Share (%), by Country 2024 & 2032
- Figure 70: Europe Sandwiched Panels Industry Volume Share (%), by Country 2024 & 2032
- Figure 71: South America Sandwiched Panels Industry Revenue (Billion), by Product 2024 & 2032
- Figure 72: South America Sandwiched Panels Industry Volume (Square Meters), by Product 2024 & 2032
- Figure 73: South America Sandwiched Panels Industry Revenue Share (%), by Product 2024 & 2032
- Figure 74: South America Sandwiched Panels Industry Volume Share (%), by Product 2024 & 2032
- Figure 75: South America Sandwiched Panels Industry Revenue (Billion), by Skin Material 2024 & 2032
- Figure 76: South America Sandwiched Panels Industry Volume (Square Meters), by Skin Material 2024 & 2032
- Figure 77: South America Sandwiched Panels Industry Revenue Share (%), by Skin Material 2024 & 2032
- Figure 78: South America Sandwiched Panels Industry Volume Share (%), by Skin Material 2024 & 2032
- Figure 79: South America Sandwiched Panels Industry Revenue (Billion), by Application 2024 & 2032
- Figure 80: South America Sandwiched Panels Industry Volume (Square Meters), by Application 2024 & 2032
- Figure 81: South America Sandwiched Panels Industry Revenue Share (%), by Application 2024 & 2032
- Figure 82: South America Sandwiched Panels Industry Volume Share (%), by Application 2024 & 2032
- Figure 83: South America Sandwiched Panels Industry Revenue (Billion), by Country 2024 & 2032
- Figure 84: South America Sandwiched Panels Industry Volume (Square Meters), by Country 2024 & 2032
- Figure 85: South America Sandwiched Panels Industry Revenue Share (%), by Country 2024 & 2032
- Figure 86: South America Sandwiched Panels Industry Volume Share (%), by Country 2024 & 2032
- Figure 87: Middle East and Africa Sandwiched Panels Industry Revenue (Billion), by Product 2024 & 2032
- Figure 88: Middle East and Africa Sandwiched Panels Industry Volume (Square Meters), by Product 2024 & 2032
- Figure 89: Middle East and Africa Sandwiched Panels Industry Revenue Share (%), by Product 2024 & 2032
- Figure 90: Middle East and Africa Sandwiched Panels Industry Volume Share (%), by Product 2024 & 2032
- Figure 91: Middle East and Africa Sandwiched Panels Industry Revenue (Billion), by Skin Material 2024 & 2032
- Figure 92: Middle East and Africa Sandwiched Panels Industry Volume (Square Meters), by Skin Material 2024 & 2032
- Figure 93: Middle East and Africa Sandwiched Panels Industry Revenue Share (%), by Skin Material 2024 & 2032
- Figure 94: Middle East and Africa Sandwiched Panels Industry Volume Share (%), by Skin Material 2024 & 2032
- Figure 95: Middle East and Africa Sandwiched Panels Industry Revenue (Billion), by Application 2024 & 2032
- Figure 96: Middle East and Africa Sandwiched Panels Industry Volume (Square Meters), by Application 2024 & 2032
- Figure 97: Middle East and Africa Sandwiched Panels Industry Revenue Share (%), by Application 2024 & 2032
- Figure 98: Middle East and Africa Sandwiched Panels Industry Volume Share (%), by Application 2024 & 2032
- Figure 99: Middle East and Africa Sandwiched Panels Industry Revenue (Billion), by Country 2024 & 2032
- Figure 100: Middle East and Africa Sandwiched Panels Industry Volume (Square Meters), by Country 2024 & 2032
- Figure 101: Middle East and Africa Sandwiched Panels Industry Revenue Share (%), by Country 2024 & 2032
- Figure 102: Middle East and Africa Sandwiched Panels Industry Volume Share (%), by Country 2024 & 2032
List of Tables
- Table 1: Global Sandwiched Panels Industry Revenue Billion Forecast, by Region 2019 & 2032
- Table 2: Global Sandwiched Panels Industry Volume Square Meters Forecast, by Region 2019 & 2032
- Table 3: Global Sandwiched Panels Industry Revenue Billion Forecast, by Product 2019 & 2032
- Table 4: Global Sandwiched Panels Industry Volume Square Meters Forecast, by Product 2019 & 2032
- Table 5: Global Sandwiched Panels Industry Revenue Billion Forecast, by Skin Material 2019 & 2032
- Table 6: Global Sandwiched Panels Industry Volume Square Meters Forecast, by Skin Material 2019 & 2032
- Table 7: Global Sandwiched Panels Industry Revenue Billion Forecast, by Application 2019 & 2032
- Table 8: Global Sandwiched Panels Industry Volume Square Meters Forecast, by Application 2019 & 2032
- Table 9: Global Sandwiched Panels Industry Revenue Billion Forecast, by Region 2019 & 2032
- Table 10: Global Sandwiched Panels Industry Volume Square Meters Forecast, by Region 2019 & 2032
- Table 11: Global Sandwiched Panels Industry Revenue Billion Forecast, by Country 2019 & 2032
- Table 12: Global Sandwiched Panels Industry Volume Square Meters Forecast, by Country 2019 & 2032
- Table 13: United States Sandwiched Panels Industry Revenue (Billion) Forecast, by Application 2019 & 2032
- Table 14: United States Sandwiched Panels Industry Volume (Square Meters) Forecast, by Application 2019 & 2032
- Table 15: Canada Sandwiched Panels Industry Revenue (Billion) Forecast, by Application 2019 & 2032
- Table 16: Canada Sandwiched Panels Industry Volume (Square Meters) Forecast, by Application 2019 & 2032
- Table 17: Mexic Sandwiched Panels Industry Revenue (Billion) Forecast, by Application 2019 & 2032
- Table 18: Mexic Sandwiched Panels Industry Volume (Square Meters) Forecast, by Application 2019 & 2032
- Table 19: Global Sandwiched Panels Industry Revenue Billion Forecast, by Country 2019 & 2032
- Table 20: Global Sandwiched Panels Industry Volume Square Meters Forecast, by Country 2019 & 2032
- Table 21: Germany Sandwiched Panels Industry Revenue (Billion) Forecast, by Application 2019 & 2032
- Table 22: Germany Sandwiched Panels Industry Volume (Square Meters) Forecast, by Application 2019 & 2032
- Table 23: France Sandwiched Panels Industry Revenue (Billion) Forecast, by Application 2019 & 2032
- Table 24: France Sandwiched Panels Industry Volume (Square Meters) Forecast, by Application 2019 & 2032
- Table 25: Italy Sandwiched Panels Industry Revenue (Billion) Forecast, by Application 2019 & 2032
- Table 26: Italy Sandwiched Panels Industry Volume (Square Meters) Forecast, by Application 2019 & 2032
- Table 27: United Kingdom Sandwiched Panels Industry Revenue (Billion) Forecast, by Application 2019 & 2032
- Table 28: United Kingdom Sandwiched Panels Industry Volume (Square Meters) Forecast, by Application 2019 & 2032
- Table 29: Netherlands Sandwiched Panels Industry Revenue (Billion) Forecast, by Application 2019 & 2032
- Table 30: Netherlands Sandwiched Panels Industry Volume (Square Meters) Forecast, by Application 2019 & 2032
- Table 31: Rest of Europe Sandwiched Panels Industry Revenue (Billion) Forecast, by Application 2019 & 2032
- Table 32: Rest of Europe Sandwiched Panels Industry Volume (Square Meters) Forecast, by Application 2019 & 2032
- Table 33: Global Sandwiched Panels Industry Revenue Billion Forecast, by Country 2019 & 2032
- Table 34: Global Sandwiched Panels Industry Volume Square Meters Forecast, by Country 2019 & 2032
- Table 35: China Sandwiched Panels Industry Revenue (Billion) Forecast, by Application 2019 & 2032
- Table 36: China Sandwiched Panels Industry Volume (Square Meters) Forecast, by Application 2019 & 2032
- Table 37: Japan Sandwiched Panels Industry Revenue (Billion) Forecast, by Application 2019 & 2032
- Table 38: Japan Sandwiched Panels Industry Volume (Square Meters) Forecast, by Application 2019 & 2032
- Table 39: India Sandwiched Panels Industry Revenue (Billion) Forecast, by Application 2019 & 2032
- Table 40: India Sandwiched Panels Industry Volume (Square Meters) Forecast, by Application 2019 & 2032
- Table 41: South Korea Sandwiched Panels Industry Revenue (Billion) Forecast, by Application 2019 & 2032
- Table 42: South Korea Sandwiched Panels Industry Volume (Square Meters) Forecast, by Application 2019 & 2032
- Table 43: Taiwan Sandwiched Panels Industry Revenue (Billion) Forecast, by Application 2019 & 2032
- Table 44: Taiwan Sandwiched Panels Industry Volume (Square Meters) Forecast, by Application 2019 & 2032
- Table 45: Australia Sandwiched Panels Industry Revenue (Billion) Forecast, by Application 2019 & 2032
- Table 46: Australia Sandwiched Panels Industry Volume (Square Meters) Forecast, by Application 2019 & 2032
- Table 47: Rest of Asia-Pacific Sandwiched Panels Industry Revenue (Billion) Forecast, by Application 2019 & 2032
- Table 48: Rest of Asia-Pacific Sandwiched Panels Industry Volume (Square Meters) Forecast, by Application 2019 & 2032
- Table 49: Global Sandwiched Panels Industry Revenue Billion Forecast, by Country 2019 & 2032
- Table 50: Global Sandwiched Panels Industry Volume Square Meters Forecast, by Country 2019 & 2032
- Table 51: Brazil Sandwiched Panels Industry Revenue (Billion) Forecast, by Application 2019 & 2032
- Table 52: Brazil Sandwiched Panels Industry Volume (Square Meters) Forecast, by Application 2019 & 2032
- Table 53: Argentina Sandwiched Panels Industry Revenue (Billion) Forecast, by Application 2019 & 2032
- Table 54: Argentina Sandwiched Panels Industry Volume (Square Meters) Forecast, by Application 2019 & 2032
- Table 55: Rest of South America Sandwiched Panels Industry Revenue (Billion) Forecast, by Application 2019 & 2032
- Table 56: Rest of South America Sandwiched Panels Industry Volume (Square Meters) Forecast, by Application 2019 & 2032
- Table 57: Global Sandwiched Panels Industry Revenue Billion Forecast, by Country 2019 & 2032
- Table 58: Global Sandwiched Panels Industry Volume Square Meters Forecast, by Country 2019 & 2032
- Table 59: Middle East Sandwiched Panels Industry Revenue (Billion) Forecast, by Application 2019 & 2032
- Table 60: Middle East Sandwiched Panels Industry Volume (Square Meters) Forecast, by Application 2019 & 2032
- Table 61: Africa Sandwiched Panels Industry Revenue (Billion) Forecast, by Application 2019 & 2032
- Table 62: Africa Sandwiched Panels Industry Volume (Square Meters) Forecast, by Application 2019 & 2032
- Table 63: Global Sandwiched Panels Industry Revenue Billion Forecast, by Product 2019 & 2032
- Table 64: Global Sandwiched Panels Industry Volume Square Meters Forecast, by Product 2019 & 2032
- Table 65: Global Sandwiched Panels Industry Revenue Billion Forecast, by Skin Material 2019 & 2032
- Table 66: Global Sandwiched Panels Industry Volume Square Meters Forecast, by Skin Material 2019 & 2032
- Table 67: Global Sandwiched Panels Industry Revenue Billion Forecast, by Application 2019 & 2032
- Table 68: Global Sandwiched Panels Industry Volume Square Meters Forecast, by Application 2019 & 2032
- Table 69: Global Sandwiched Panels Industry Revenue Billion Forecast, by Country 2019 & 2032
- Table 70: Global Sandwiched Panels Industry Volume Square Meters Forecast, by Country 2019 & 2032
- Table 71: China Sandwiched Panels Industry Revenue (Billion) Forecast, by Application 2019 & 2032
- Table 72: China Sandwiched Panels Industry Volume (Square Meters) Forecast, by Application 2019 & 2032
- Table 73: India Sandwiched Panels Industry Revenue (Billion) Forecast, by Application 2019 & 2032
- Table 74: India Sandwiched Panels Industry Volume (Square Meters) Forecast, by Application 2019 & 2032
- Table 75: Japan Sandwiched Panels Industry Revenue (Billion) Forecast, by Application 2019 & 2032
- Table 76: Japan Sandwiched Panels Industry Volume (Square Meters) Forecast, by Application 2019 & 2032
- Table 77: South Korea Sandwiched Panels Industry Revenue (Billion) Forecast, by Application 2019 & 2032
- Table 78: South Korea Sandwiched Panels Industry Volume (Square Meters) Forecast, by Application 2019 & 2032
- Table 79: Rest of Asia Pacific Sandwiched Panels Industry Revenue (Billion) Forecast, by Application 2019 & 2032
- Table 80: Rest of Asia Pacific Sandwiched Panels Industry Volume (Square Meters) Forecast, by Application 2019 & 2032
- Table 81: Global Sandwiched Panels Industry Revenue Billion Forecast, by Product 2019 & 2032
- Table 82: Global Sandwiched Panels Industry Volume Square Meters Forecast, by Product 2019 & 2032
- Table 83: Global Sandwiched Panels Industry Revenue Billion Forecast, by Skin Material 2019 & 2032
- Table 84: Global Sandwiched Panels Industry Volume Square Meters Forecast, by Skin Material 2019 & 2032
- Table 85: Global Sandwiched Panels Industry Revenue Billion Forecast, by Application 2019 & 2032
- Table 86: Global Sandwiched Panels Industry Volume Square Meters Forecast, by Application 2019 & 2032
- Table 87: Global Sandwiched Panels Industry Revenue Billion Forecast, by Country 2019 & 2032
- Table 88: Global Sandwiched Panels Industry Volume Square Meters Forecast, by Country 2019 & 2032
- Table 89: United States Sandwiched Panels Industry Revenue (Billion) Forecast, by Application 2019 & 2032
- Table 90: United States Sandwiched Panels Industry Volume (Square Meters) Forecast, by Application 2019 & 2032
- Table 91: Canada Sandwiched Panels Industry Revenue (Billion) Forecast, by Application 2019 & 2032
- Table 92: Canada Sandwiched Panels Industry Volume (Square Meters) Forecast, by Application 2019 & 2032
- Table 93: Mexico Sandwiched Panels Industry Revenue (Billion) Forecast, by Application 2019 & 2032
- Table 94: Mexico Sandwiched Panels Industry Volume (Square Meters) Forecast, by Application 2019 & 2032
- Table 95: Rest of North America Sandwiched Panels Industry Revenue (Billion) Forecast, by Application 2019 & 2032
- Table 96: Rest of North America Sandwiched Panels Industry Volume (Square Meters) Forecast, by Application 2019 & 2032
- Table 97: Global Sandwiched Panels Industry Revenue Billion Forecast, by Product 2019 & 2032
- Table 98: Global Sandwiched Panels Industry Volume Square Meters Forecast, by Product 2019 & 2032
- Table 99: Global Sandwiched Panels Industry Revenue Billion Forecast, by Skin Material 2019 & 2032
- Table 100: Global Sandwiched Panels Industry Volume Square Meters Forecast, by Skin Material 2019 & 2032
- Table 101: Global Sandwiched Panels Industry Revenue Billion Forecast, by Application 2019 & 2032
- Table 102: Global Sandwiched Panels Industry Volume Square Meters Forecast, by Application 2019 & 2032
- Table 103: Global Sandwiched Panels Industry Revenue Billion Forecast, by Country 2019 & 2032
- Table 104: Global Sandwiched Panels Industry Volume Square Meters Forecast, by Country 2019 & 2032
- Table 105: Germany Sandwiched Panels Industry Revenue (Billion) Forecast, by Application 2019 & 2032
- Table 106: Germany Sandwiched Panels Industry Volume (Square Meters) Forecast, by Application 2019 & 2032
- Table 107: United Kingdom Sandwiched Panels Industry Revenue (Billion) Forecast, by Application 2019 & 2032
- Table 108: United Kingdom Sandwiched Panels Industry Volume (Square Meters) Forecast, by Application 2019 & 2032
- Table 109: Italy Sandwiched Panels Industry Revenue (Billion) Forecast, by Application 2019 & 2032
- Table 110: Italy Sandwiched Panels Industry Volume (Square Meters) Forecast, by Application 2019 & 2032
- Table 111: France Sandwiched Panels Industry Revenue (Billion) Forecast, by Application 2019 & 2032
- Table 112: France Sandwiched Panels Industry Volume (Square Meters) Forecast, by Application 2019 & 2032
- Table 113: Rest of Europe Sandwiched Panels Industry Revenue (Billion) Forecast, by Application 2019 & 2032
- Table 114: Rest of Europe Sandwiched Panels Industry Volume (Square Meters) Forecast, by Application 2019 & 2032
- Table 115: Global Sandwiched Panels Industry Revenue Billion Forecast, by Product 2019 & 2032
- Table 116: Global Sandwiched Panels Industry Volume Square Meters Forecast, by Product 2019 & 2032
- Table 117: Global Sandwiched Panels Industry Revenue Billion Forecast, by Skin Material 2019 & 2032
- Table 118: Global Sandwiched Panels Industry Volume Square Meters Forecast, by Skin Material 2019 & 2032
- Table 119: Global Sandwiched Panels Industry Revenue Billion Forecast, by Application 2019 & 2032
- Table 120: Global Sandwiched Panels Industry Volume Square Meters Forecast, by Application 2019 & 2032
- Table 121: Global Sandwiched Panels Industry Revenue Billion Forecast, by Country 2019 & 2032
- Table 122: Global Sandwiched Panels Industry Volume Square Meters Forecast, by Country 2019 & 2032
- Table 123: Brazil Sandwiched Panels Industry Revenue (Billion) Forecast, by Application 2019 & 2032
- Table 124: Brazil Sandwiched Panels Industry Volume (Square Meters) Forecast, by Application 2019 & 2032
- Table 125: Argentina Sandwiched Panels Industry Revenue (Billion) Forecast, by Application 2019 & 2032
- Table 126: Argentina Sandwiched Panels Industry Volume (Square Meters) Forecast, by Application 2019 & 2032
- Table 127: Rest of South America Sandwiched Panels Industry Revenue (Billion) Forecast, by Application 2019 & 2032
- Table 128: Rest of South America Sandwiched Panels Industry Volume (Square Meters) Forecast, by Application 2019 & 2032
- Table 129: Global Sandwiched Panels Industry Revenue Billion Forecast, by Product 2019 & 2032
- Table 130: Global Sandwiched Panels Industry Volume Square Meters Forecast, by Product 2019 & 2032
- Table 131: Global Sandwiched Panels Industry Revenue Billion Forecast, by Skin Material 2019 & 2032
- Table 132: Global Sandwiched Panels Industry Volume Square Meters Forecast, by Skin Material 2019 & 2032
- Table 133: Global Sandwiched Panels Industry Revenue Billion Forecast, by Application 2019 & 2032
- Table 134: Global Sandwiched Panels Industry Volume Square Meters Forecast, by Application 2019 & 2032
- Table 135: Global Sandwiched Panels Industry Revenue Billion Forecast, by Country 2019 & 2032
- Table 136: Global Sandwiched Panels Industry Volume Square Meters Forecast, by Country 2019 & 2032
- Table 137: Saudi Arabia Sandwiched Panels Industry Revenue (Billion) Forecast, by Application 2019 & 2032
- Table 138: Saudi Arabia Sandwiched Panels Industry Volume (Square Meters) Forecast, by Application 2019 & 2032
- Table 139: South Africa Sandwiched Panels Industry Revenue (Billion) Forecast, by Application 2019 & 2032
- Table 140: South Africa Sandwiched Panels Industry Volume (Square Meters) Forecast, by Application 2019 & 2032
- Table 141: Rest of Middle East and Africa Sandwiched Panels Industry Revenue (Billion) Forecast, by Application 2019 & 2032
- Table 142: Rest of Middle East and Africa Sandwiched Panels Industry Volume (Square Meters) Forecast, by Application 2019 & 2032
Frequently Asked Questions
1. What is the projected Compound Annual Growth Rate (CAGR) of the Sandwiched Panels Industry?
The projected CAGR is approximately 8.85%.
2. Which companies are prominent players in the Sandwiched Panels Industry?
Key companies in the market include ITALPANNELLI SRL, METECNO, ArcelorMittal, Balex-Metal, Tata Steel, Rautaruukki Corporation, Premium Building Systems, Owens Corning, Kingspan Group, Multicolor Steels (India) Pvt Ltd, Cornerstone Building Brands, DANA Group of Companies, Zamil Industrial Pre-Engineered Buildings Co Ltd, Jiangsu Jingxue Insulation Technology Co Ltd, Alubel SpA, Nucor Building Systems, Manni Group SpA, PFB Corporation(Riverside).
3. What are the main segments of the Sandwiched Panels Industry?
The market segments include Product, Skin Material, Application.
4. Can you provide details about the market size?
The market size is estimated to be USD 1.95 Billion as of 2022.
5. What are some drivers contributing to market growth?
Increasing Demand from Construction Sector; Increasing Cold Storage Applications.
6. What are the notable trends driving market growth?
Increasing Demand from Building Walls.
7. Are there any restraints impacting market growth?
Advancements in Building Technologies. such as Modular Construction Techniques; Other Restraints.
8. Can you provide examples of recent developments in the market?
June 2022: Owens Corning announced the acquisition of a Florida-based composite decking and structural lumber manufacturer, WearDeck. With the acquisition, Owens Corning would strengthen its portfolio of weather-resistant decking and structural lumber and expand its expertise in both commercial and residential applications.
9. What pricing options are available for accessing the report?
Pricing options include single-user, multi-user, and enterprise licenses priced at USD 4750, USD 5250, and USD 8750 respectively.
10. Is the market size provided in terms of value or volume?
The market size is provided in terms of value, measured in Billion and volume, measured in Square Meters.
11. Are there any specific market keywords associated with the report?
Yes, the market keyword associated with the report is "Sandwiched Panels Industry," which aids in identifying and referencing the specific market segment covered.
12. How do I determine which pricing option suits my needs best?
The pricing options vary based on user requirements and access needs. Individual users may opt for single-user licenses, while businesses requiring broader access may choose multi-user or enterprise licenses for cost-effective access to the report.
13. Are there any additional resources or data provided in the Sandwiched Panels Industry report?
While the report offers comprehensive insights, it's advisable to review the specific contents or supplementary materials provided to ascertain if additional resources or data are available.
14. How can I stay updated on further developments or reports in the Sandwiched Panels Industry?
To stay informed about further developments, trends, and reports in the Sandwiched Panels Industry, consider subscribing to industry newsletters, following relevant companies and organizations, or regularly checking reputable industry news sources and publications.
Methodology
Step 1 - Identification of Relevant Samples Size from Population Database


Step 2 - Approaches for Defining Global Market Size (Value, Volume* & Price*)

Note*: In applicable scenarios
Step 3 - Data Sources
Primary Research
- Web Analytics
- Survey Reports
- Research Institute
- Latest Research Reports
- Opinion Leaders
Secondary Research
- Annual Reports
- White Paper
- Latest Press Release
- Industry Association
- Paid Database
- Investor Presentations

Step 4 - Data Triangulation
Involves using different sources of information in order to increase the validity of a study
These sources are likely to be stakeholders in a program - participants, other researchers, program staff, other community members, and so on.
Then we put all data in single framework & apply various statistical tools to find out the dynamic on the market.
During the analysis stage, feedback from the stakeholder groups would be compared to determine areas of agreement as well as areas of divergence


