
Key Insights
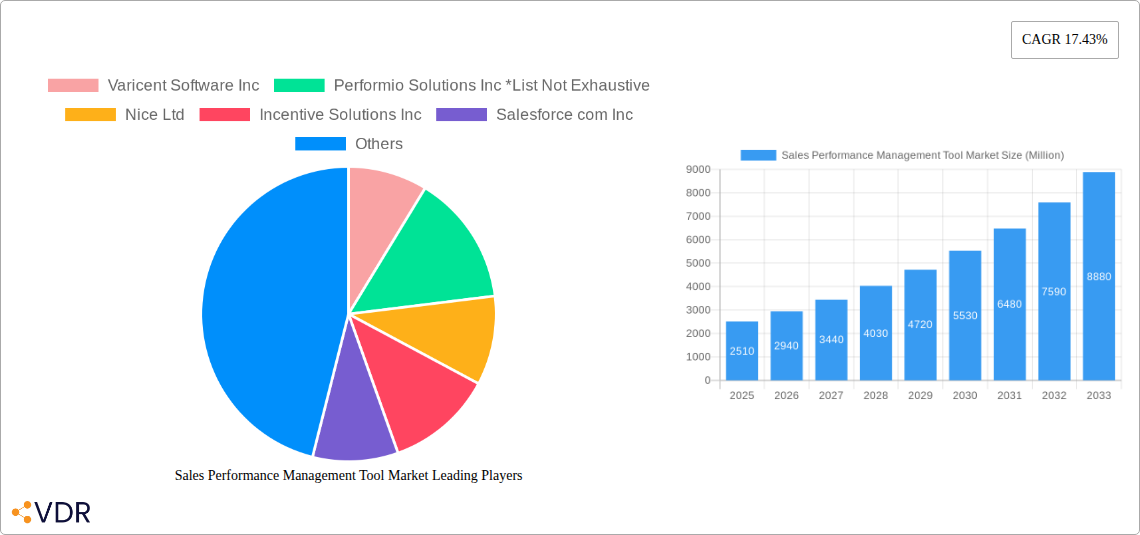
The Sales Performance Management (SPM) tool market is experiencing robust growth, projected to reach \$2.51 billion in 2025 and exhibiting a Compound Annual Growth Rate (CAGR) of 17.43% from 2025 to 2033. This expansion is fueled by several key drivers. Firstly, the increasing need for businesses to enhance sales efficiency and optimize sales strategies in a competitive landscape is a major catalyst. Secondly, the rise of cloud-based solutions offers scalability, cost-effectiveness, and accessibility, driving market adoption. Furthermore, the integration of advanced analytics and artificial intelligence within SPM tools allows for data-driven decision-making, improving sales forecasting and performance monitoring. The adoption of incentive compensation management solutions, a key segment within the SPM market, is further contributing to this growth. Different industry verticals, including BFSI, manufacturing, healthcare, and IT & Telecom, are actively adopting SPM tools to improve sales processes and enhance overall business performance.
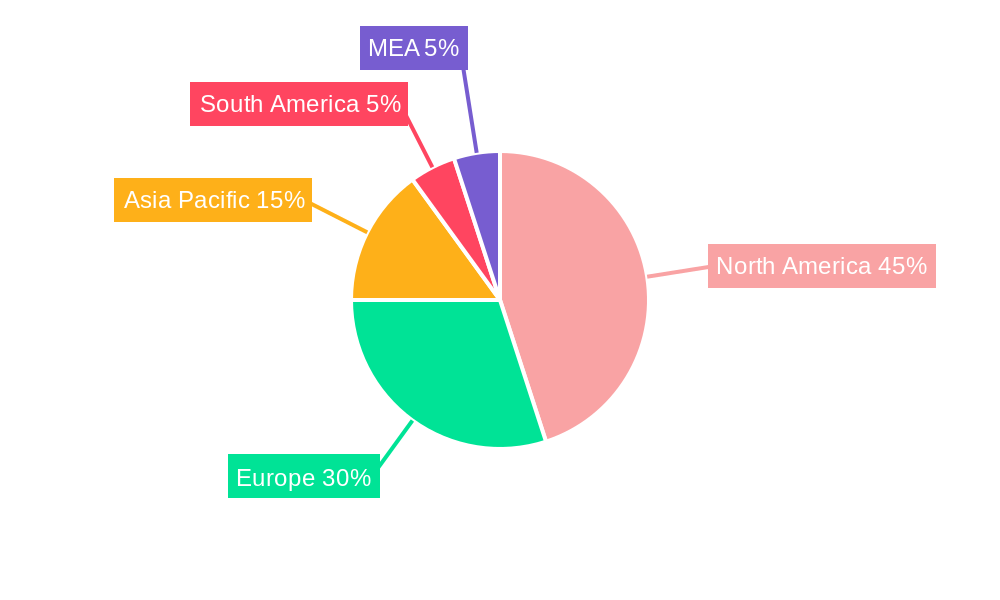
Despite this positive growth trajectory, the market faces certain challenges. The complexity of implementing and integrating SPM solutions can be a significant barrier for smaller organizations. Data security and privacy concerns also present a restraint, especially with the increasing reliance on cloud-based platforms. However, ongoing technological advancements, coupled with increasing awareness of the benefits of SPM tools, are likely to mitigate these restraints in the coming years. The market is segmented by deployment (on-premise, cloud), solution (incentive compensation management, territory management, sales monitoring and planning, sales analytics, others), and end-user vertical (BFSI, manufacturing, energy and utility, healthcare, IT and telecom, and others). North America currently holds a significant market share, driven by the presence of major technology players and high adoption rates. However, Asia-Pacific is expected to witness rapid growth in the coming years due to increased digitalization and economic expansion in several key regions.
Sales Performance Management Tool Market: A Comprehensive Report (2019-2033)
This in-depth report provides a comprehensive analysis of the Sales Performance Management (SPM) Tool market, encompassing its current state, future trajectory, and key players. We examine the parent market of Enterprise Resource Planning (ERP) software and the child market of cloud-based sales solutions, offering granular insights into market segmentation, growth drivers, and competitive dynamics. The study period spans from 2019 to 2033, with 2025 serving as both the base and estimated year. The market size is presented in million units.
Sales Performance Management Tool Market Dynamics & Structure
The Sales Performance Management (SPM) Tool market is characterized by moderate concentration, with a few dominant players and several niche providers. Technological innovation, particularly in AI and machine learning, is a major driver, enhancing predictive analytics and automation capabilities. Regulatory frameworks around data privacy (GDPR, CCPA) significantly influence market practices and vendor strategies. Competitive pressures come from both direct competitors and substitute solutions offering overlapping functionalities within broader enterprise software suites. The end-user demographic is diverse, encompassing businesses across numerous verticals. The M&A landscape reflects the increasing consolidation of the market, with larger players acquiring smaller companies to expand their product portfolios and market reach.
- Market Concentration: Moderately concentrated, with top 5 players holding approximately xx% market share in 2024.
- M&A Activity: xx deals recorded between 2019 and 2024, indicating a trend of consolidation.
- Technological Innovation: AI-powered predictive analytics and automated workflows are key drivers of innovation.
- Regulatory Landscape: GDPR and CCPA compliance are significant considerations for vendors and users.
- Competitive Substitutes: CRM and business intelligence platforms provide some overlapping functionalities.
Sales Performance Management Tool Market Growth Trends & Insights
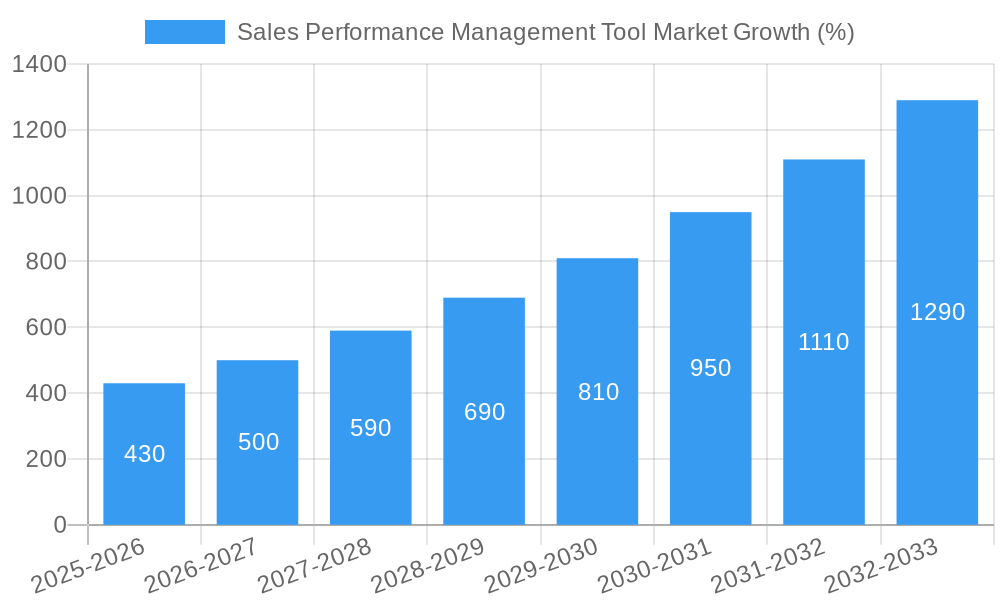
The SPM Tool market exhibits a robust growth trajectory, driven by increasing demand for data-driven insights and optimized sales processes. From 2019 to 2024, the market witnessed a CAGR of xx%, reaching a market size of xx million units in 2024. This growth is fueled by the adoption of cloud-based solutions offering scalability and cost-effectiveness. Technological disruptions, particularly advancements in AI and big data analytics, continuously reshape the market landscape. Furthermore, evolving consumer behavior, favoring personalized experiences and seamless digital interactions, necessitates sophisticated SPM tools for businesses to thrive. The market is projected to maintain a healthy CAGR of xx% during the forecast period (2025-2033), reaching xx million units by 2033. Market penetration remains relatively low, indicating substantial untapped potential across various industries and regions.
Dominant Regions, Countries, or Segments in Sales Performance Management Tool Market
North America currently dominates the SPM Tool market, driven by early adoption of advanced technologies and a high concentration of large enterprises. Within the market segmentation:
- By Deployment: The cloud segment is experiencing the fastest growth, owing to its flexibility, scalability, and cost advantages over on-premise solutions. The cloud segment is projected to account for xx% of the total market by 2033.
- By Solution: Incentive Compensation Management holds the largest market share, followed by Sales Analytics and Territory Management. This reflects the high importance businesses place on aligning compensation strategies with sales performance.
- By End-user Vertical: BFSI and IT & Telecom sectors are leading adopters of SPM tools, followed by Manufacturing and Healthcare. These sectors are characterized by high sales volumes and complex sales processes requiring sophisticated tools for performance monitoring and optimization.
Key Drivers by Region:
- North America: Strong technological infrastructure, high enterprise adoption rates, and significant investments in data analytics.
- Europe: Growing adoption of cloud-based solutions and increasing focus on data privacy compliance.
- Asia-Pacific: Rapid economic growth and increasing digitalization in emerging markets.
Sales Performance Management Tool Market Product Landscape
The SPM tool market offers a diverse range of solutions catering to various needs and organizational structures. Recent product innovations focus on enhanced user experience, AI-driven predictive capabilities, and seamless integration with other enterprise software. Key performance metrics include improved sales forecasting accuracy, enhanced sales team productivity, optimized incentive compensation programs, and reduced sales operational costs. Many vendors emphasize user-friendly interfaces, real-time data visualization, and mobile accessibility as crucial differentiating features.
Key Drivers, Barriers & Challenges in Sales Performance Management Tool Market
Key Drivers: Increasing demand for data-driven sales insights, the need for improved sales force productivity, growing adoption of cloud computing, and advancements in artificial intelligence and machine learning.
Challenges: High initial investment costs, complex implementation processes, resistance to change within organizations, and the need for skilled personnel to manage and interpret the data generated by these tools. Data security concerns related to sensitive sales data are also a challenge. Integration complexities with existing systems can also hinder adoption. These challenges lead to a xx% adoption rate in some smaller businesses.
Emerging Opportunities in Sales Performance Management Tool Market
Emerging opportunities reside in untapped markets, particularly in developing economies with increasing digitalization. Furthermore, the integration of SPM tools with emerging technologies such as IoT and blockchain presents significant potential. The growth of personalized sales experiences through advanced analytics also offers promising avenues. Lastly, specialized solutions tailored to niche industries (e.g., renewable energy, e-commerce) are expected to see significant growth.
Growth Accelerators in the Sales Performance Management Tool Market Industry
Strategic partnerships between SPM vendors and technology providers (e.g., cloud platforms, data analytics companies) are significant growth accelerators. Advancements in AI and machine learning capabilities, coupled with the ongoing transition to cloud-based deployment models, are significantly driving market expansion. The expanding global adoption of data analytics and the increasing focus on sales performance optimization across industries are contributing to market growth.
Key Players Shaping the Sales Performance Management Tool Market Market
- Varicent Software Inc
- Performio Solutions Inc
- Nice Ltd
- Incentive Solutions Inc
- Salesforce com Inc
- Iconixx Software Corporation
- Anaplan Inc
- Oracle Corporation
- Xactly Corporation
- Beqom SA
- SAP SE
Notable Milestones in Sales Performance Management Tool Market Sector
- September 2022: Infosys' partnership with Microsoft Cloud for Retail highlights the increasing integration of cloud technologies within SPM solutions, boosting efficiency and scalability for retail businesses.
- August 2022: Beqom's acquisition of Our Tandem underscores the growing trend of consolidation within the SPM market and expansion into continuous performance management.
In-Depth Sales Performance Management Tool Market Market Outlook
The SPM Tool market is poised for continued strong growth, driven by technological advancements, increasing data volumes, and the growing need for improved sales efficiency. The shift towards cloud-based solutions and the integration of AI and machine learning will further enhance the capabilities of these tools, leading to better sales forecasting, optimized incentive compensation, and improved sales team productivity. Strategic partnerships and targeted market expansion strategies by key players will play a crucial role in shaping the future of this dynamic market.
Sales Performance Management Tool Market Segmentation
-
1. Deployment
- 1.1. On-premise
- 1.2. Cloud
-
2. Solution
- 2.1. Incentive Compensation Management
- 2.2. Territory Management
- 2.3. Sales Monitoring and Planning
- 2.4. Sales Analytics
- 2.5. Other Solutions
-
3. End-user Vertical
- 3.1. BFSI
- 3.2. Manufacturing
- 3.3. Energy and Utility
- 3.4. Healthcare
- 3.5. IT and Telecom
- 3.6. Other End-user Verticals
Sales Performance Management Tool Market Segmentation By Geography
- 1. North America
- 2. Europe
- 3. Asia Pacific
- 4. Rest of the World
Sales Performance Management Tool Market REPORT HIGHLIGHTS
| Aspects | Details |
|---|---|
| Study Period | 2019-2033 |
| Base Year | 2024 |
| Estimated Year | 2025 |
| Forecast Period | 2025-2033 |
| Historical Period | 2019-2024 |
| Growth Rate | CAGR of 17.43% from 2019-2033 |
| Segmentation |
|
Table of Contents
- 1. Introduction
- 1.1. Research Scope
- 1.2. Market Segmentation
- 1.3. Research Methodology
- 1.4. Definitions and Assumptions
- 2. Executive Summary
- 2.1. Introduction
- 3. Market Dynamics
- 3.1. Introduction
- 3.2. Market Drivers
- 3.2.1. Demand for Improved Sales Channels and Performance; Increasing Demand for Sales Mobility
- 3.3. Market Restrains
- 3.3.1. Lack of Awareness and Altering Organization Structure
- 3.4. Market Trends
- 3.4.1. Increasing Demand for Sales Mobility Driving Market Growth
- 4. Market Factor Analysis
- 4.1. Porters Five Forces
- 4.2. Supply/Value Chain
- 4.3. PESTEL analysis
- 4.4. Market Entropy
- 4.5. Patent/Trademark Analysis
- 5. Global Sales Performance Management Tool Market Analysis, Insights and Forecast, 2019-2031
- 5.1. Market Analysis, Insights and Forecast - by Deployment
- 5.1.1. On-premise
- 5.1.2. Cloud
- 5.2. Market Analysis, Insights and Forecast - by Solution
- 5.2.1. Incentive Compensation Management
- 5.2.2. Territory Management
- 5.2.3. Sales Monitoring and Planning
- 5.2.4. Sales Analytics
- 5.2.5. Other Solutions
- 5.3. Market Analysis, Insights and Forecast - by End-user Vertical
- 5.3.1. BFSI
- 5.3.2. Manufacturing
- 5.3.3. Energy and Utility
- 5.3.4. Healthcare
- 5.3.5. IT and Telecom
- 5.3.6. Other End-user Verticals
- 5.4. Market Analysis, Insights and Forecast - by Region
- 5.4.1. North America
- 5.4.2. Europe
- 5.4.3. Asia Pacific
- 5.4.4. Rest of the World
- 5.1. Market Analysis, Insights and Forecast - by Deployment
- 6. North America Sales Performance Management Tool Market Analysis, Insights and Forecast, 2019-2031
- 6.1. Market Analysis, Insights and Forecast - by Deployment
- 6.1.1. On-premise
- 6.1.2. Cloud
- 6.2. Market Analysis, Insights and Forecast - by Solution
- 6.2.1. Incentive Compensation Management
- 6.2.2. Territory Management
- 6.2.3. Sales Monitoring and Planning
- 6.2.4. Sales Analytics
- 6.2.5. Other Solutions
- 6.3. Market Analysis, Insights and Forecast - by End-user Vertical
- 6.3.1. BFSI
- 6.3.2. Manufacturing
- 6.3.3. Energy and Utility
- 6.3.4. Healthcare
- 6.3.5. IT and Telecom
- 6.3.6. Other End-user Verticals
- 6.1. Market Analysis, Insights and Forecast - by Deployment
- 7. Europe Sales Performance Management Tool Market Analysis, Insights and Forecast, 2019-2031
- 7.1. Market Analysis, Insights and Forecast - by Deployment
- 7.1.1. On-premise
- 7.1.2. Cloud
- 7.2. Market Analysis, Insights and Forecast - by Solution
- 7.2.1. Incentive Compensation Management
- 7.2.2. Territory Management
- 7.2.3. Sales Monitoring and Planning
- 7.2.4. Sales Analytics
- 7.2.5. Other Solutions
- 7.3. Market Analysis, Insights and Forecast - by End-user Vertical
- 7.3.1. BFSI
- 7.3.2. Manufacturing
- 7.3.3. Energy and Utility
- 7.3.4. Healthcare
- 7.3.5. IT and Telecom
- 7.3.6. Other End-user Verticals
- 7.1. Market Analysis, Insights and Forecast - by Deployment
- 8. Asia Pacific Sales Performance Management Tool Market Analysis, Insights and Forecast, 2019-2031
- 8.1. Market Analysis, Insights and Forecast - by Deployment
- 8.1.1. On-premise
- 8.1.2. Cloud
- 8.2. Market Analysis, Insights and Forecast - by Solution
- 8.2.1. Incentive Compensation Management
- 8.2.2. Territory Management
- 8.2.3. Sales Monitoring and Planning
- 8.2.4. Sales Analytics
- 8.2.5. Other Solutions
- 8.3. Market Analysis, Insights and Forecast - by End-user Vertical
- 8.3.1. BFSI
- 8.3.2. Manufacturing
- 8.3.3. Energy and Utility
- 8.3.4. Healthcare
- 8.3.5. IT and Telecom
- 8.3.6. Other End-user Verticals
- 8.1. Market Analysis, Insights and Forecast - by Deployment
- 9. Rest of the World Sales Performance Management Tool Market Analysis, Insights and Forecast, 2019-2031
- 9.1. Market Analysis, Insights and Forecast - by Deployment
- 9.1.1. On-premise
- 9.1.2. Cloud
- 9.2. Market Analysis, Insights and Forecast - by Solution
- 9.2.1. Incentive Compensation Management
- 9.2.2. Territory Management
- 9.2.3. Sales Monitoring and Planning
- 9.2.4. Sales Analytics
- 9.2.5. Other Solutions
- 9.3. Market Analysis, Insights and Forecast - by End-user Vertical
- 9.3.1. BFSI
- 9.3.2. Manufacturing
- 9.3.3. Energy and Utility
- 9.3.4. Healthcare
- 9.3.5. IT and Telecom
- 9.3.6. Other End-user Verticals
- 9.1. Market Analysis, Insights and Forecast - by Deployment
- 10. North America Sales Performance Management Tool Market Analysis, Insights and Forecast, 2019-2031
- 10.1. Market Analysis, Insights and Forecast - By Country/Sub-region
- 10.1.1 United States
- 10.1.2 Canada
- 10.1.3 Mexico
- 11. Europe Sales Performance Management Tool Market Analysis, Insights and Forecast, 2019-2031
- 11.1. Market Analysis, Insights and Forecast - By Country/Sub-region
- 11.1.1 Germany
- 11.1.2 United Kingdom
- 11.1.3 France
- 11.1.4 Spain
- 11.1.5 Italy
- 11.1.6 Spain
- 11.1.7 Belgium
- 11.1.8 Netherland
- 11.1.9 Nordics
- 11.1.10 Rest of Europe
- 12. Asia Pacific Sales Performance Management Tool Market Analysis, Insights and Forecast, 2019-2031
- 12.1. Market Analysis, Insights and Forecast - By Country/Sub-region
- 12.1.1 China
- 12.1.2 Japan
- 12.1.3 India
- 12.1.4 South Korea
- 12.1.5 Southeast Asia
- 12.1.6 Australia
- 12.1.7 Indonesia
- 12.1.8 Phillipes
- 12.1.9 Singapore
- 12.1.10 Thailandc
- 12.1.11 Rest of Asia Pacific
- 13. South America Sales Performance Management Tool Market Analysis, Insights and Forecast, 2019-2031
- 13.1. Market Analysis, Insights and Forecast - By Country/Sub-region
- 13.1.1 Brazil
- 13.1.2 Argentina
- 13.1.3 Peru
- 13.1.4 Chile
- 13.1.5 Colombia
- 13.1.6 Ecuador
- 13.1.7 Venezuela
- 13.1.8 Rest of South America
- 14. North America Sales Performance Management Tool Market Analysis, Insights and Forecast, 2019-2031
- 14.1. Market Analysis, Insights and Forecast - By Country/Sub-region
- 14.1.1 United States
- 14.1.2 Canada
- 14.1.3 Mexico
- 15. MEA Sales Performance Management Tool Market Analysis, Insights and Forecast, 2019-2031
- 15.1. Market Analysis, Insights and Forecast - By Country/Sub-region
- 15.1.1 United Arab Emirates
- 15.1.2 Saudi Arabia
- 15.1.3 South Africa
- 15.1.4 Rest of Middle East and Africa
- 16. Competitive Analysis
- 16.1. Global Market Share Analysis 2024
- 16.2. Company Profiles
- 16.2.1 Varicent Software Inc
- 16.2.1.1. Overview
- 16.2.1.2. Products
- 16.2.1.3. SWOT Analysis
- 16.2.1.4. Recent Developments
- 16.2.1.5. Financials (Based on Availability)
- 16.2.2 Performio Solutions Inc *List Not Exhaustive
- 16.2.2.1. Overview
- 16.2.2.2. Products
- 16.2.2.3. SWOT Analysis
- 16.2.2.4. Recent Developments
- 16.2.2.5. Financials (Based on Availability)
- 16.2.3 Nice Ltd
- 16.2.3.1. Overview
- 16.2.3.2. Products
- 16.2.3.3. SWOT Analysis
- 16.2.3.4. Recent Developments
- 16.2.3.5. Financials (Based on Availability)
- 16.2.4 Incentive Solutions Inc
- 16.2.4.1. Overview
- 16.2.4.2. Products
- 16.2.4.3. SWOT Analysis
- 16.2.4.4. Recent Developments
- 16.2.4.5. Financials (Based on Availability)
- 16.2.5 Salesforce com Inc
- 16.2.5.1. Overview
- 16.2.5.2. Products
- 16.2.5.3. SWOT Analysis
- 16.2.5.4. Recent Developments
- 16.2.5.5. Financials (Based on Availability)
- 16.2.6 Iconixx Software Corporation
- 16.2.6.1. Overview
- 16.2.6.2. Products
- 16.2.6.3. SWOT Analysis
- 16.2.6.4. Recent Developments
- 16.2.6.5. Financials (Based on Availability)
- 16.2.7 Anaplan Inc
- 16.2.7.1. Overview
- 16.2.7.2. Products
- 16.2.7.3. SWOT Analysis
- 16.2.7.4. Recent Developments
- 16.2.7.5. Financials (Based on Availability)
- 16.2.8 Oracle Corporation
- 16.2.8.1. Overview
- 16.2.8.2. Products
- 16.2.8.3. SWOT Analysis
- 16.2.8.4. Recent Developments
- 16.2.8.5. Financials (Based on Availability)
- 16.2.9 Xactly Corporation
- 16.2.9.1. Overview
- 16.2.9.2. Products
- 16.2.9.3. SWOT Analysis
- 16.2.9.4. Recent Developments
- 16.2.9.5. Financials (Based on Availability)
- 16.2.10 Beqom SA
- 16.2.10.1. Overview
- 16.2.10.2. Products
- 16.2.10.3. SWOT Analysis
- 16.2.10.4. Recent Developments
- 16.2.10.5. Financials (Based on Availability)
- 16.2.11 SAP SE
- 16.2.11.1. Overview
- 16.2.11.2. Products
- 16.2.11.3. SWOT Analysis
- 16.2.11.4. Recent Developments
- 16.2.11.5. Financials (Based on Availability)
- 16.2.1 Varicent Software Inc
List of Figures
- Figure 1: Global Sales Performance Management Tool Market Revenue Breakdown (Million, %) by Region 2024 & 2032
- Figure 2: North America Sales Performance Management Tool Market Revenue (Million), by Country 2024 & 2032
- Figure 3: North America Sales Performance Management Tool Market Revenue Share (%), by Country 2024 & 2032
- Figure 4: Europe Sales Performance Management Tool Market Revenue (Million), by Country 2024 & 2032
- Figure 5: Europe Sales Performance Management Tool Market Revenue Share (%), by Country 2024 & 2032
- Figure 6: Asia Pacific Sales Performance Management Tool Market Revenue (Million), by Country 2024 & 2032
- Figure 7: Asia Pacific Sales Performance Management Tool Market Revenue Share (%), by Country 2024 & 2032
- Figure 8: South America Sales Performance Management Tool Market Revenue (Million), by Country 2024 & 2032
- Figure 9: South America Sales Performance Management Tool Market Revenue Share (%), by Country 2024 & 2032
- Figure 10: North America Sales Performance Management Tool Market Revenue (Million), by Country 2024 & 2032
- Figure 11: North America Sales Performance Management Tool Market Revenue Share (%), by Country 2024 & 2032
- Figure 12: MEA Sales Performance Management Tool Market Revenue (Million), by Country 2024 & 2032
- Figure 13: MEA Sales Performance Management Tool Market Revenue Share (%), by Country 2024 & 2032
- Figure 14: North America Sales Performance Management Tool Market Revenue (Million), by Deployment 2024 & 2032
- Figure 15: North America Sales Performance Management Tool Market Revenue Share (%), by Deployment 2024 & 2032
- Figure 16: North America Sales Performance Management Tool Market Revenue (Million), by Solution 2024 & 2032
- Figure 17: North America Sales Performance Management Tool Market Revenue Share (%), by Solution 2024 & 2032
- Figure 18: North America Sales Performance Management Tool Market Revenue (Million), by End-user Vertical 2024 & 2032
- Figure 19: North America Sales Performance Management Tool Market Revenue Share (%), by End-user Vertical 2024 & 2032
- Figure 20: North America Sales Performance Management Tool Market Revenue (Million), by Country 2024 & 2032
- Figure 21: North America Sales Performance Management Tool Market Revenue Share (%), by Country 2024 & 2032
- Figure 22: Europe Sales Performance Management Tool Market Revenue (Million), by Deployment 2024 & 2032
- Figure 23: Europe Sales Performance Management Tool Market Revenue Share (%), by Deployment 2024 & 2032
- Figure 24: Europe Sales Performance Management Tool Market Revenue (Million), by Solution 2024 & 2032
- Figure 25: Europe Sales Performance Management Tool Market Revenue Share (%), by Solution 2024 & 2032
- Figure 26: Europe Sales Performance Management Tool Market Revenue (Million), by End-user Vertical 2024 & 2032
- Figure 27: Europe Sales Performance Management Tool Market Revenue Share (%), by End-user Vertical 2024 & 2032
- Figure 28: Europe Sales Performance Management Tool Market Revenue (Million), by Country 2024 & 2032
- Figure 29: Europe Sales Performance Management Tool Market Revenue Share (%), by Country 2024 & 2032
- Figure 30: Asia Pacific Sales Performance Management Tool Market Revenue (Million), by Deployment 2024 & 2032
- Figure 31: Asia Pacific Sales Performance Management Tool Market Revenue Share (%), by Deployment 2024 & 2032
- Figure 32: Asia Pacific Sales Performance Management Tool Market Revenue (Million), by Solution 2024 & 2032
- Figure 33: Asia Pacific Sales Performance Management Tool Market Revenue Share (%), by Solution 2024 & 2032
- Figure 34: Asia Pacific Sales Performance Management Tool Market Revenue (Million), by End-user Vertical 2024 & 2032
- Figure 35: Asia Pacific Sales Performance Management Tool Market Revenue Share (%), by End-user Vertical 2024 & 2032
- Figure 36: Asia Pacific Sales Performance Management Tool Market Revenue (Million), by Country 2024 & 2032
- Figure 37: Asia Pacific Sales Performance Management Tool Market Revenue Share (%), by Country 2024 & 2032
- Figure 38: Rest of the World Sales Performance Management Tool Market Revenue (Million), by Deployment 2024 & 2032
- Figure 39: Rest of the World Sales Performance Management Tool Market Revenue Share (%), by Deployment 2024 & 2032
- Figure 40: Rest of the World Sales Performance Management Tool Market Revenue (Million), by Solution 2024 & 2032
- Figure 41: Rest of the World Sales Performance Management Tool Market Revenue Share (%), by Solution 2024 & 2032
- Figure 42: Rest of the World Sales Performance Management Tool Market Revenue (Million), by End-user Vertical 2024 & 2032
- Figure 43: Rest of the World Sales Performance Management Tool Market Revenue Share (%), by End-user Vertical 2024 & 2032
- Figure 44: Rest of the World Sales Performance Management Tool Market Revenue (Million), by Country 2024 & 2032
- Figure 45: Rest of the World Sales Performance Management Tool Market Revenue Share (%), by Country 2024 & 2032
List of Tables
- Table 1: Global Sales Performance Management Tool Market Revenue Million Forecast, by Region 2019 & 2032
- Table 2: Global Sales Performance Management Tool Market Revenue Million Forecast, by Deployment 2019 & 2032
- Table 3: Global Sales Performance Management Tool Market Revenue Million Forecast, by Solution 2019 & 2032
- Table 4: Global Sales Performance Management Tool Market Revenue Million Forecast, by End-user Vertical 2019 & 2032
- Table 5: Global Sales Performance Management Tool Market Revenue Million Forecast, by Region 2019 & 2032
- Table 6: Global Sales Performance Management Tool Market Revenue Million Forecast, by Country 2019 & 2032
- Table 7: United States Sales Performance Management Tool Market Revenue (Million) Forecast, by Application 2019 & 2032
- Table 8: Canada Sales Performance Management Tool Market Revenue (Million) Forecast, by Application 2019 & 2032
- Table 9: Mexico Sales Performance Management Tool Market Revenue (Million) Forecast, by Application 2019 & 2032
- Table 10: Global Sales Performance Management Tool Market Revenue Million Forecast, by Country 2019 & 2032
- Table 11: Germany Sales Performance Management Tool Market Revenue (Million) Forecast, by Application 2019 & 2032
- Table 12: United Kingdom Sales Performance Management Tool Market Revenue (Million) Forecast, by Application 2019 & 2032
- Table 13: France Sales Performance Management Tool Market Revenue (Million) Forecast, by Application 2019 & 2032
- Table 14: Spain Sales Performance Management Tool Market Revenue (Million) Forecast, by Application 2019 & 2032
- Table 15: Italy Sales Performance Management Tool Market Revenue (Million) Forecast, by Application 2019 & 2032
- Table 16: Spain Sales Performance Management Tool Market Revenue (Million) Forecast, by Application 2019 & 2032
- Table 17: Belgium Sales Performance Management Tool Market Revenue (Million) Forecast, by Application 2019 & 2032
- Table 18: Netherland Sales Performance Management Tool Market Revenue (Million) Forecast, by Application 2019 & 2032
- Table 19: Nordics Sales Performance Management Tool Market Revenue (Million) Forecast, by Application 2019 & 2032
- Table 20: Rest of Europe Sales Performance Management Tool Market Revenue (Million) Forecast, by Application 2019 & 2032
- Table 21: Global Sales Performance Management Tool Market Revenue Million Forecast, by Country 2019 & 2032
- Table 22: China Sales Performance Management Tool Market Revenue (Million) Forecast, by Application 2019 & 2032
- Table 23: Japan Sales Performance Management Tool Market Revenue (Million) Forecast, by Application 2019 & 2032
- Table 24: India Sales Performance Management Tool Market Revenue (Million) Forecast, by Application 2019 & 2032
- Table 25: South Korea Sales Performance Management Tool Market Revenue (Million) Forecast, by Application 2019 & 2032
- Table 26: Southeast Asia Sales Performance Management Tool Market Revenue (Million) Forecast, by Application 2019 & 2032
- Table 27: Australia Sales Performance Management Tool Market Revenue (Million) Forecast, by Application 2019 & 2032
- Table 28: Indonesia Sales Performance Management Tool Market Revenue (Million) Forecast, by Application 2019 & 2032
- Table 29: Phillipes Sales Performance Management Tool Market Revenue (Million) Forecast, by Application 2019 & 2032
- Table 30: Singapore Sales Performance Management Tool Market Revenue (Million) Forecast, by Application 2019 & 2032
- Table 31: Thailandc Sales Performance Management Tool Market Revenue (Million) Forecast, by Application 2019 & 2032
- Table 32: Rest of Asia Pacific Sales Performance Management Tool Market Revenue (Million) Forecast, by Application 2019 & 2032
- Table 33: Global Sales Performance Management Tool Market Revenue Million Forecast, by Country 2019 & 2032
- Table 34: Brazil Sales Performance Management Tool Market Revenue (Million) Forecast, by Application 2019 & 2032
- Table 35: Argentina Sales Performance Management Tool Market Revenue (Million) Forecast, by Application 2019 & 2032
- Table 36: Peru Sales Performance Management Tool Market Revenue (Million) Forecast, by Application 2019 & 2032
- Table 37: Chile Sales Performance Management Tool Market Revenue (Million) Forecast, by Application 2019 & 2032
- Table 38: Colombia Sales Performance Management Tool Market Revenue (Million) Forecast, by Application 2019 & 2032
- Table 39: Ecuador Sales Performance Management Tool Market Revenue (Million) Forecast, by Application 2019 & 2032
- Table 40: Venezuela Sales Performance Management Tool Market Revenue (Million) Forecast, by Application 2019 & 2032
- Table 41: Rest of South America Sales Performance Management Tool Market Revenue (Million) Forecast, by Application 2019 & 2032
- Table 42: Global Sales Performance Management Tool Market Revenue Million Forecast, by Country 2019 & 2032
- Table 43: United States Sales Performance Management Tool Market Revenue (Million) Forecast, by Application 2019 & 2032
- Table 44: Canada Sales Performance Management Tool Market Revenue (Million) Forecast, by Application 2019 & 2032
- Table 45: Mexico Sales Performance Management Tool Market Revenue (Million) Forecast, by Application 2019 & 2032
- Table 46: Global Sales Performance Management Tool Market Revenue Million Forecast, by Country 2019 & 2032
- Table 47: United Arab Emirates Sales Performance Management Tool Market Revenue (Million) Forecast, by Application 2019 & 2032
- Table 48: Saudi Arabia Sales Performance Management Tool Market Revenue (Million) Forecast, by Application 2019 & 2032
- Table 49: South Africa Sales Performance Management Tool Market Revenue (Million) Forecast, by Application 2019 & 2032
- Table 50: Rest of Middle East and Africa Sales Performance Management Tool Market Revenue (Million) Forecast, by Application 2019 & 2032
- Table 51: Global Sales Performance Management Tool Market Revenue Million Forecast, by Deployment 2019 & 2032
- Table 52: Global Sales Performance Management Tool Market Revenue Million Forecast, by Solution 2019 & 2032
- Table 53: Global Sales Performance Management Tool Market Revenue Million Forecast, by End-user Vertical 2019 & 2032
- Table 54: Global Sales Performance Management Tool Market Revenue Million Forecast, by Country 2019 & 2032
- Table 55: Global Sales Performance Management Tool Market Revenue Million Forecast, by Deployment 2019 & 2032
- Table 56: Global Sales Performance Management Tool Market Revenue Million Forecast, by Solution 2019 & 2032
- Table 57: Global Sales Performance Management Tool Market Revenue Million Forecast, by End-user Vertical 2019 & 2032
- Table 58: Global Sales Performance Management Tool Market Revenue Million Forecast, by Country 2019 & 2032
- Table 59: Global Sales Performance Management Tool Market Revenue Million Forecast, by Deployment 2019 & 2032
- Table 60: Global Sales Performance Management Tool Market Revenue Million Forecast, by Solution 2019 & 2032
- Table 61: Global Sales Performance Management Tool Market Revenue Million Forecast, by End-user Vertical 2019 & 2032
- Table 62: Global Sales Performance Management Tool Market Revenue Million Forecast, by Country 2019 & 2032
- Table 63: Global Sales Performance Management Tool Market Revenue Million Forecast, by Deployment 2019 & 2032
- Table 64: Global Sales Performance Management Tool Market Revenue Million Forecast, by Solution 2019 & 2032
- Table 65: Global Sales Performance Management Tool Market Revenue Million Forecast, by End-user Vertical 2019 & 2032
- Table 66: Global Sales Performance Management Tool Market Revenue Million Forecast, by Country 2019 & 2032
Frequently Asked Questions
1. What is the projected Compound Annual Growth Rate (CAGR) of the Sales Performance Management Tool Market?
The projected CAGR is approximately 17.43%.
2. Which companies are prominent players in the Sales Performance Management Tool Market?
Key companies in the market include Varicent Software Inc, Performio Solutions Inc *List Not Exhaustive, Nice Ltd, Incentive Solutions Inc, Salesforce com Inc, Iconixx Software Corporation, Anaplan Inc, Oracle Corporation, Xactly Corporation, Beqom SA, SAP SE.
3. What are the main segments of the Sales Performance Management Tool Market?
The market segments include Deployment, Solution, End-user Vertical.
4. Can you provide details about the market size?
The market size is estimated to be USD 2.51 Million as of 2022.
5. What are some drivers contributing to market growth?
Demand for Improved Sales Channels and Performance; Increasing Demand for Sales Mobility.
6. What are the notable trends driving market growth?
Increasing Demand for Sales Mobility Driving Market Growth.
7. Are there any restraints impacting market growth?
Lack of Awareness and Altering Organization Structure.
8. Can you provide examples of recent developments in the market?
September 2022: Infosys, one of the global leaders in next-generation digital services and consulting, announced a partnership with Microsoft Cloud for Retail. Retail organizations can swiftly reimagine consumer experiences, renew processes, and magnify systems using cloud and data due to this partnership. Infosys' team of Microsoft-certified professionals would use Microsoft Cloud for Retail to build digital solutions that can be quickly deployed and provide retailers with faster time-to-market through an accelerated Agile cloud transition. Using the cloud, retailers would gain efficiency in in-store operations, pricing and promotions, sales, and inventory management.
9. What pricing options are available for accessing the report?
Pricing options include single-user, multi-user, and enterprise licenses priced at USD 4750, USD 5250, and USD 8750 respectively.
10. Is the market size provided in terms of value or volume?
The market size is provided in terms of value, measured in Million.
11. Are there any specific market keywords associated with the report?
Yes, the market keyword associated with the report is "Sales Performance Management Tool Market," which aids in identifying and referencing the specific market segment covered.
12. How do I determine which pricing option suits my needs best?
The pricing options vary based on user requirements and access needs. Individual users may opt for single-user licenses, while businesses requiring broader access may choose multi-user or enterprise licenses for cost-effective access to the report.
13. Are there any additional resources or data provided in the Sales Performance Management Tool Market report?
While the report offers comprehensive insights, it's advisable to review the specific contents or supplementary materials provided to ascertain if additional resources or data are available.
14. How can I stay updated on further developments or reports in the Sales Performance Management Tool Market?
To stay informed about further developments, trends, and reports in the Sales Performance Management Tool Market, consider subscribing to industry newsletters, following relevant companies and organizations, or regularly checking reputable industry news sources and publications.
Methodology
Step 1 - Identification of Relevant Samples Size from Population Database


Step 2 - Approaches for Defining Global Market Size (Value, Volume* & Price*)

Note*: In applicable scenarios
Step 3 - Data Sources
Primary Research
- Web Analytics
- Survey Reports
- Research Institute
- Latest Research Reports
- Opinion Leaders
Secondary Research
- Annual Reports
- White Paper
- Latest Press Release
- Industry Association
- Paid Database
- Investor Presentations

Step 4 - Data Triangulation
Involves using different sources of information in order to increase the validity of a study
These sources are likely to be stakeholders in a program - participants, other researchers, program staff, other community members, and so on.
Then we put all data in single framework & apply various statistical tools to find out the dynamic on the market.
During the analysis stage, feedback from the stakeholder groups would be compared to determine areas of agreement as well as areas of divergence


