
Key Insights
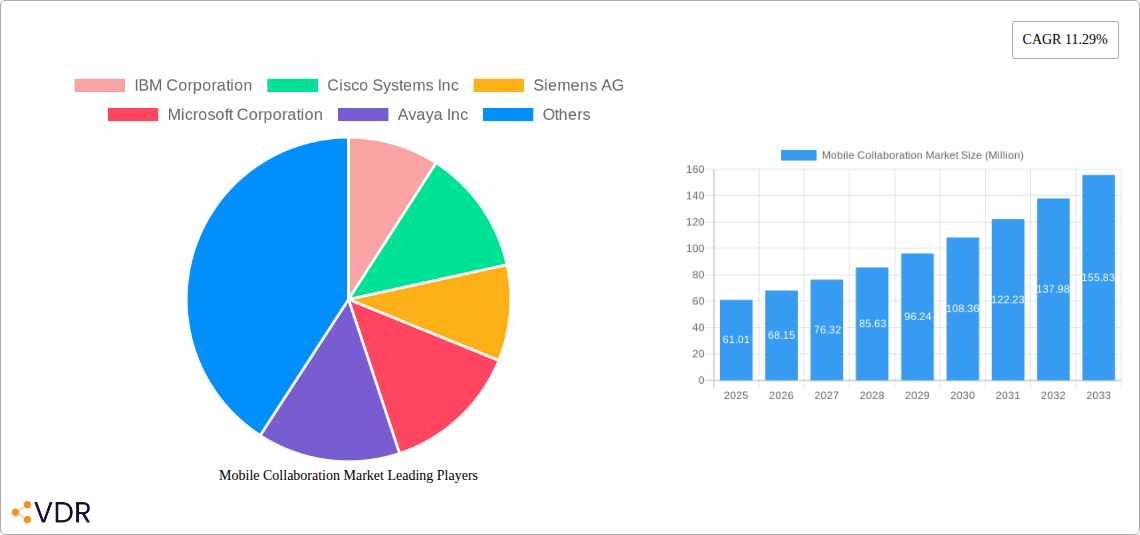
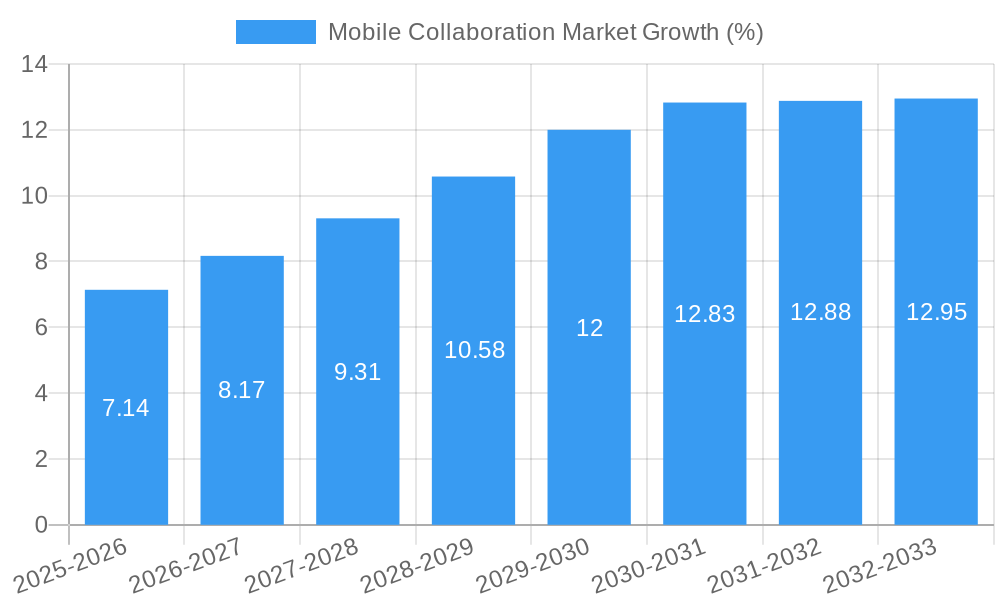
The mobile collaboration market, valued at $61.01 million in 2025, is experiencing robust growth, projected to expand significantly over the forecast period (2025-2033) at a Compound Annual Growth Rate (CAGR) of 11.29%. This expansion is driven by several key factors. The increasing adoption of mobile devices and remote work models, particularly accelerated by recent global events, is fueling demand for seamless communication and collaboration tools. Businesses across various sectors, including BFSI, healthcare, and IT & Telecom, are investing in mobile collaboration solutions to enhance productivity, improve employee engagement, and streamline workflows. Furthermore, the ongoing development of sophisticated features like enhanced security protocols, advanced analytics capabilities, and improved integration with existing enterprise systems is adding to market appeal. Competition among established players like IBM, Cisco, and Microsoft, alongside emerging innovative companies, fosters continuous improvement and cost-effectiveness, making mobile collaboration solutions increasingly accessible to a broader range of businesses.
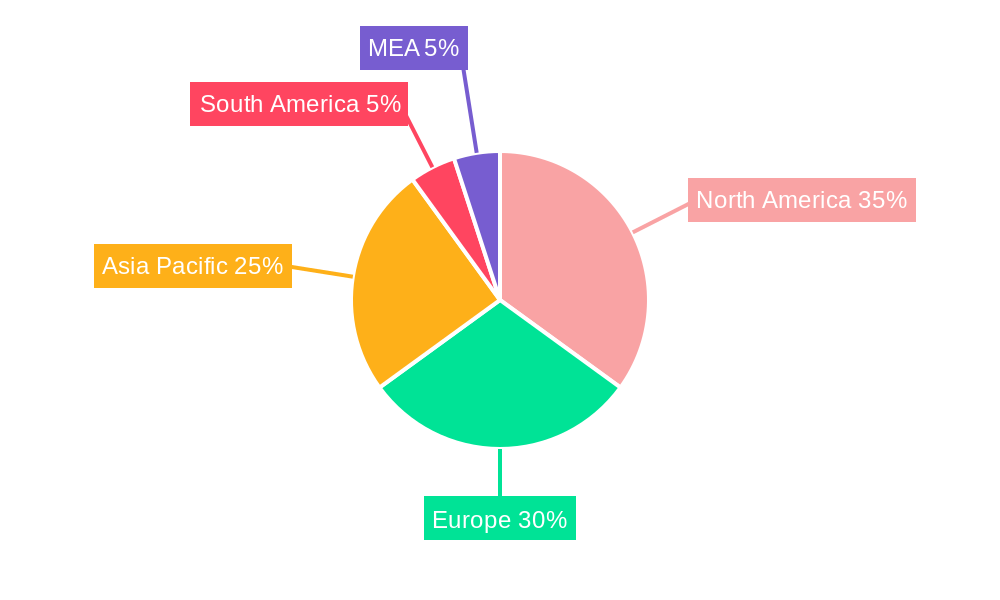
The market segmentation reveals significant opportunities across different service models (managed vs. professional services), industry verticals, and solution types. The BFSI sector, with its high reliance on secure communication and data sharing, presents a substantial market segment. Similarly, the increasing digitization of healthcare and the rising need for remote patient monitoring are driving demand in this sector. Solution-wise, portals and intranet platforms, along with file sharing and synchronization tools, currently dominate, but growth is expected across enterprise video and social networking solutions as businesses increasingly embrace richer communication methods. Geographic analysis suggests that North America and Europe currently hold a significant market share, however, the Asia-Pacific region, particularly China and India, are predicted to witness substantial growth in the coming years, driven by increasing smartphone penetration and digital adoption rates. The restraints to this market growth will likely come from security concerns, data privacy regulations, and the need for seamless integration with pre-existing legacy systems, making interoperability a key factor in future market developments.
Mobile Collaboration Market: A Comprehensive Report (2019-2033)
This in-depth report provides a comprehensive analysis of the Mobile Collaboration Market, encompassing market dynamics, growth trends, regional dominance, product landscape, key players, and future outlook. The report covers the parent market of Unified Communications and Collaboration and dives deep into the child market of Mobile Collaboration, offering granular insights for strategic decision-making. The study period spans from 2019 to 2033, with a base year of 2025 and a forecast period from 2025 to 2033. Market values are presented in Million units.
Mobile Collaboration Market Dynamics & Structure
The Mobile Collaboration market exhibits a moderately consolidated structure, with key players like IBM Corporation, Cisco Systems Inc, and Microsoft Corporation holding significant market share. Technological innovation, particularly in areas like AI-powered collaboration tools and enhanced security features, is a key driver. However, regulatory frameworks surrounding data privacy and security pose challenges. Competitive substitutes, such as traditional communication methods, exert pressure, while the increasing adoption of mobile devices among diverse demographics fuels market expansion. The historical period (2019-2024) witnessed a notable increase in M&A activity (xx deals), resulting in market consolidation and increased competition. Looking ahead, the forecast period (2025-2033) is expected to see continued consolidation.
- Market Concentration: Moderately consolidated, with top 5 players holding approximately xx% market share in 2025.
- Technological Drivers: AI-powered tools, enhanced security, improved interoperability.
- Regulatory Frameworks: GDPR, CCPA, and other data privacy regulations influence market dynamics.
- Competitive Substitutes: Traditional communication methods (email, phone calls).
- End-User Demographics: Growth driven by increasing smartphone penetration across various demographics.
- M&A Trends: xx M&A deals occurred between 2019 and 2024, with a projected xx deals for 2025-2033.
Mobile Collaboration Market Growth Trends & Insights
The Mobile Collaboration market experienced significant growth during the historical period (2019-2024), with a CAGR of xx%. This growth is primarily attributed to the increasing adoption of mobile devices for work and communication, coupled with the rising demand for seamless collaboration tools across various industries. The market size in 2024 reached xx Million units and is projected to reach xx Million units in 2025, with a forecast CAGR of xx% from 2025 to 2033. Technological disruptions, such as the rise of 5G and advancements in cloud computing, further accelerated market expansion. Shifting consumer behavior, including the preference for remote work and flexible work models, also contributed significantly to market growth. Market penetration in key regions is expected to increase substantially during the forecast period.
Dominant Regions, Countries, or Segments in Mobile Collaboration Market
North America currently holds the largest market share in the Mobile Collaboration market, driven by high technological adoption rates and a strong presence of key players. However, the Asia-Pacific region is projected to exhibit the highest growth rate during the forecast period, fueled by rapid economic growth, increasing smartphone penetration, and government initiatives promoting digital transformation. Within segments, the Managed Services segment holds the largest share in the Services category, while the BFSI and IT and Telecom sectors dominate the End-user Industry segment. The File Sharing and Synchronization solution segment shows significant growth potential.
- Key Drivers (North America): High technological adoption, strong presence of major players, robust infrastructure.
- Key Drivers (Asia-Pacific): Rapid economic growth, increasing smartphone penetration, government initiatives.
- Dominant Segment (Services): Managed Services (xx% market share in 2025).
- Dominant Segment (End-user Industry): BFSI and IT and Telecom (combined xx% market share in 2025).
- High-Growth Segment (Solution): File Sharing and Synchronization.
Mobile Collaboration Market Product Landscape
The Mobile Collaboration market showcases a diverse range of products, including portals and intranet platforms, file-sharing and synchronization tools, enterprise video conferencing solutions, and enterprise social networks. These products are characterized by increasing levels of integration, enhanced security features, and AI-driven functionalities aimed at improving user experience and productivity. Key innovations focus on seamless integration across various devices and platforms, improved user interface design, and advanced analytics capabilities. Unique selling propositions are centered on ease of use, security, and integration with existing business workflows.
Key Drivers, Barriers & Challenges in Mobile Collaboration Market
Key Drivers: Increased adoption of mobile devices, growing need for remote work solutions, rising demand for enhanced collaboration tools, and the expansion of 5G networks are key drivers. Government initiatives promoting digital transformation in various sectors are also contributing to market growth.
Key Challenges: Data security concerns, the complexity of integrating various collaboration tools, and the need for robust IT infrastructure are key challenges. Competition from established players and the emergence of new technologies create additional market pressure. Supply chain disruptions resulting in component shortages also impact market growth, potentially resulting in a xx% reduction in production in Q4 2026.
Emerging Opportunities in Mobile Collaboration Market
Untapped markets in developing economies present significant opportunities. The integration of AR/VR technologies into mobile collaboration platforms offers substantial potential. The growing demand for customized solutions tailored to specific industry needs and evolving consumer preferences related to enhanced collaboration experiences will generate new market opportunities. Furthermore, focus on improved accessibility for users with disabilities presents a niche but rapidly growing sector.
Growth Accelerators in the Mobile Collaboration Market Industry
Technological advancements, particularly in AI, cloud computing, and 5G, are driving long-term market growth. Strategic partnerships between technology providers and telecom operators are expanding market reach. The growing adoption of cloud-based collaboration solutions is a significant accelerator. Market expansion into underserved regions and the development of innovative applications for specific industries will further fuel market expansion.
Key Players Shaping the Mobile Collaboration Market Market
- IBM Corporation
- Cisco Systems Inc
- Siemens AG
- Microsoft Corporation
- Avaya Inc
- NEC Corporation
- Oracle Corporation
- Ribbon Communications LLC
- Alcatel-Lucent SA
Notable Milestones in Mobile Collaboration Market Sector
- January 2022: Microsoft launches Teams Connect, enhancing interoperability.
- March 2023: Cisco announces new Webex features integrating AI capabilities.
- October 2024: IBM acquires a smaller collaboration software company, expanding its portfolio.
In-Depth Mobile Collaboration Market Market Outlook
The Mobile Collaboration market is poised for sustained growth, driven by technological advancements, increasing demand for flexible work solutions, and expansion into new markets. Strategic partnerships and innovative product developments will further enhance market potential. The market is expected to witness significant growth in the forecast period (2025-2033), presenting lucrative opportunities for established players and new entrants alike. Focus on security, interoperability, and user experience will be crucial for success.
Mobile Collaboration Market Segmentation
-
1. Solution
- 1.1. Portals and Intranet Platform
- 1.2. File Sharing and Synchronization
- 1.3. Enterprise Video
- 1.4. Enterprise Social Network
- 1.5. Other Solutions
-
2. Services
- 2.1. Managed Services
- 2.2. Professional Services
-
3. End-user Industry
- 3.1. BFSI
- 3.2. Public Sector
- 3.3. Healthcare
- 3.4. Energy and Utilities
- 3.5. Retail
- 3.6. IT and Telecom
- 3.7. Travel and Hospitality
Mobile Collaboration Market Segmentation By Geography
- 1. North America
- 2. Europe
- 3. Asia Pacific
- 4. Latin America
- 5. Middle East
Mobile Collaboration Market REPORT HIGHLIGHTS
| Aspects | Details |
|---|---|
| Study Period | 2019-2033 |
| Base Year | 2024 |
| Estimated Year | 2025 |
| Forecast Period | 2025-2033 |
| Historical Period | 2019-2024 |
| Growth Rate | CAGR of 11.29% from 2019-2033 |
| Segmentation |
|
Table of Contents
- 1. Introduction
- 1.1. Research Scope
- 1.2. Market Segmentation
- 1.3. Research Methodology
- 1.4. Definitions and Assumptions
- 2. Executive Summary
- 2.1. Introduction
- 3. Market Dynamics
- 3.1. Introduction
- 3.2. Market Drivers
- 3.2.1. Increased Demand for BYOD Applications; Growing Smart Devices Sales
- 3.3. Market Restrains
- 3.3.1. Security Concerns to Challenge the Market Growth
- 3.4. Market Trends
- 3.4.1. Retail Segment is Expected to Witness High Growth
- 4. Market Factor Analysis
- 4.1. Porters Five Forces
- 4.2. Supply/Value Chain
- 4.3. PESTEL analysis
- 4.4. Market Entropy
- 4.5. Patent/Trademark Analysis
- 5. Global Mobile Collaboration Market Analysis, Insights and Forecast, 2019-2031
- 5.1. Market Analysis, Insights and Forecast - by Solution
- 5.1.1. Portals and Intranet Platform
- 5.1.2. File Sharing and Synchronization
- 5.1.3. Enterprise Video
- 5.1.4. Enterprise Social Network
- 5.1.5. Other Solutions
- 5.2. Market Analysis, Insights and Forecast - by Services
- 5.2.1. Managed Services
- 5.2.2. Professional Services
- 5.3. Market Analysis, Insights and Forecast - by End-user Industry
- 5.3.1. BFSI
- 5.3.2. Public Sector
- 5.3.3. Healthcare
- 5.3.4. Energy and Utilities
- 5.3.5. Retail
- 5.3.6. IT and Telecom
- 5.3.7. Travel and Hospitality
- 5.4. Market Analysis, Insights and Forecast - by Region
- 5.4.1. North America
- 5.4.2. Europe
- 5.4.3. Asia Pacific
- 5.4.4. Latin America
- 5.4.5. Middle East
- 5.1. Market Analysis, Insights and Forecast - by Solution
- 6. North America Mobile Collaboration Market Analysis, Insights and Forecast, 2019-2031
- 6.1. Market Analysis, Insights and Forecast - by Solution
- 6.1.1. Portals and Intranet Platform
- 6.1.2. File Sharing and Synchronization
- 6.1.3. Enterprise Video
- 6.1.4. Enterprise Social Network
- 6.1.5. Other Solutions
- 6.2. Market Analysis, Insights and Forecast - by Services
- 6.2.1. Managed Services
- 6.2.2. Professional Services
- 6.3. Market Analysis, Insights and Forecast - by End-user Industry
- 6.3.1. BFSI
- 6.3.2. Public Sector
- 6.3.3. Healthcare
- 6.3.4. Energy and Utilities
- 6.3.5. Retail
- 6.3.6. IT and Telecom
- 6.3.7. Travel and Hospitality
- 6.1. Market Analysis, Insights and Forecast - by Solution
- 7. Europe Mobile Collaboration Market Analysis, Insights and Forecast, 2019-2031
- 7.1. Market Analysis, Insights and Forecast - by Solution
- 7.1.1. Portals and Intranet Platform
- 7.1.2. File Sharing and Synchronization
- 7.1.3. Enterprise Video
- 7.1.4. Enterprise Social Network
- 7.1.5. Other Solutions
- 7.2. Market Analysis, Insights and Forecast - by Services
- 7.2.1. Managed Services
- 7.2.2. Professional Services
- 7.3. Market Analysis, Insights and Forecast - by End-user Industry
- 7.3.1. BFSI
- 7.3.2. Public Sector
- 7.3.3. Healthcare
- 7.3.4. Energy and Utilities
- 7.3.5. Retail
- 7.3.6. IT and Telecom
- 7.3.7. Travel and Hospitality
- 7.1. Market Analysis, Insights and Forecast - by Solution
- 8. Asia Pacific Mobile Collaboration Market Analysis, Insights and Forecast, 2019-2031
- 8.1. Market Analysis, Insights and Forecast - by Solution
- 8.1.1. Portals and Intranet Platform
- 8.1.2. File Sharing and Synchronization
- 8.1.3. Enterprise Video
- 8.1.4. Enterprise Social Network
- 8.1.5. Other Solutions
- 8.2. Market Analysis, Insights and Forecast - by Services
- 8.2.1. Managed Services
- 8.2.2. Professional Services
- 8.3. Market Analysis, Insights and Forecast - by End-user Industry
- 8.3.1. BFSI
- 8.3.2. Public Sector
- 8.3.3. Healthcare
- 8.3.4. Energy and Utilities
- 8.3.5. Retail
- 8.3.6. IT and Telecom
- 8.3.7. Travel and Hospitality
- 8.1. Market Analysis, Insights and Forecast - by Solution
- 9. Latin America Mobile Collaboration Market Analysis, Insights and Forecast, 2019-2031
- 9.1. Market Analysis, Insights and Forecast - by Solution
- 9.1.1. Portals and Intranet Platform
- 9.1.2. File Sharing and Synchronization
- 9.1.3. Enterprise Video
- 9.1.4. Enterprise Social Network
- 9.1.5. Other Solutions
- 9.2. Market Analysis, Insights and Forecast - by Services
- 9.2.1. Managed Services
- 9.2.2. Professional Services
- 9.3. Market Analysis, Insights and Forecast - by End-user Industry
- 9.3.1. BFSI
- 9.3.2. Public Sector
- 9.3.3. Healthcare
- 9.3.4. Energy and Utilities
- 9.3.5. Retail
- 9.3.6. IT and Telecom
- 9.3.7. Travel and Hospitality
- 9.1. Market Analysis, Insights and Forecast - by Solution
- 10. Middle East Mobile Collaboration Market Analysis, Insights and Forecast, 2019-2031
- 10.1. Market Analysis, Insights and Forecast - by Solution
- 10.1.1. Portals and Intranet Platform
- 10.1.2. File Sharing and Synchronization
- 10.1.3. Enterprise Video
- 10.1.4. Enterprise Social Network
- 10.1.5. Other Solutions
- 10.2. Market Analysis, Insights and Forecast - by Services
- 10.2.1. Managed Services
- 10.2.2. Professional Services
- 10.3. Market Analysis, Insights and Forecast - by End-user Industry
- 10.3.1. BFSI
- 10.3.2. Public Sector
- 10.3.3. Healthcare
- 10.3.4. Energy and Utilities
- 10.3.5. Retail
- 10.3.6. IT and Telecom
- 10.3.7. Travel and Hospitality
- 10.1. Market Analysis, Insights and Forecast - by Solution
- 11. North America Mobile Collaboration Market Analysis, Insights and Forecast, 2019-2031
- 11.1. Market Analysis, Insights and Forecast - By Country/Sub-region
- 11.1.1 United States
- 11.1.2 Canada
- 11.1.3 Mexico
- 12. Europe Mobile Collaboration Market Analysis, Insights and Forecast, 2019-2031
- 12.1. Market Analysis, Insights and Forecast - By Country/Sub-region
- 12.1.1 Germany
- 12.1.2 United Kingdom
- 12.1.3 France
- 12.1.4 Spain
- 12.1.5 Italy
- 12.1.6 Spain
- 12.1.7 Belgium
- 12.1.8 Netherland
- 12.1.9 Nordics
- 12.1.10 Rest of Europe
- 13. Asia Pacific Mobile Collaboration Market Analysis, Insights and Forecast, 2019-2031
- 13.1. Market Analysis, Insights and Forecast - By Country/Sub-region
- 13.1.1 China
- 13.1.2 Japan
- 13.1.3 India
- 13.1.4 South Korea
- 13.1.5 Southeast Asia
- 13.1.6 Australia
- 13.1.7 Indonesia
- 13.1.8 Phillipes
- 13.1.9 Singapore
- 13.1.10 Thailandc
- 13.1.11 Rest of Asia Pacific
- 14. South America Mobile Collaboration Market Analysis, Insights and Forecast, 2019-2031
- 14.1. Market Analysis, Insights and Forecast - By Country/Sub-region
- 14.1.1 Brazil
- 14.1.2 Argentina
- 14.1.3 Peru
- 14.1.4 Chile
- 14.1.5 Colombia
- 14.1.6 Ecuador
- 14.1.7 Venezuela
- 14.1.8 Rest of South America
- 15. North America Mobile Collaboration Market Analysis, Insights and Forecast, 2019-2031
- 15.1. Market Analysis, Insights and Forecast - By Country/Sub-region
- 15.1.1 United States
- 15.1.2 Canada
- 15.1.3 Mexico
- 16. MEA Mobile Collaboration Market Analysis, Insights and Forecast, 2019-2031
- 16.1. Market Analysis, Insights and Forecast - By Country/Sub-region
- 16.1.1 United Arab Emirates
- 16.1.2 Saudi Arabia
- 16.1.3 South Africa
- 16.1.4 Rest of Middle East and Africa
- 17. Competitive Analysis
- 17.1. Global Market Share Analysis 2024
- 17.2. Company Profiles
- 17.2.1 IBM Corporation
- 17.2.1.1. Overview
- 17.2.1.2. Products
- 17.2.1.3. SWOT Analysis
- 17.2.1.4. Recent Developments
- 17.2.1.5. Financials (Based on Availability)
- 17.2.2 Cisco Systems Inc
- 17.2.2.1. Overview
- 17.2.2.2. Products
- 17.2.2.3. SWOT Analysis
- 17.2.2.4. Recent Developments
- 17.2.2.5. Financials (Based on Availability)
- 17.2.3 Siemens AG
- 17.2.3.1. Overview
- 17.2.3.2. Products
- 17.2.3.3. SWOT Analysis
- 17.2.3.4. Recent Developments
- 17.2.3.5. Financials (Based on Availability)
- 17.2.4 Microsoft Corporation
- 17.2.4.1. Overview
- 17.2.4.2. Products
- 17.2.4.3. SWOT Analysis
- 17.2.4.4. Recent Developments
- 17.2.4.5. Financials (Based on Availability)
- 17.2.5 Avaya Inc
- 17.2.5.1. Overview
- 17.2.5.2. Products
- 17.2.5.3. SWOT Analysis
- 17.2.5.4. Recent Developments
- 17.2.5.5. Financials (Based on Availability)
- 17.2.6 NEC Corporation
- 17.2.6.1. Overview
- 17.2.6.2. Products
- 17.2.6.3. SWOT Analysis
- 17.2.6.4. Recent Developments
- 17.2.6.5. Financials (Based on Availability)
- 17.2.7 Oracle Corporation
- 17.2.7.1. Overview
- 17.2.7.2. Products
- 17.2.7.3. SWOT Analysis
- 17.2.7.4. Recent Developments
- 17.2.7.5. Financials (Based on Availability)
- 17.2.8 Ribbon Communications LLC
- 17.2.8.1. Overview
- 17.2.8.2. Products
- 17.2.8.3. SWOT Analysis
- 17.2.8.4. Recent Developments
- 17.2.8.5. Financials (Based on Availability)
- 17.2.9 Alcatel-Lucent SA
- 17.2.9.1. Overview
- 17.2.9.2. Products
- 17.2.9.3. SWOT Analysis
- 17.2.9.4. Recent Developments
- 17.2.9.5. Financials (Based on Availability)
- 17.2.1 IBM Corporation
List of Figures
- Figure 1: Global Mobile Collaboration Market Revenue Breakdown (Million, %) by Region 2024 & 2032
- Figure 2: Global Mobile Collaboration Market Volume Breakdown (K Unit, %) by Region 2024 & 2032
- Figure 3: North America Mobile Collaboration Market Revenue (Million), by Country 2024 & 2032
- Figure 4: North America Mobile Collaboration Market Volume (K Unit), by Country 2024 & 2032
- Figure 5: North America Mobile Collaboration Market Revenue Share (%), by Country 2024 & 2032
- Figure 6: North America Mobile Collaboration Market Volume Share (%), by Country 2024 & 2032
- Figure 7: Europe Mobile Collaboration Market Revenue (Million), by Country 2024 & 2032
- Figure 8: Europe Mobile Collaboration Market Volume (K Unit), by Country 2024 & 2032
- Figure 9: Europe Mobile Collaboration Market Revenue Share (%), by Country 2024 & 2032
- Figure 10: Europe Mobile Collaboration Market Volume Share (%), by Country 2024 & 2032
- Figure 11: Asia Pacific Mobile Collaboration Market Revenue (Million), by Country 2024 & 2032
- Figure 12: Asia Pacific Mobile Collaboration Market Volume (K Unit), by Country 2024 & 2032
- Figure 13: Asia Pacific Mobile Collaboration Market Revenue Share (%), by Country 2024 & 2032
- Figure 14: Asia Pacific Mobile Collaboration Market Volume Share (%), by Country 2024 & 2032
- Figure 15: South America Mobile Collaboration Market Revenue (Million), by Country 2024 & 2032
- Figure 16: South America Mobile Collaboration Market Volume (K Unit), by Country 2024 & 2032
- Figure 17: South America Mobile Collaboration Market Revenue Share (%), by Country 2024 & 2032
- Figure 18: South America Mobile Collaboration Market Volume Share (%), by Country 2024 & 2032
- Figure 19: North America Mobile Collaboration Market Revenue (Million), by Country 2024 & 2032
- Figure 20: North America Mobile Collaboration Market Volume (K Unit), by Country 2024 & 2032
- Figure 21: North America Mobile Collaboration Market Revenue Share (%), by Country 2024 & 2032
- Figure 22: North America Mobile Collaboration Market Volume Share (%), by Country 2024 & 2032
- Figure 23: MEA Mobile Collaboration Market Revenue (Million), by Country 2024 & 2032
- Figure 24: MEA Mobile Collaboration Market Volume (K Unit), by Country 2024 & 2032
- Figure 25: MEA Mobile Collaboration Market Revenue Share (%), by Country 2024 & 2032
- Figure 26: MEA Mobile Collaboration Market Volume Share (%), by Country 2024 & 2032
- Figure 27: North America Mobile Collaboration Market Revenue (Million), by Solution 2024 & 2032
- Figure 28: North America Mobile Collaboration Market Volume (K Unit), by Solution 2024 & 2032
- Figure 29: North America Mobile Collaboration Market Revenue Share (%), by Solution 2024 & 2032
- Figure 30: North America Mobile Collaboration Market Volume Share (%), by Solution 2024 & 2032
- Figure 31: North America Mobile Collaboration Market Revenue (Million), by Services 2024 & 2032
- Figure 32: North America Mobile Collaboration Market Volume (K Unit), by Services 2024 & 2032
- Figure 33: North America Mobile Collaboration Market Revenue Share (%), by Services 2024 & 2032
- Figure 34: North America Mobile Collaboration Market Volume Share (%), by Services 2024 & 2032
- Figure 35: North America Mobile Collaboration Market Revenue (Million), by End-user Industry 2024 & 2032
- Figure 36: North America Mobile Collaboration Market Volume (K Unit), by End-user Industry 2024 & 2032
- Figure 37: North America Mobile Collaboration Market Revenue Share (%), by End-user Industry 2024 & 2032
- Figure 38: North America Mobile Collaboration Market Volume Share (%), by End-user Industry 2024 & 2032
- Figure 39: North America Mobile Collaboration Market Revenue (Million), by Country 2024 & 2032
- Figure 40: North America Mobile Collaboration Market Volume (K Unit), by Country 2024 & 2032
- Figure 41: North America Mobile Collaboration Market Revenue Share (%), by Country 2024 & 2032
- Figure 42: North America Mobile Collaboration Market Volume Share (%), by Country 2024 & 2032
- Figure 43: Europe Mobile Collaboration Market Revenue (Million), by Solution 2024 & 2032
- Figure 44: Europe Mobile Collaboration Market Volume (K Unit), by Solution 2024 & 2032
- Figure 45: Europe Mobile Collaboration Market Revenue Share (%), by Solution 2024 & 2032
- Figure 46: Europe Mobile Collaboration Market Volume Share (%), by Solution 2024 & 2032
- Figure 47: Europe Mobile Collaboration Market Revenue (Million), by Services 2024 & 2032
- Figure 48: Europe Mobile Collaboration Market Volume (K Unit), by Services 2024 & 2032
- Figure 49: Europe Mobile Collaboration Market Revenue Share (%), by Services 2024 & 2032
- Figure 50: Europe Mobile Collaboration Market Volume Share (%), by Services 2024 & 2032
- Figure 51: Europe Mobile Collaboration Market Revenue (Million), by End-user Industry 2024 & 2032
- Figure 52: Europe Mobile Collaboration Market Volume (K Unit), by End-user Industry 2024 & 2032
- Figure 53: Europe Mobile Collaboration Market Revenue Share (%), by End-user Industry 2024 & 2032
- Figure 54: Europe Mobile Collaboration Market Volume Share (%), by End-user Industry 2024 & 2032
- Figure 55: Europe Mobile Collaboration Market Revenue (Million), by Country 2024 & 2032
- Figure 56: Europe Mobile Collaboration Market Volume (K Unit), by Country 2024 & 2032
- Figure 57: Europe Mobile Collaboration Market Revenue Share (%), by Country 2024 & 2032
- Figure 58: Europe Mobile Collaboration Market Volume Share (%), by Country 2024 & 2032
- Figure 59: Asia Pacific Mobile Collaboration Market Revenue (Million), by Solution 2024 & 2032
- Figure 60: Asia Pacific Mobile Collaboration Market Volume (K Unit), by Solution 2024 & 2032
- Figure 61: Asia Pacific Mobile Collaboration Market Revenue Share (%), by Solution 2024 & 2032
- Figure 62: Asia Pacific Mobile Collaboration Market Volume Share (%), by Solution 2024 & 2032
- Figure 63: Asia Pacific Mobile Collaboration Market Revenue (Million), by Services 2024 & 2032
- Figure 64: Asia Pacific Mobile Collaboration Market Volume (K Unit), by Services 2024 & 2032
- Figure 65: Asia Pacific Mobile Collaboration Market Revenue Share (%), by Services 2024 & 2032
- Figure 66: Asia Pacific Mobile Collaboration Market Volume Share (%), by Services 2024 & 2032
- Figure 67: Asia Pacific Mobile Collaboration Market Revenue (Million), by End-user Industry 2024 & 2032
- Figure 68: Asia Pacific Mobile Collaboration Market Volume (K Unit), by End-user Industry 2024 & 2032
- Figure 69: Asia Pacific Mobile Collaboration Market Revenue Share (%), by End-user Industry 2024 & 2032
- Figure 70: Asia Pacific Mobile Collaboration Market Volume Share (%), by End-user Industry 2024 & 2032
- Figure 71: Asia Pacific Mobile Collaboration Market Revenue (Million), by Country 2024 & 2032
- Figure 72: Asia Pacific Mobile Collaboration Market Volume (K Unit), by Country 2024 & 2032
- Figure 73: Asia Pacific Mobile Collaboration Market Revenue Share (%), by Country 2024 & 2032
- Figure 74: Asia Pacific Mobile Collaboration Market Volume Share (%), by Country 2024 & 2032
- Figure 75: Latin America Mobile Collaboration Market Revenue (Million), by Solution 2024 & 2032
- Figure 76: Latin America Mobile Collaboration Market Volume (K Unit), by Solution 2024 & 2032
- Figure 77: Latin America Mobile Collaboration Market Revenue Share (%), by Solution 2024 & 2032
- Figure 78: Latin America Mobile Collaboration Market Volume Share (%), by Solution 2024 & 2032
- Figure 79: Latin America Mobile Collaboration Market Revenue (Million), by Services 2024 & 2032
- Figure 80: Latin America Mobile Collaboration Market Volume (K Unit), by Services 2024 & 2032
- Figure 81: Latin America Mobile Collaboration Market Revenue Share (%), by Services 2024 & 2032
- Figure 82: Latin America Mobile Collaboration Market Volume Share (%), by Services 2024 & 2032
- Figure 83: Latin America Mobile Collaboration Market Revenue (Million), by End-user Industry 2024 & 2032
- Figure 84: Latin America Mobile Collaboration Market Volume (K Unit), by End-user Industry 2024 & 2032
- Figure 85: Latin America Mobile Collaboration Market Revenue Share (%), by End-user Industry 2024 & 2032
- Figure 86: Latin America Mobile Collaboration Market Volume Share (%), by End-user Industry 2024 & 2032
- Figure 87: Latin America Mobile Collaboration Market Revenue (Million), by Country 2024 & 2032
- Figure 88: Latin America Mobile Collaboration Market Volume (K Unit), by Country 2024 & 2032
- Figure 89: Latin America Mobile Collaboration Market Revenue Share (%), by Country 2024 & 2032
- Figure 90: Latin America Mobile Collaboration Market Volume Share (%), by Country 2024 & 2032
- Figure 91: Middle East Mobile Collaboration Market Revenue (Million), by Solution 2024 & 2032
- Figure 92: Middle East Mobile Collaboration Market Volume (K Unit), by Solution 2024 & 2032
- Figure 93: Middle East Mobile Collaboration Market Revenue Share (%), by Solution 2024 & 2032
- Figure 94: Middle East Mobile Collaboration Market Volume Share (%), by Solution 2024 & 2032
- Figure 95: Middle East Mobile Collaboration Market Revenue (Million), by Services 2024 & 2032
- Figure 96: Middle East Mobile Collaboration Market Volume (K Unit), by Services 2024 & 2032
- Figure 97: Middle East Mobile Collaboration Market Revenue Share (%), by Services 2024 & 2032
- Figure 98: Middle East Mobile Collaboration Market Volume Share (%), by Services 2024 & 2032
- Figure 99: Middle East Mobile Collaboration Market Revenue (Million), by End-user Industry 2024 & 2032
- Figure 100: Middle East Mobile Collaboration Market Volume (K Unit), by End-user Industry 2024 & 2032
- Figure 101: Middle East Mobile Collaboration Market Revenue Share (%), by End-user Industry 2024 & 2032
- Figure 102: Middle East Mobile Collaboration Market Volume Share (%), by End-user Industry 2024 & 2032
- Figure 103: Middle East Mobile Collaboration Market Revenue (Million), by Country 2024 & 2032
- Figure 104: Middle East Mobile Collaboration Market Volume (K Unit), by Country 2024 & 2032
- Figure 105: Middle East Mobile Collaboration Market Revenue Share (%), by Country 2024 & 2032
- Figure 106: Middle East Mobile Collaboration Market Volume Share (%), by Country 2024 & 2032
List of Tables
- Table 1: Global Mobile Collaboration Market Revenue Million Forecast, by Region 2019 & 2032
- Table 2: Global Mobile Collaboration Market Volume K Unit Forecast, by Region 2019 & 2032
- Table 3: Global Mobile Collaboration Market Revenue Million Forecast, by Solution 2019 & 2032
- Table 4: Global Mobile Collaboration Market Volume K Unit Forecast, by Solution 2019 & 2032
- Table 5: Global Mobile Collaboration Market Revenue Million Forecast, by Services 2019 & 2032
- Table 6: Global Mobile Collaboration Market Volume K Unit Forecast, by Services 2019 & 2032
- Table 7: Global Mobile Collaboration Market Revenue Million Forecast, by End-user Industry 2019 & 2032
- Table 8: Global Mobile Collaboration Market Volume K Unit Forecast, by End-user Industry 2019 & 2032
- Table 9: Global Mobile Collaboration Market Revenue Million Forecast, by Region 2019 & 2032
- Table 10: Global Mobile Collaboration Market Volume K Unit Forecast, by Region 2019 & 2032
- Table 11: Global Mobile Collaboration Market Revenue Million Forecast, by Country 2019 & 2032
- Table 12: Global Mobile Collaboration Market Volume K Unit Forecast, by Country 2019 & 2032
- Table 13: United States Mobile Collaboration Market Revenue (Million) Forecast, by Application 2019 & 2032
- Table 14: United States Mobile Collaboration Market Volume (K Unit) Forecast, by Application 2019 & 2032
- Table 15: Canada Mobile Collaboration Market Revenue (Million) Forecast, by Application 2019 & 2032
- Table 16: Canada Mobile Collaboration Market Volume (K Unit) Forecast, by Application 2019 & 2032
- Table 17: Mexico Mobile Collaboration Market Revenue (Million) Forecast, by Application 2019 & 2032
- Table 18: Mexico Mobile Collaboration Market Volume (K Unit) Forecast, by Application 2019 & 2032
- Table 19: Global Mobile Collaboration Market Revenue Million Forecast, by Country 2019 & 2032
- Table 20: Global Mobile Collaboration Market Volume K Unit Forecast, by Country 2019 & 2032
- Table 21: Germany Mobile Collaboration Market Revenue (Million) Forecast, by Application 2019 & 2032
- Table 22: Germany Mobile Collaboration Market Volume (K Unit) Forecast, by Application 2019 & 2032
- Table 23: United Kingdom Mobile Collaboration Market Revenue (Million) Forecast, by Application 2019 & 2032
- Table 24: United Kingdom Mobile Collaboration Market Volume (K Unit) Forecast, by Application 2019 & 2032
- Table 25: France Mobile Collaboration Market Revenue (Million) Forecast, by Application 2019 & 2032
- Table 26: France Mobile Collaboration Market Volume (K Unit) Forecast, by Application 2019 & 2032
- Table 27: Spain Mobile Collaboration Market Revenue (Million) Forecast, by Application 2019 & 2032
- Table 28: Spain Mobile Collaboration Market Volume (K Unit) Forecast, by Application 2019 & 2032
- Table 29: Italy Mobile Collaboration Market Revenue (Million) Forecast, by Application 2019 & 2032
- Table 30: Italy Mobile Collaboration Market Volume (K Unit) Forecast, by Application 2019 & 2032
- Table 31: Spain Mobile Collaboration Market Revenue (Million) Forecast, by Application 2019 & 2032
- Table 32: Spain Mobile Collaboration Market Volume (K Unit) Forecast, by Application 2019 & 2032
- Table 33: Belgium Mobile Collaboration Market Revenue (Million) Forecast, by Application 2019 & 2032
- Table 34: Belgium Mobile Collaboration Market Volume (K Unit) Forecast, by Application 2019 & 2032
- Table 35: Netherland Mobile Collaboration Market Revenue (Million) Forecast, by Application 2019 & 2032
- Table 36: Netherland Mobile Collaboration Market Volume (K Unit) Forecast, by Application 2019 & 2032
- Table 37: Nordics Mobile Collaboration Market Revenue (Million) Forecast, by Application 2019 & 2032
- Table 38: Nordics Mobile Collaboration Market Volume (K Unit) Forecast, by Application 2019 & 2032
- Table 39: Rest of Europe Mobile Collaboration Market Revenue (Million) Forecast, by Application 2019 & 2032
- Table 40: Rest of Europe Mobile Collaboration Market Volume (K Unit) Forecast, by Application 2019 & 2032
- Table 41: Global Mobile Collaboration Market Revenue Million Forecast, by Country 2019 & 2032
- Table 42: Global Mobile Collaboration Market Volume K Unit Forecast, by Country 2019 & 2032
- Table 43: China Mobile Collaboration Market Revenue (Million) Forecast, by Application 2019 & 2032
- Table 44: China Mobile Collaboration Market Volume (K Unit) Forecast, by Application 2019 & 2032
- Table 45: Japan Mobile Collaboration Market Revenue (Million) Forecast, by Application 2019 & 2032
- Table 46: Japan Mobile Collaboration Market Volume (K Unit) Forecast, by Application 2019 & 2032
- Table 47: India Mobile Collaboration Market Revenue (Million) Forecast, by Application 2019 & 2032
- Table 48: India Mobile Collaboration Market Volume (K Unit) Forecast, by Application 2019 & 2032
- Table 49: South Korea Mobile Collaboration Market Revenue (Million) Forecast, by Application 2019 & 2032
- Table 50: South Korea Mobile Collaboration Market Volume (K Unit) Forecast, by Application 2019 & 2032
- Table 51: Southeast Asia Mobile Collaboration Market Revenue (Million) Forecast, by Application 2019 & 2032
- Table 52: Southeast Asia Mobile Collaboration Market Volume (K Unit) Forecast, by Application 2019 & 2032
- Table 53: Australia Mobile Collaboration Market Revenue (Million) Forecast, by Application 2019 & 2032
- Table 54: Australia Mobile Collaboration Market Volume (K Unit) Forecast, by Application 2019 & 2032
- Table 55: Indonesia Mobile Collaboration Market Revenue (Million) Forecast, by Application 2019 & 2032
- Table 56: Indonesia Mobile Collaboration Market Volume (K Unit) Forecast, by Application 2019 & 2032
- Table 57: Phillipes Mobile Collaboration Market Revenue (Million) Forecast, by Application 2019 & 2032
- Table 58: Phillipes Mobile Collaboration Market Volume (K Unit) Forecast, by Application 2019 & 2032
- Table 59: Singapore Mobile Collaboration Market Revenue (Million) Forecast, by Application 2019 & 2032
- Table 60: Singapore Mobile Collaboration Market Volume (K Unit) Forecast, by Application 2019 & 2032
- Table 61: Thailandc Mobile Collaboration Market Revenue (Million) Forecast, by Application 2019 & 2032
- Table 62: Thailandc Mobile Collaboration Market Volume (K Unit) Forecast, by Application 2019 & 2032
- Table 63: Rest of Asia Pacific Mobile Collaboration Market Revenue (Million) Forecast, by Application 2019 & 2032
- Table 64: Rest of Asia Pacific Mobile Collaboration Market Volume (K Unit) Forecast, by Application 2019 & 2032
- Table 65: Global Mobile Collaboration Market Revenue Million Forecast, by Country 2019 & 2032
- Table 66: Global Mobile Collaboration Market Volume K Unit Forecast, by Country 2019 & 2032
- Table 67: Brazil Mobile Collaboration Market Revenue (Million) Forecast, by Application 2019 & 2032
- Table 68: Brazil Mobile Collaboration Market Volume (K Unit) Forecast, by Application 2019 & 2032
- Table 69: Argentina Mobile Collaboration Market Revenue (Million) Forecast, by Application 2019 & 2032
- Table 70: Argentina Mobile Collaboration Market Volume (K Unit) Forecast, by Application 2019 & 2032
- Table 71: Peru Mobile Collaboration Market Revenue (Million) Forecast, by Application 2019 & 2032
- Table 72: Peru Mobile Collaboration Market Volume (K Unit) Forecast, by Application 2019 & 2032
- Table 73: Chile Mobile Collaboration Market Revenue (Million) Forecast, by Application 2019 & 2032
- Table 74: Chile Mobile Collaboration Market Volume (K Unit) Forecast, by Application 2019 & 2032
- Table 75: Colombia Mobile Collaboration Market Revenue (Million) Forecast, by Application 2019 & 2032
- Table 76: Colombia Mobile Collaboration Market Volume (K Unit) Forecast, by Application 2019 & 2032
- Table 77: Ecuador Mobile Collaboration Market Revenue (Million) Forecast, by Application 2019 & 2032
- Table 78: Ecuador Mobile Collaboration Market Volume (K Unit) Forecast, by Application 2019 & 2032
- Table 79: Venezuela Mobile Collaboration Market Revenue (Million) Forecast, by Application 2019 & 2032
- Table 80: Venezuela Mobile Collaboration Market Volume (K Unit) Forecast, by Application 2019 & 2032
- Table 81: Rest of South America Mobile Collaboration Market Revenue (Million) Forecast, by Application 2019 & 2032
- Table 82: Rest of South America Mobile Collaboration Market Volume (K Unit) Forecast, by Application 2019 & 2032
- Table 83: Global Mobile Collaboration Market Revenue Million Forecast, by Country 2019 & 2032
- Table 84: Global Mobile Collaboration Market Volume K Unit Forecast, by Country 2019 & 2032
- Table 85: United States Mobile Collaboration Market Revenue (Million) Forecast, by Application 2019 & 2032
- Table 86: United States Mobile Collaboration Market Volume (K Unit) Forecast, by Application 2019 & 2032
- Table 87: Canada Mobile Collaboration Market Revenue (Million) Forecast, by Application 2019 & 2032
- Table 88: Canada Mobile Collaboration Market Volume (K Unit) Forecast, by Application 2019 & 2032
- Table 89: Mexico Mobile Collaboration Market Revenue (Million) Forecast, by Application 2019 & 2032
- Table 90: Mexico Mobile Collaboration Market Volume (K Unit) Forecast, by Application 2019 & 2032
- Table 91: Global Mobile Collaboration Market Revenue Million Forecast, by Country 2019 & 2032
- Table 92: Global Mobile Collaboration Market Volume K Unit Forecast, by Country 2019 & 2032
- Table 93: United Arab Emirates Mobile Collaboration Market Revenue (Million) Forecast, by Application 2019 & 2032
- Table 94: United Arab Emirates Mobile Collaboration Market Volume (K Unit) Forecast, by Application 2019 & 2032
- Table 95: Saudi Arabia Mobile Collaboration Market Revenue (Million) Forecast, by Application 2019 & 2032
- Table 96: Saudi Arabia Mobile Collaboration Market Volume (K Unit) Forecast, by Application 2019 & 2032
- Table 97: South Africa Mobile Collaboration Market Revenue (Million) Forecast, by Application 2019 & 2032
- Table 98: South Africa Mobile Collaboration Market Volume (K Unit) Forecast, by Application 2019 & 2032
- Table 99: Rest of Middle East and Africa Mobile Collaboration Market Revenue (Million) Forecast, by Application 2019 & 2032
- Table 100: Rest of Middle East and Africa Mobile Collaboration Market Volume (K Unit) Forecast, by Application 2019 & 2032
- Table 101: Global Mobile Collaboration Market Revenue Million Forecast, by Solution 2019 & 2032
- Table 102: Global Mobile Collaboration Market Volume K Unit Forecast, by Solution 2019 & 2032
- Table 103: Global Mobile Collaboration Market Revenue Million Forecast, by Services 2019 & 2032
- Table 104: Global Mobile Collaboration Market Volume K Unit Forecast, by Services 2019 & 2032
- Table 105: Global Mobile Collaboration Market Revenue Million Forecast, by End-user Industry 2019 & 2032
- Table 106: Global Mobile Collaboration Market Volume K Unit Forecast, by End-user Industry 2019 & 2032
- Table 107: Global Mobile Collaboration Market Revenue Million Forecast, by Country 2019 & 2032
- Table 108: Global Mobile Collaboration Market Volume K Unit Forecast, by Country 2019 & 2032
- Table 109: Global Mobile Collaboration Market Revenue Million Forecast, by Solution 2019 & 2032
- Table 110: Global Mobile Collaboration Market Volume K Unit Forecast, by Solution 2019 & 2032
- Table 111: Global Mobile Collaboration Market Revenue Million Forecast, by Services 2019 & 2032
- Table 112: Global Mobile Collaboration Market Volume K Unit Forecast, by Services 2019 & 2032
- Table 113: Global Mobile Collaboration Market Revenue Million Forecast, by End-user Industry 2019 & 2032
- Table 114: Global Mobile Collaboration Market Volume K Unit Forecast, by End-user Industry 2019 & 2032
- Table 115: Global Mobile Collaboration Market Revenue Million Forecast, by Country 2019 & 2032
- Table 116: Global Mobile Collaboration Market Volume K Unit Forecast, by Country 2019 & 2032
- Table 117: Global Mobile Collaboration Market Revenue Million Forecast, by Solution 2019 & 2032
- Table 118: Global Mobile Collaboration Market Volume K Unit Forecast, by Solution 2019 & 2032
- Table 119: Global Mobile Collaboration Market Revenue Million Forecast, by Services 2019 & 2032
- Table 120: Global Mobile Collaboration Market Volume K Unit Forecast, by Services 2019 & 2032
- Table 121: Global Mobile Collaboration Market Revenue Million Forecast, by End-user Industry 2019 & 2032
- Table 122: Global Mobile Collaboration Market Volume K Unit Forecast, by End-user Industry 2019 & 2032
- Table 123: Global Mobile Collaboration Market Revenue Million Forecast, by Country 2019 & 2032
- Table 124: Global Mobile Collaboration Market Volume K Unit Forecast, by Country 2019 & 2032
- Table 125: Global Mobile Collaboration Market Revenue Million Forecast, by Solution 2019 & 2032
- Table 126: Global Mobile Collaboration Market Volume K Unit Forecast, by Solution 2019 & 2032
- Table 127: Global Mobile Collaboration Market Revenue Million Forecast, by Services 2019 & 2032
- Table 128: Global Mobile Collaboration Market Volume K Unit Forecast, by Services 2019 & 2032
- Table 129: Global Mobile Collaboration Market Revenue Million Forecast, by End-user Industry 2019 & 2032
- Table 130: Global Mobile Collaboration Market Volume K Unit Forecast, by End-user Industry 2019 & 2032
- Table 131: Global Mobile Collaboration Market Revenue Million Forecast, by Country 2019 & 2032
- Table 132: Global Mobile Collaboration Market Volume K Unit Forecast, by Country 2019 & 2032
- Table 133: Global Mobile Collaboration Market Revenue Million Forecast, by Solution 2019 & 2032
- Table 134: Global Mobile Collaboration Market Volume K Unit Forecast, by Solution 2019 & 2032
- Table 135: Global Mobile Collaboration Market Revenue Million Forecast, by Services 2019 & 2032
- Table 136: Global Mobile Collaboration Market Volume K Unit Forecast, by Services 2019 & 2032
- Table 137: Global Mobile Collaboration Market Revenue Million Forecast, by End-user Industry 2019 & 2032
- Table 138: Global Mobile Collaboration Market Volume K Unit Forecast, by End-user Industry 2019 & 2032
- Table 139: Global Mobile Collaboration Market Revenue Million Forecast, by Country 2019 & 2032
- Table 140: Global Mobile Collaboration Market Volume K Unit Forecast, by Country 2019 & 2032
Frequently Asked Questions
1. What is the projected Compound Annual Growth Rate (CAGR) of the Mobile Collaboration Market?
The projected CAGR is approximately 11.29%.
2. Which companies are prominent players in the Mobile Collaboration Market?
Key companies in the market include IBM Corporation, Cisco Systems Inc, Siemens AG, Microsoft Corporation, Avaya Inc, NEC Corporation, Oracle Corporation, Ribbon Communications LLC, Alcatel-Lucent SA.
3. What are the main segments of the Mobile Collaboration Market?
The market segments include Solution, Services, End-user Industry.
4. Can you provide details about the market size?
The market size is estimated to be USD 61.01 Million as of 2022.
5. What are some drivers contributing to market growth?
Increased Demand for BYOD Applications; Growing Smart Devices Sales.
6. What are the notable trends driving market growth?
Retail Segment is Expected to Witness High Growth.
7. Are there any restraints impacting market growth?
Security Concerns to Challenge the Market Growth.
8. Can you provide examples of recent developments in the market?
N/A
9. What pricing options are available for accessing the report?
Pricing options include single-user, multi-user, and enterprise licenses priced at USD 4750, USD 5250, and USD 8750 respectively.
10. Is the market size provided in terms of value or volume?
The market size is provided in terms of value, measured in Million and volume, measured in K Unit.
11. Are there any specific market keywords associated with the report?
Yes, the market keyword associated with the report is "Mobile Collaboration Market," which aids in identifying and referencing the specific market segment covered.
12. How do I determine which pricing option suits my needs best?
The pricing options vary based on user requirements and access needs. Individual users may opt for single-user licenses, while businesses requiring broader access may choose multi-user or enterprise licenses for cost-effective access to the report.
13. Are there any additional resources or data provided in the Mobile Collaboration Market report?
While the report offers comprehensive insights, it's advisable to review the specific contents or supplementary materials provided to ascertain if additional resources or data are available.
14. How can I stay updated on further developments or reports in the Mobile Collaboration Market?
To stay informed about further developments, trends, and reports in the Mobile Collaboration Market, consider subscribing to industry newsletters, following relevant companies and organizations, or regularly checking reputable industry news sources and publications.
Methodology
Step 1 - Identification of Relevant Samples Size from Population Database


Step 2 - Approaches for Defining Global Market Size (Value, Volume* & Price*)

Note*: In applicable scenarios
Step 3 - Data Sources
Primary Research
- Web Analytics
- Survey Reports
- Research Institute
- Latest Research Reports
- Opinion Leaders
Secondary Research
- Annual Reports
- White Paper
- Latest Press Release
- Industry Association
- Paid Database
- Investor Presentations

Step 4 - Data Triangulation
Involves using different sources of information in order to increase the validity of a study
These sources are likely to be stakeholders in a program - participants, other researchers, program staff, other community members, and so on.
Then we put all data in single framework & apply various statistical tools to find out the dynamic on the market.
During the analysis stage, feedback from the stakeholder groups would be compared to determine areas of agreement as well as areas of divergence


