Opportunities in Emerging Rubber Testing Equipment Market Industry Markets

Rubber Testing Equipment Market by Type of Testing (Density Testing, Viscocity Testing, Hardness Testing, Flex Testing, Other Types of Testing), by End-user Application (Tire, General Rubber Goods, Industrial Rubber Products, General Polymer, Compound), by North America, by Europe, by Asia, by Australia and New Zealand, by Latin America, by Middle East and Africa Forecast 2025-2033

Jun 27 2025
Base Year: 2024

234 Pages
Main Logo

Opportunities in Emerging Rubber Testing Equipment Market Industry Markets


Home
Industries
Technology, Media and Telecom
sponsor image
sponsor image
sponsor image
sponsor image
sponsor image
sponsor image
sponsor image
sponsor image
sponsor image
sponsor image
sponsor image
sponsor image
sponsor image
sponsor image
sponsor image
sponsor image
sponsor image
sponsor image
sponsor image
sponsor image

Tailored for you

  • In-depth Analysis Tailored to Specified Regions or Segments
  • Company Profiles Customized to User Preferences
  • Comprehensive Insights Focused on Specific Segments or Regions
  • Customized Evaluation of Competitive Landscape to Meet Your Needs
  • Tailored Customization to Address Other Specific Requirements
Ask for customization


Key Insights

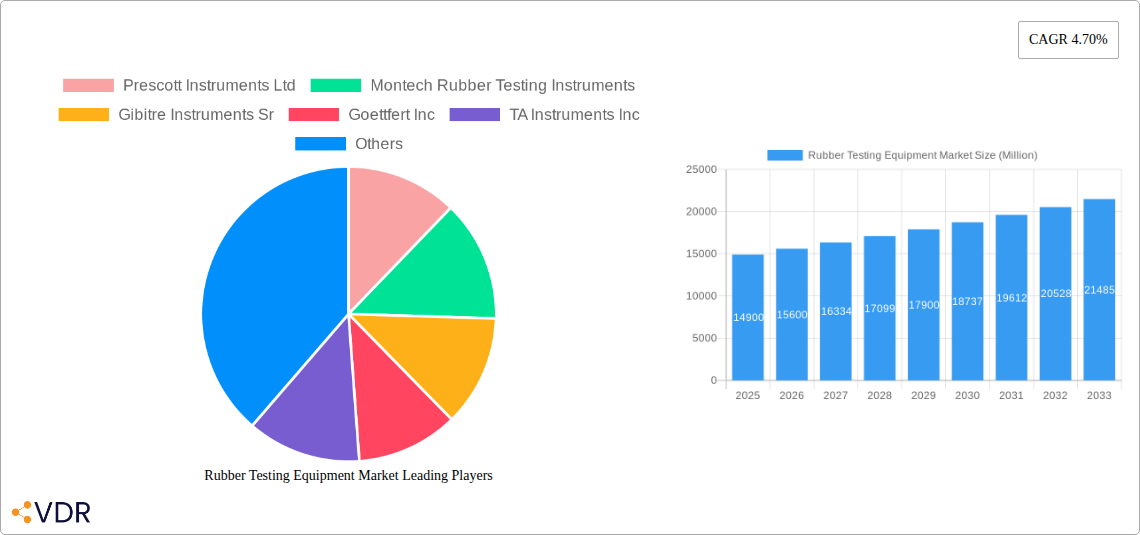
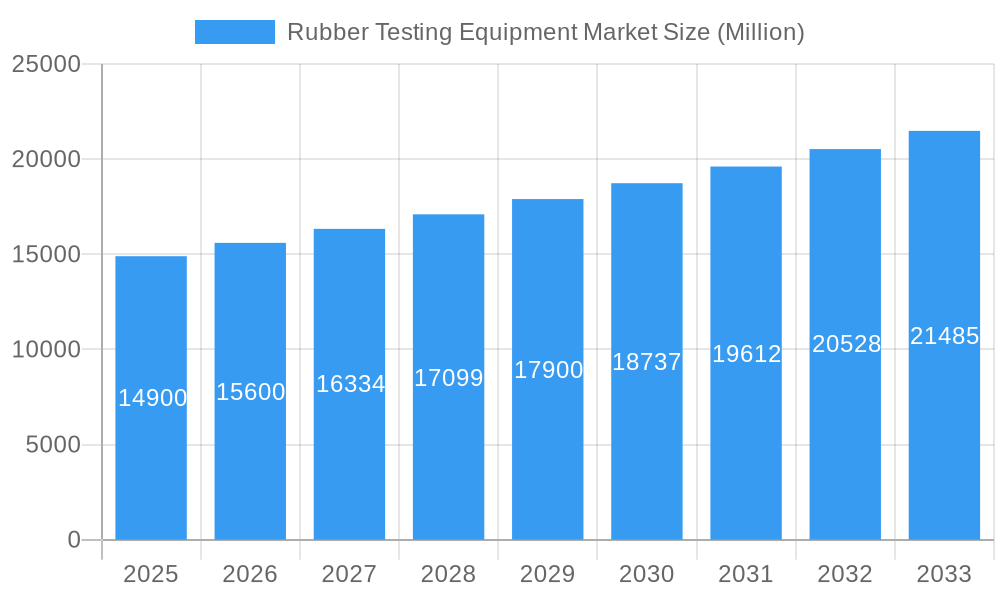
The global rubber testing equipment market, valued at $14.90 billion in 2025, is projected to experience robust growth, driven by a compound annual growth rate (CAGR) of 4.70% from 2025 to 2033. This expansion is fueled by several key factors. Firstly, the burgeoning automotive industry, particularly the increasing demand for high-performance tires, necessitates rigorous quality control and testing, significantly boosting the market for rubber testing equipment. Secondly, the growth in the construction and infrastructure sectors, reliant on durable rubber products, further fuels demand. Advancements in testing technologies, such as automated and non-destructive testing methods, are enhancing efficiency and accuracy, leading to wider adoption. Finally, stringent regulatory standards and safety regulations governing the use of rubber in various applications are driving manufacturers to invest in advanced testing capabilities. The market is segmented by testing type (density, viscosity, hardness, flex, and others) and end-user application (tires, general rubber goods, industrial rubber products, and general polymers/compounds). The Asia-Pacific region, particularly China and India, is expected to witness significant growth due to rapid industrialization and expanding manufacturing sectors. However, high initial investment costs for advanced equipment and the availability of relatively cheaper alternatives in some regions might pose challenges to the market's overall growth.

The competitive landscape is characterized by a mix of established players and emerging companies. Key players such as Prescott Instruments Ltd, Montech Rubber Testing Instruments, and TA Instruments Inc. are focusing on product innovation and expansion into new markets to maintain their market share. The increasing adoption of sophisticated testing equipment in research and development activities within the rubber industry is also contributing to market expansion. Moreover, the rising awareness of material quality and safety is further driving the demand for accurate and reliable rubber testing equipment. Geographical expansion strategies, strategic partnerships, and mergers and acquisitions are expected to be key growth strategies for companies operating within this market. The forecast period of 2025-2033 presents significant opportunities for growth, particularly for companies offering customized solutions and advanced testing technologies tailored to the specific needs of various end-user industries.

Rubber Testing Equipment Market Research Report - Market Size, Growth & Forecast

Rubber Testing Equipment Market: A Comprehensive Report (2019-2033)

This in-depth report provides a comprehensive analysis of the Rubber Testing Equipment market, encompassing market dynamics, growth trends, regional dominance, product landscape, challenges, opportunities, and key players. The report covers the period 2019-2033, with a base year of 2025 and a forecast period of 2025-2033. The market is segmented by type of testing (Density, Viscosity, Hardness, Flex, and Other) and end-user application (Tire, General Rubber Goods, Industrial Rubber Products, General Polymer, and Compound). The total market size is projected to reach xx Million by 2033.

Parent Market: Materials Testing Equipment Market Child Market: Polymer Testing Equipment Market

Rubber Testing Equipment Market Dynamics & Structure

The Rubber Testing Equipment market is characterized by a moderately consolidated structure with several key players holding significant market shares. Technological innovation, particularly in automated testing and data analysis, is a key driver. Stringent regulatory frameworks governing material safety and quality further influence market growth. Competition from substitute materials and testing methods presents a challenge, while M&A activity is expected to remain relatively moderate.

  • Market Concentration: Moderately Consolidated (xx% market share held by top 5 players in 2024)
  • Technological Innovation Drivers: Automation, AI-powered analysis, miniaturization
  • Regulatory Frameworks: Safety standards (e.g., ISO, ASTM), quality control regulations
  • Competitive Product Substitutes: Alternative testing methods, material innovations
  • End-User Demographics: Growing demand from automotive, industrial, and consumer goods sectors
  • M&A Trends: Consolidation expected to continue at a moderate pace, with xx M&A deals projected between 2025-2033.

Rubber Testing Equipment Market Growth Trends & Insights

The Rubber Testing Equipment market exhibited steady growth during the historical period (2019-2024), driven by increasing demand from the automotive and industrial sectors. The market is projected to witness a CAGR of xx% during the forecast period (2025-2033). Technological advancements, particularly in automation and advanced materials, are accelerating market adoption. Consumer behavior shifts towards higher quality and safety standards further contribute to market expansion. Market penetration is expected to reach xx% by 2033. The rising adoption of sustainable rubber materials will create new opportunities and drive growth.

Rubber Testing Equipment Market Growth

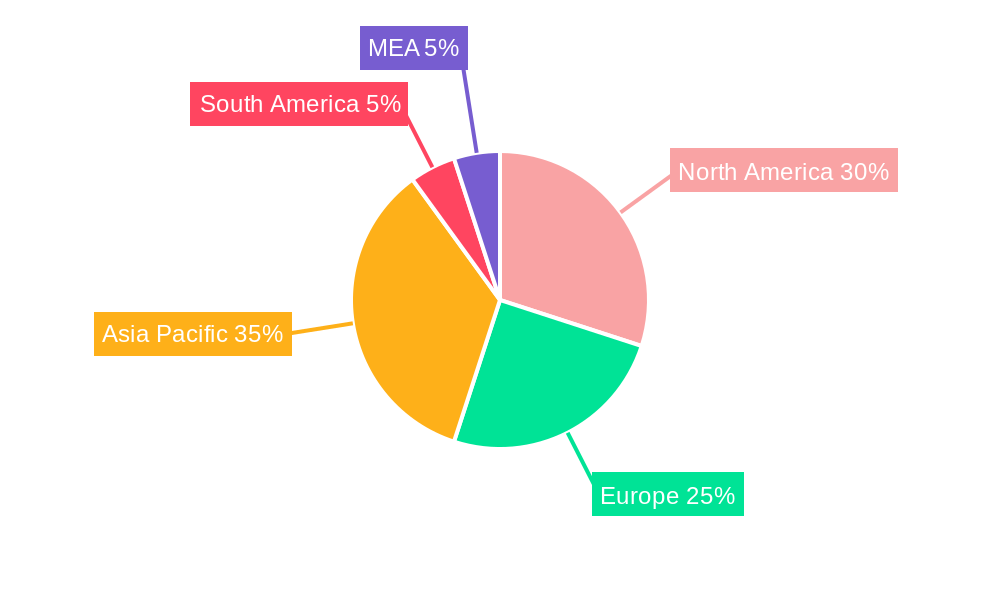
Dominant Regions, Countries, or Segments in Rubber Testing Equipment Market

North America currently holds the largest market share, driven by strong demand from the automotive and industrial sectors and the presence of major equipment manufacturers. Asia Pacific is expected to witness significant growth, fueled by rapid industrialization and expanding automotive production. Within the segments, Hardness Testing holds the largest market share, followed by Density Testing.

By Type of Testing:

  • Hardness Testing: Dominant segment, driven by high demand for quality control in tire and rubber goods manufacturing.
  • Density Testing: Significant growth due to increased focus on material consistency and performance.
  • Viscosity Testing: Steady growth, supported by advancements in automated viscosity measurement.
  • Flex Testing: Moderate growth driven by demand for durability testing in various applications.

By End-user Application:

  • Tire Industry: Largest segment due to high volume production and stringent quality control requirements.
  • Industrial Rubber Products: Significant growth projected, driven by increasing industrialization.

Rubber Testing Equipment Market Product Landscape

The market offers a diverse range of products, including density testers, viscometers, hardness testers, and flex testers. Recent innovations focus on improved accuracy, automation, and data analysis capabilities. Many manufacturers offer customized solutions tailored to specific industry needs. Unique selling propositions often center around ease of use, high precision, and comprehensive data management software.

Key Drivers, Barriers & Challenges in Rubber Testing Equipment Market

Key Drivers:

  • Rising demand for high-quality rubber products across various industries.
  • Stringent quality control regulations and safety standards.
  • Technological advancements in testing methods and equipment.

Key Barriers & Challenges:

  • High initial investment costs for advanced equipment.
  • Limited technical expertise in some regions.
  • Competition from low-cost manufacturers.
  • Supply chain disruptions (xx% impact on market growth in 2022)

Emerging Opportunities in Rubber Testing Equipment Market

  • Growing demand for sustainable and eco-friendly rubber materials is opening new avenues for specialized testing equipment.
  • The increasing adoption of smart factories and Industry 4.0 technologies is creating opportunities for integrated testing solutions.
  • Expanding applications in new industries, such as renewable energy and medical devices, are generating new demand.

Growth Accelerators in the Rubber Testing Equipment Market Industry

Strategic partnerships between equipment manufacturers and materials suppliers are driving market growth. Furthermore, technological breakthroughs in materials science and testing methodologies continue to push innovation forward. The expansion into new and untapped markets, particularly in developing economies, offers significant growth potential.

Key Players Shaping the Rubber Testing Equipment Market Market

  • Prescott Instruments Ltd
  • Montech Rubber Testing Instruments
  • Gibitre Instruments Sr
  • Goettfert Inc
  • TA Instruments Inc
  • Alpha Technologies
  • U-Can Dynatex Inc
  • Norka Instruments Sanghai Ltd
  • Ektron Tek Co Ltd
  • Gotech Testing Machines

Notable Milestones in Rubber Testing Equipment Market Sector

  • 2022 (Q3): Goettfert Inc. launched a new automated hardness tester.
  • 2021 (Q4): TA Instruments Inc. acquired a smaller competitor, expanding its product portfolio.
  • 2020 (Q1): Prescott Instruments Ltd. introduced a new software platform for data analysis.
  • 2019 (Q2): Increased focus on digitalization and remote testing capability.

In-Depth Rubber Testing Equipment Market Market Outlook

The Rubber Testing Equipment market is poised for continued growth, driven by technological advancements, increasing demand from key end-user industries, and the expansion into new markets. Strategic partnerships and investments in R&D will further propel market expansion. The focus on automation, data analytics, and sustainable materials will shape the future of the market, presenting significant opportunities for innovative players.

Rubber Testing Equipment Market Segmentation

  • 1. Type of Testing
    • 1.1. Density Testing
    • 1.2. Viscocity Testing
    • 1.3. Hardness Testing
    • 1.4. Flex Testing
    • 1.5. Other Types of Testing
  • 2. End-user Application
    • 2.1. Tire
    • 2.2. General Rubber Goods
    • 2.3. Industrial Rubber Products
    • 2.4. General Polymer
    • 2.5. Compound

Rubber Testing Equipment Market Segmentation By Geography

  • 1. North America
  • 2. Europe
  • 3. Asia
  • 4. Australia and New Zealand
  • 5. Latin America
  • 6. Middle East and Africa
Rubber Testing Equipment Market Regional Share


Rubber Testing Equipment Market REPORT HIGHLIGHTS

AspectsDetails
Study Period 2019-2033
Base Year 2024
Estimated Year 2025
Forecast Period2025-2033
Historical Period2019-2024
Growth RateCAGR of 4.70% from 2019-2033
Segmentation
    • By Type of Testing
      • Density Testing
      • Viscocity Testing
      • Hardness Testing
      • Flex Testing
      • Other Types of Testing
    • By End-user Application
      • Tire
      • General Rubber Goods
      • Industrial Rubber Products
      • General Polymer
      • Compound
  • By Geography
    • North America
    • Europe
    • Asia
    • Australia and New Zealand
    • Latin America
    • Middle East and Africa


Table of Contents

  1. 1. Introduction
    • 1.1. Research Scope
    • 1.2. Market Segmentation
    • 1.3. Research Methodology
    • 1.4. Definitions and Assumptions
  2. 2. Executive Summary
    • 2.1. Introduction
  3. 3. Market Dynamics
    • 3.1. Introduction
      • 3.2. Market Drivers
        • 3.2.1. Growing Demand for Durable Goods; Technological Advancements in Rubber Testing
      • 3.3. Market Restrains
        • 3.3.1. High Cost of Ownership
      • 3.4. Market Trends
        • 3.4.1. The Rising Demand for Tires to Drive the Market
  4. 4. Market Factor Analysis
    • 4.1. Porters Five Forces
    • 4.2. Supply/Value Chain
    • 4.3. PESTEL analysis
    • 4.4. Market Entropy
    • 4.5. Patent/Trademark Analysis
  5. 5. Global Rubber Testing Equipment Market Analysis, Insights and Forecast, 2019-2031
    • 5.1. Market Analysis, Insights and Forecast - by Type of Testing
      • 5.1.1. Density Testing
      • 5.1.2. Viscocity Testing
      • 5.1.3. Hardness Testing
      • 5.1.4. Flex Testing
      • 5.1.5. Other Types of Testing
    • 5.2. Market Analysis, Insights and Forecast - by End-user Application
      • 5.2.1. Tire
      • 5.2.2. General Rubber Goods
      • 5.2.3. Industrial Rubber Products
      • 5.2.4. General Polymer
      • 5.2.5. Compound
    • 5.3. Market Analysis, Insights and Forecast - by Region
      • 5.3.1. North America
      • 5.3.2. Europe
      • 5.3.3. Asia
      • 5.3.4. Australia and New Zealand
      • 5.3.5. Latin America
      • 5.3.6. Middle East and Africa
  6. 6. North America Rubber Testing Equipment Market Analysis, Insights and Forecast, 2019-2031
    • 6.1. Market Analysis, Insights and Forecast - by Type of Testing
      • 6.1.1. Density Testing
      • 6.1.2. Viscocity Testing
      • 6.1.3. Hardness Testing
      • 6.1.4. Flex Testing
      • 6.1.5. Other Types of Testing
    • 6.2. Market Analysis, Insights and Forecast - by End-user Application
      • 6.2.1. Tire
      • 6.2.2. General Rubber Goods
      • 6.2.3. Industrial Rubber Products
      • 6.2.4. General Polymer
      • 6.2.5. Compound
  7. 7. Europe Rubber Testing Equipment Market Analysis, Insights and Forecast, 2019-2031
    • 7.1. Market Analysis, Insights and Forecast - by Type of Testing
      • 7.1.1. Density Testing
      • 7.1.2. Viscocity Testing
      • 7.1.3. Hardness Testing
      • 7.1.4. Flex Testing
      • 7.1.5. Other Types of Testing
    • 7.2. Market Analysis, Insights and Forecast - by End-user Application
      • 7.2.1. Tire
      • 7.2.2. General Rubber Goods
      • 7.2.3. Industrial Rubber Products
      • 7.2.4. General Polymer
      • 7.2.5. Compound
  8. 8. Asia Rubber Testing Equipment Market Analysis, Insights and Forecast, 2019-2031
    • 8.1. Market Analysis, Insights and Forecast - by Type of Testing
      • 8.1.1. Density Testing
      • 8.1.2. Viscocity Testing
      • 8.1.3. Hardness Testing
      • 8.1.4. Flex Testing
      • 8.1.5. Other Types of Testing
    • 8.2. Market Analysis, Insights and Forecast - by End-user Application
      • 8.2.1. Tire
      • 8.2.2. General Rubber Goods
      • 8.2.3. Industrial Rubber Products
      • 8.2.4. General Polymer
      • 8.2.5. Compound
  9. 9. Australia and New Zealand Rubber Testing Equipment Market Analysis, Insights and Forecast, 2019-2031
    • 9.1. Market Analysis, Insights and Forecast - by Type of Testing
      • 9.1.1. Density Testing
      • 9.1.2. Viscocity Testing
      • 9.1.3. Hardness Testing
      • 9.1.4. Flex Testing
      • 9.1.5. Other Types of Testing
    • 9.2. Market Analysis, Insights and Forecast - by End-user Application
      • 9.2.1. Tire
      • 9.2.2. General Rubber Goods
      • 9.2.3. Industrial Rubber Products
      • 9.2.4. General Polymer
      • 9.2.5. Compound
  10. 10. Latin America Rubber Testing Equipment Market Analysis, Insights and Forecast, 2019-2031
    • 10.1. Market Analysis, Insights and Forecast - by Type of Testing
      • 10.1.1. Density Testing
      • 10.1.2. Viscocity Testing
      • 10.1.3. Hardness Testing
      • 10.1.4. Flex Testing
      • 10.1.5. Other Types of Testing
    • 10.2. Market Analysis, Insights and Forecast - by End-user Application
      • 10.2.1. Tire
      • 10.2.2. General Rubber Goods
      • 10.2.3. Industrial Rubber Products
      • 10.2.4. General Polymer
      • 10.2.5. Compound
  11. 11. Middle East and Africa Rubber Testing Equipment Market Analysis, Insights and Forecast, 2019-2031
    • 11.1. Market Analysis, Insights and Forecast - by Type of Testing
      • 11.1.1. Density Testing
      • 11.1.2. Viscocity Testing
      • 11.1.3. Hardness Testing
      • 11.1.4. Flex Testing
      • 11.1.5. Other Types of Testing
    • 11.2. Market Analysis, Insights and Forecast - by End-user Application
      • 11.2.1. Tire
      • 11.2.2. General Rubber Goods
      • 11.2.3. Industrial Rubber Products
      • 11.2.4. General Polymer
      • 11.2.5. Compound
  12. 12. North America Rubber Testing Equipment Market Analysis, Insights and Forecast, 2019-2031
      • 12.1. Market Analysis, Insights and Forecast - By Country/Sub-region
        • 12.1.1 United States
        • 12.1.2 Canada
        • 12.1.3 Mexico
  13. 13. Europe Rubber Testing Equipment Market Analysis, Insights and Forecast, 2019-2031
      • 13.1. Market Analysis, Insights and Forecast - By Country/Sub-region
        • 13.1.1 Germany
        • 13.1.2 United Kingdom
        • 13.1.3 France
        • 13.1.4 Spain
        • 13.1.5 Italy
        • 13.1.6 Spain
        • 13.1.7 Belgium
        • 13.1.8 Netherland
        • 13.1.9 Nordics
        • 13.1.10 Rest of Europe
  14. 14. Asia Pacific Rubber Testing Equipment Market Analysis, Insights and Forecast, 2019-2031
      • 14.1. Market Analysis, Insights and Forecast - By Country/Sub-region
        • 14.1.1 China
        • 14.1.2 Japan
        • 14.1.3 India
        • 14.1.4 South Korea
        • 14.1.5 Southeast Asia
        • 14.1.6 Australia
        • 14.1.7 Indonesia
        • 14.1.8 Phillipes
        • 14.1.9 Singapore
        • 14.1.10 Thailandc
        • 14.1.11 Rest of Asia Pacific
  15. 15. South America Rubber Testing Equipment Market Analysis, Insights and Forecast, 2019-2031
      • 15.1. Market Analysis, Insights and Forecast - By Country/Sub-region
        • 15.1.1 Brazil
        • 15.1.2 Argentina
        • 15.1.3 Peru
        • 15.1.4 Chile
        • 15.1.5 Colombia
        • 15.1.6 Ecuador
        • 15.1.7 Venezuela
        • 15.1.8 Rest of South America
  16. 16. North America Rubber Testing Equipment Market Analysis, Insights and Forecast, 2019-2031
      • 16.1. Market Analysis, Insights and Forecast - By Country/Sub-region
        • 16.1.1 United States
        • 16.1.2 Canada
        • 16.1.3 Mexico
  17. 17. MEA Rubber Testing Equipment Market Analysis, Insights and Forecast, 2019-2031
      • 17.1. Market Analysis, Insights and Forecast - By Country/Sub-region
        • 17.1.1 United Arab Emirates
        • 17.1.2 Saudi Arabia
        • 17.1.3 South Africa
        • 17.1.4 Rest of Middle East and Africa
  18. 18. Competitive Analysis
    • 18.1. Global Market Share Analysis 2024
      • 18.2. Company Profiles
        • 18.2.1 Prescott Instruments Ltd
          • 18.2.1.1. Overview
          • 18.2.1.2. Products
          • 18.2.1.3. SWOT Analysis
          • 18.2.1.4. Recent Developments
          • 18.2.1.5. Financials (Based on Availability)
        • 18.2.2 Montech Rubber Testing Instruments
          • 18.2.2.1. Overview
          • 18.2.2.2. Products
          • 18.2.2.3. SWOT Analysis
          • 18.2.2.4. Recent Developments
          • 18.2.2.5. Financials (Based on Availability)
        • 18.2.3 Gibitre Instruments Sr
          • 18.2.3.1. Overview
          • 18.2.3.2. Products
          • 18.2.3.3. SWOT Analysis
          • 18.2.3.4. Recent Developments
          • 18.2.3.5. Financials (Based on Availability)
        • 18.2.4 Goettfert Inc
          • 18.2.4.1. Overview
          • 18.2.4.2. Products
          • 18.2.4.3. SWOT Analysis
          • 18.2.4.4. Recent Developments
          • 18.2.4.5. Financials (Based on Availability)
        • 18.2.5 TA Instruments Inc
          • 18.2.5.1. Overview
          • 18.2.5.2. Products
          • 18.2.5.3. SWOT Analysis
          • 18.2.5.4. Recent Developments
          • 18.2.5.5. Financials (Based on Availability)
        • 18.2.6 Alpha Technologies
          • 18.2.6.1. Overview
          • 18.2.6.2. Products
          • 18.2.6.3. SWOT Analysis
          • 18.2.6.4. Recent Developments
          • 18.2.6.5. Financials (Based on Availability)
        • 18.2.7 U-Can Dynatex Inc
          • 18.2.7.1. Overview
          • 18.2.7.2. Products
          • 18.2.7.3. SWOT Analysis
          • 18.2.7.4. Recent Developments
          • 18.2.7.5. Financials (Based on Availability)
        • 18.2.8 Norka Instruments Sanghai Ltd
          • 18.2.8.1. Overview
          • 18.2.8.2. Products
          • 18.2.8.3. SWOT Analysis
          • 18.2.8.4. Recent Developments
          • 18.2.8.5. Financials (Based on Availability)
        • 18.2.9 Ektron Tek Co Ltd
          • 18.2.9.1. Overview
          • 18.2.9.2. Products
          • 18.2.9.3. SWOT Analysis
          • 18.2.9.4. Recent Developments
          • 18.2.9.5. Financials (Based on Availability)
        • 18.2.10 Gotech Testing Machines
          • 18.2.10.1. Overview
          • 18.2.10.2. Products
          • 18.2.10.3. SWOT Analysis
          • 18.2.10.4. Recent Developments
          • 18.2.10.5. Financials (Based on Availability)

List of Figures

  1. Figure 1: Global Rubber Testing Equipment Market Revenue Breakdown (Million, %) by Region 2024 & 2032
  2. Figure 2: Global Rubber Testing Equipment Market Volume Breakdown (K Unit, %) by Region 2024 & 2032
  3. Figure 3: North America Rubber Testing Equipment Market Revenue (Million), by Country 2024 & 2032
  4. Figure 4: North America Rubber Testing Equipment Market Volume (K Unit), by Country 2024 & 2032
  5. Figure 5: North America Rubber Testing Equipment Market Revenue Share (%), by Country 2024 & 2032
  6. Figure 6: North America Rubber Testing Equipment Market Volume Share (%), by Country 2024 & 2032
  7. Figure 7: Europe Rubber Testing Equipment Market Revenue (Million), by Country 2024 & 2032
  8. Figure 8: Europe Rubber Testing Equipment Market Volume (K Unit), by Country 2024 & 2032
  9. Figure 9: Europe Rubber Testing Equipment Market Revenue Share (%), by Country 2024 & 2032
  10. Figure 10: Europe Rubber Testing Equipment Market Volume Share (%), by Country 2024 & 2032
  11. Figure 11: Asia Pacific Rubber Testing Equipment Market Revenue (Million), by Country 2024 & 2032
  12. Figure 12: Asia Pacific Rubber Testing Equipment Market Volume (K Unit), by Country 2024 & 2032
  13. Figure 13: Asia Pacific Rubber Testing Equipment Market Revenue Share (%), by Country 2024 & 2032
  14. Figure 14: Asia Pacific Rubber Testing Equipment Market Volume Share (%), by Country 2024 & 2032
  15. Figure 15: South America Rubber Testing Equipment Market Revenue (Million), by Country 2024 & 2032
  16. Figure 16: South America Rubber Testing Equipment Market Volume (K Unit), by Country 2024 & 2032
  17. Figure 17: South America Rubber Testing Equipment Market Revenue Share (%), by Country 2024 & 2032
  18. Figure 18: South America Rubber Testing Equipment Market Volume Share (%), by Country 2024 & 2032
  19. Figure 19: North America Rubber Testing Equipment Market Revenue (Million), by Country 2024 & 2032
  20. Figure 20: North America Rubber Testing Equipment Market Volume (K Unit), by Country 2024 & 2032
  21. Figure 21: North America Rubber Testing Equipment Market Revenue Share (%), by Country 2024 & 2032
  22. Figure 22: North America Rubber Testing Equipment Market Volume Share (%), by Country 2024 & 2032
  23. Figure 23: MEA Rubber Testing Equipment Market Revenue (Million), by Country 2024 & 2032
  24. Figure 24: MEA Rubber Testing Equipment Market Volume (K Unit), by Country 2024 & 2032
  25. Figure 25: MEA Rubber Testing Equipment Market Revenue Share (%), by Country 2024 & 2032
  26. Figure 26: MEA Rubber Testing Equipment Market Volume Share (%), by Country 2024 & 2032
  27. Figure 27: North America Rubber Testing Equipment Market Revenue (Million), by Type of Testing 2024 & 2032
  28. Figure 28: North America Rubber Testing Equipment Market Volume (K Unit), by Type of Testing 2024 & 2032
  29. Figure 29: North America Rubber Testing Equipment Market Revenue Share (%), by Type of Testing 2024 & 2032
  30. Figure 30: North America Rubber Testing Equipment Market Volume Share (%), by Type of Testing 2024 & 2032
  31. Figure 31: North America Rubber Testing Equipment Market Revenue (Million), by End-user Application 2024 & 2032
  32. Figure 32: North America Rubber Testing Equipment Market Volume (K Unit), by End-user Application 2024 & 2032
  33. Figure 33: North America Rubber Testing Equipment Market Revenue Share (%), by End-user Application 2024 & 2032
  34. Figure 34: North America Rubber Testing Equipment Market Volume Share (%), by End-user Application 2024 & 2032
  35. Figure 35: North America Rubber Testing Equipment Market Revenue (Million), by Country 2024 & 2032
  36. Figure 36: North America Rubber Testing Equipment Market Volume (K Unit), by Country 2024 & 2032
  37. Figure 37: North America Rubber Testing Equipment Market Revenue Share (%), by Country 2024 & 2032
  38. Figure 38: North America Rubber Testing Equipment Market Volume Share (%), by Country 2024 & 2032
  39. Figure 39: Europe Rubber Testing Equipment Market Revenue (Million), by Type of Testing 2024 & 2032
  40. Figure 40: Europe Rubber Testing Equipment Market Volume (K Unit), by Type of Testing 2024 & 2032
  41. Figure 41: Europe Rubber Testing Equipment Market Revenue Share (%), by Type of Testing 2024 & 2032
  42. Figure 42: Europe Rubber Testing Equipment Market Volume Share (%), by Type of Testing 2024 & 2032
  43. Figure 43: Europe Rubber Testing Equipment Market Revenue (Million), by End-user Application 2024 & 2032
  44. Figure 44: Europe Rubber Testing Equipment Market Volume (K Unit), by End-user Application 2024 & 2032
  45. Figure 45: Europe Rubber Testing Equipment Market Revenue Share (%), by End-user Application 2024 & 2032
  46. Figure 46: Europe Rubber Testing Equipment Market Volume Share (%), by End-user Application 2024 & 2032
  47. Figure 47: Europe Rubber Testing Equipment Market Revenue (Million), by Country 2024 & 2032
  48. Figure 48: Europe Rubber Testing Equipment Market Volume (K Unit), by Country 2024 & 2032
  49. Figure 49: Europe Rubber Testing Equipment Market Revenue Share (%), by Country 2024 & 2032
  50. Figure 50: Europe Rubber Testing Equipment Market Volume Share (%), by Country 2024 & 2032
  51. Figure 51: Asia Rubber Testing Equipment Market Revenue (Million), by Type of Testing 2024 & 2032
  52. Figure 52: Asia Rubber Testing Equipment Market Volume (K Unit), by Type of Testing 2024 & 2032
  53. Figure 53: Asia Rubber Testing Equipment Market Revenue Share (%), by Type of Testing 2024 & 2032
  54. Figure 54: Asia Rubber Testing Equipment Market Volume Share (%), by Type of Testing 2024 & 2032
  55. Figure 55: Asia Rubber Testing Equipment Market Revenue (Million), by End-user Application 2024 & 2032
  56. Figure 56: Asia Rubber Testing Equipment Market Volume (K Unit), by End-user Application 2024 & 2032
  57. Figure 57: Asia Rubber Testing Equipment Market Revenue Share (%), by End-user Application 2024 & 2032
  58. Figure 58: Asia Rubber Testing Equipment Market Volume Share (%), by End-user Application 2024 & 2032
  59. Figure 59: Asia Rubber Testing Equipment Market Revenue (Million), by Country 2024 & 2032
  60. Figure 60: Asia Rubber Testing Equipment Market Volume (K Unit), by Country 2024 & 2032
  61. Figure 61: Asia Rubber Testing Equipment Market Revenue Share (%), by Country 2024 & 2032
  62. Figure 62: Asia Rubber Testing Equipment Market Volume Share (%), by Country 2024 & 2032
  63. Figure 63: Australia and New Zealand Rubber Testing Equipment Market Revenue (Million), by Type of Testing 2024 & 2032
  64. Figure 64: Australia and New Zealand Rubber Testing Equipment Market Volume (K Unit), by Type of Testing 2024 & 2032
  65. Figure 65: Australia and New Zealand Rubber Testing Equipment Market Revenue Share (%), by Type of Testing 2024 & 2032
  66. Figure 66: Australia and New Zealand Rubber Testing Equipment Market Volume Share (%), by Type of Testing 2024 & 2032
  67. Figure 67: Australia and New Zealand Rubber Testing Equipment Market Revenue (Million), by End-user Application 2024 & 2032
  68. Figure 68: Australia and New Zealand Rubber Testing Equipment Market Volume (K Unit), by End-user Application 2024 & 2032
  69. Figure 69: Australia and New Zealand Rubber Testing Equipment Market Revenue Share (%), by End-user Application 2024 & 2032
  70. Figure 70: Australia and New Zealand Rubber Testing Equipment Market Volume Share (%), by End-user Application 2024 & 2032
  71. Figure 71: Australia and New Zealand Rubber Testing Equipment Market Revenue (Million), by Country 2024 & 2032
  72. Figure 72: Australia and New Zealand Rubber Testing Equipment Market Volume (K Unit), by Country 2024 & 2032
  73. Figure 73: Australia and New Zealand Rubber Testing Equipment Market Revenue Share (%), by Country 2024 & 2032
  74. Figure 74: Australia and New Zealand Rubber Testing Equipment Market Volume Share (%), by Country 2024 & 2032
  75. Figure 75: Latin America Rubber Testing Equipment Market Revenue (Million), by Type of Testing 2024 & 2032
  76. Figure 76: Latin America Rubber Testing Equipment Market Volume (K Unit), by Type of Testing 2024 & 2032
  77. Figure 77: Latin America Rubber Testing Equipment Market Revenue Share (%), by Type of Testing 2024 & 2032
  78. Figure 78: Latin America Rubber Testing Equipment Market Volume Share (%), by Type of Testing 2024 & 2032
  79. Figure 79: Latin America Rubber Testing Equipment Market Revenue (Million), by End-user Application 2024 & 2032
  80. Figure 80: Latin America Rubber Testing Equipment Market Volume (K Unit), by End-user Application 2024 & 2032
  81. Figure 81: Latin America Rubber Testing Equipment Market Revenue Share (%), by End-user Application 2024 & 2032
  82. Figure 82: Latin America Rubber Testing Equipment Market Volume Share (%), by End-user Application 2024 & 2032
  83. Figure 83: Latin America Rubber Testing Equipment Market Revenue (Million), by Country 2024 & 2032
  84. Figure 84: Latin America Rubber Testing Equipment Market Volume (K Unit), by Country 2024 & 2032
  85. Figure 85: Latin America Rubber Testing Equipment Market Revenue Share (%), by Country 2024 & 2032
  86. Figure 86: Latin America Rubber Testing Equipment Market Volume Share (%), by Country 2024 & 2032
  87. Figure 87: Middle East and Africa Rubber Testing Equipment Market Revenue (Million), by Type of Testing 2024 & 2032
  88. Figure 88: Middle East and Africa Rubber Testing Equipment Market Volume (K Unit), by Type of Testing 2024 & 2032
  89. Figure 89: Middle East and Africa Rubber Testing Equipment Market Revenue Share (%), by Type of Testing 2024 & 2032
  90. Figure 90: Middle East and Africa Rubber Testing Equipment Market Volume Share (%), by Type of Testing 2024 & 2032
  91. Figure 91: Middle East and Africa Rubber Testing Equipment Market Revenue (Million), by End-user Application 2024 & 2032
  92. Figure 92: Middle East and Africa Rubber Testing Equipment Market Volume (K Unit), by End-user Application 2024 & 2032
  93. Figure 93: Middle East and Africa Rubber Testing Equipment Market Revenue Share (%), by End-user Application 2024 & 2032
  94. Figure 94: Middle East and Africa Rubber Testing Equipment Market Volume Share (%), by End-user Application 2024 & 2032
  95. Figure 95: Middle East and Africa Rubber Testing Equipment Market Revenue (Million), by Country 2024 & 2032
  96. Figure 96: Middle East and Africa Rubber Testing Equipment Market Volume (K Unit), by Country 2024 & 2032
  97. Figure 97: Middle East and Africa Rubber Testing Equipment Market Revenue Share (%), by Country 2024 & 2032
  98. Figure 98: Middle East and Africa Rubber Testing Equipment Market Volume Share (%), by Country 2024 & 2032

List of Tables

  1. Table 1: Global Rubber Testing Equipment Market Revenue Million Forecast, by Region 2019 & 2032
  2. Table 2: Global Rubber Testing Equipment Market Volume K Unit Forecast, by Region 2019 & 2032
  3. Table 3: Global Rubber Testing Equipment Market Revenue Million Forecast, by Type of Testing 2019 & 2032
  4. Table 4: Global Rubber Testing Equipment Market Volume K Unit Forecast, by Type of Testing 2019 & 2032
  5. Table 5: Global Rubber Testing Equipment Market Revenue Million Forecast, by End-user Application 2019 & 2032
  6. Table 6: Global Rubber Testing Equipment Market Volume K Unit Forecast, by End-user Application 2019 & 2032
  7. Table 7: Global Rubber Testing Equipment Market Revenue Million Forecast, by Region 2019 & 2032
  8. Table 8: Global Rubber Testing Equipment Market Volume K Unit Forecast, by Region 2019 & 2032
  9. Table 9: Global Rubber Testing Equipment Market Revenue Million Forecast, by Country 2019 & 2032
  10. Table 10: Global Rubber Testing Equipment Market Volume K Unit Forecast, by Country 2019 & 2032
  11. Table 11: United States Rubber Testing Equipment Market Revenue (Million) Forecast, by Application 2019 & 2032
  12. Table 12: United States Rubber Testing Equipment Market Volume (K Unit) Forecast, by Application 2019 & 2032
  13. Table 13: Canada Rubber Testing Equipment Market Revenue (Million) Forecast, by Application 2019 & 2032
  14. Table 14: Canada Rubber Testing Equipment Market Volume (K Unit) Forecast, by Application 2019 & 2032
  15. Table 15: Mexico Rubber Testing Equipment Market Revenue (Million) Forecast, by Application 2019 & 2032
  16. Table 16: Mexico Rubber Testing Equipment Market Volume (K Unit) Forecast, by Application 2019 & 2032
  17. Table 17: Global Rubber Testing Equipment Market Revenue Million Forecast, by Country 2019 & 2032
  18. Table 18: Global Rubber Testing Equipment Market Volume K Unit Forecast, by Country 2019 & 2032
  19. Table 19: Germany Rubber Testing Equipment Market Revenue (Million) Forecast, by Application 2019 & 2032
  20. Table 20: Germany Rubber Testing Equipment Market Volume (K Unit) Forecast, by Application 2019 & 2032
  21. Table 21: United Kingdom Rubber Testing Equipment Market Revenue (Million) Forecast, by Application 2019 & 2032
  22. Table 22: United Kingdom Rubber Testing Equipment Market Volume (K Unit) Forecast, by Application 2019 & 2032
  23. Table 23: France Rubber Testing Equipment Market Revenue (Million) Forecast, by Application 2019 & 2032
  24. Table 24: France Rubber Testing Equipment Market Volume (K Unit) Forecast, by Application 2019 & 2032
  25. Table 25: Spain Rubber Testing Equipment Market Revenue (Million) Forecast, by Application 2019 & 2032
  26. Table 26: Spain Rubber Testing Equipment Market Volume (K Unit) Forecast, by Application 2019 & 2032
  27. Table 27: Italy Rubber Testing Equipment Market Revenue (Million) Forecast, by Application 2019 & 2032
  28. Table 28: Italy Rubber Testing Equipment Market Volume (K Unit) Forecast, by Application 2019 & 2032
  29. Table 29: Spain Rubber Testing Equipment Market Revenue (Million) Forecast, by Application 2019 & 2032
  30. Table 30: Spain Rubber Testing Equipment Market Volume (K Unit) Forecast, by Application 2019 & 2032
  31. Table 31: Belgium Rubber Testing Equipment Market Revenue (Million) Forecast, by Application 2019 & 2032
  32. Table 32: Belgium Rubber Testing Equipment Market Volume (K Unit) Forecast, by Application 2019 & 2032
  33. Table 33: Netherland Rubber Testing Equipment Market Revenue (Million) Forecast, by Application 2019 & 2032
  34. Table 34: Netherland Rubber Testing Equipment Market Volume (K Unit) Forecast, by Application 2019 & 2032
  35. Table 35: Nordics Rubber Testing Equipment Market Revenue (Million) Forecast, by Application 2019 & 2032
  36. Table 36: Nordics Rubber Testing Equipment Market Volume (K Unit) Forecast, by Application 2019 & 2032
  37. Table 37: Rest of Europe Rubber Testing Equipment Market Revenue (Million) Forecast, by Application 2019 & 2032
  38. Table 38: Rest of Europe Rubber Testing Equipment Market Volume (K Unit) Forecast, by Application 2019 & 2032
  39. Table 39: Global Rubber Testing Equipment Market Revenue Million Forecast, by Country 2019 & 2032
  40. Table 40: Global Rubber Testing Equipment Market Volume K Unit Forecast, by Country 2019 & 2032
  41. Table 41: China Rubber Testing Equipment Market Revenue (Million) Forecast, by Application 2019 & 2032
  42. Table 42: China Rubber Testing Equipment Market Volume (K Unit) Forecast, by Application 2019 & 2032
  43. Table 43: Japan Rubber Testing Equipment Market Revenue (Million) Forecast, by Application 2019 & 2032
  44. Table 44: Japan Rubber Testing Equipment Market Volume (K Unit) Forecast, by Application 2019 & 2032
  45. Table 45: India Rubber Testing Equipment Market Revenue (Million) Forecast, by Application 2019 & 2032
  46. Table 46: India Rubber Testing Equipment Market Volume (K Unit) Forecast, by Application 2019 & 2032
  47. Table 47: South Korea Rubber Testing Equipment Market Revenue (Million) Forecast, by Application 2019 & 2032
  48. Table 48: South Korea Rubber Testing Equipment Market Volume (K Unit) Forecast, by Application 2019 & 2032
  49. Table 49: Southeast Asia Rubber Testing Equipment Market Revenue (Million) Forecast, by Application 2019 & 2032
  50. Table 50: Southeast Asia Rubber Testing Equipment Market Volume (K Unit) Forecast, by Application 2019 & 2032
  51. Table 51: Australia Rubber Testing Equipment Market Revenue (Million) Forecast, by Application 2019 & 2032
  52. Table 52: Australia Rubber Testing Equipment Market Volume (K Unit) Forecast, by Application 2019 & 2032
  53. Table 53: Indonesia Rubber Testing Equipment Market Revenue (Million) Forecast, by Application 2019 & 2032
  54. Table 54: Indonesia Rubber Testing Equipment Market Volume (K Unit) Forecast, by Application 2019 & 2032
  55. Table 55: Phillipes Rubber Testing Equipment Market Revenue (Million) Forecast, by Application 2019 & 2032
  56. Table 56: Phillipes Rubber Testing Equipment Market Volume (K Unit) Forecast, by Application 2019 & 2032
  57. Table 57: Singapore Rubber Testing Equipment Market Revenue (Million) Forecast, by Application 2019 & 2032
  58. Table 58: Singapore Rubber Testing Equipment Market Volume (K Unit) Forecast, by Application 2019 & 2032
  59. Table 59: Thailandc Rubber Testing Equipment Market Revenue (Million) Forecast, by Application 2019 & 2032
  60. Table 60: Thailandc Rubber Testing Equipment Market Volume (K Unit) Forecast, by Application 2019 & 2032
  61. Table 61: Rest of Asia Pacific Rubber Testing Equipment Market Revenue (Million) Forecast, by Application 2019 & 2032
  62. Table 62: Rest of Asia Pacific Rubber Testing Equipment Market Volume (K Unit) Forecast, by Application 2019 & 2032
  63. Table 63: Global Rubber Testing Equipment Market Revenue Million Forecast, by Country 2019 & 2032
  64. Table 64: Global Rubber Testing Equipment Market Volume K Unit Forecast, by Country 2019 & 2032
  65. Table 65: Brazil Rubber Testing Equipment Market Revenue (Million) Forecast, by Application 2019 & 2032
  66. Table 66: Brazil Rubber Testing Equipment Market Volume (K Unit) Forecast, by Application 2019 & 2032
  67. Table 67: Argentina Rubber Testing Equipment Market Revenue (Million) Forecast, by Application 2019 & 2032
  68. Table 68: Argentina Rubber Testing Equipment Market Volume (K Unit) Forecast, by Application 2019 & 2032
  69. Table 69: Peru Rubber Testing Equipment Market Revenue (Million) Forecast, by Application 2019 & 2032
  70. Table 70: Peru Rubber Testing Equipment Market Volume (K Unit) Forecast, by Application 2019 & 2032
  71. Table 71: Chile Rubber Testing Equipment Market Revenue (Million) Forecast, by Application 2019 & 2032
  72. Table 72: Chile Rubber Testing Equipment Market Volume (K Unit) Forecast, by Application 2019 & 2032
  73. Table 73: Colombia Rubber Testing Equipment Market Revenue (Million) Forecast, by Application 2019 & 2032
  74. Table 74: Colombia Rubber Testing Equipment Market Volume (K Unit) Forecast, by Application 2019 & 2032
  75. Table 75: Ecuador Rubber Testing Equipment Market Revenue (Million) Forecast, by Application 2019 & 2032
  76. Table 76: Ecuador Rubber Testing Equipment Market Volume (K Unit) Forecast, by Application 2019 & 2032
  77. Table 77: Venezuela Rubber Testing Equipment Market Revenue (Million) Forecast, by Application 2019 & 2032
  78. Table 78: Venezuela Rubber Testing Equipment Market Volume (K Unit) Forecast, by Application 2019 & 2032
  79. Table 79: Rest of South America Rubber Testing Equipment Market Revenue (Million) Forecast, by Application 2019 & 2032
  80. Table 80: Rest of South America Rubber Testing Equipment Market Volume (K Unit) Forecast, by Application 2019 & 2032
  81. Table 81: Global Rubber Testing Equipment Market Revenue Million Forecast, by Country 2019 & 2032
  82. Table 82: Global Rubber Testing Equipment Market Volume K Unit Forecast, by Country 2019 & 2032
  83. Table 83: United States Rubber Testing Equipment Market Revenue (Million) Forecast, by Application 2019 & 2032
  84. Table 84: United States Rubber Testing Equipment Market Volume (K Unit) Forecast, by Application 2019 & 2032
  85. Table 85: Canada Rubber Testing Equipment Market Revenue (Million) Forecast, by Application 2019 & 2032
  86. Table 86: Canada Rubber Testing Equipment Market Volume (K Unit) Forecast, by Application 2019 & 2032
  87. Table 87: Mexico Rubber Testing Equipment Market Revenue (Million) Forecast, by Application 2019 & 2032
  88. Table 88: Mexico Rubber Testing Equipment Market Volume (K Unit) Forecast, by Application 2019 & 2032
  89. Table 89: Global Rubber Testing Equipment Market Revenue Million Forecast, by Country 2019 & 2032
  90. Table 90: Global Rubber Testing Equipment Market Volume K Unit Forecast, by Country 2019 & 2032
  91. Table 91: United Arab Emirates Rubber Testing Equipment Market Revenue (Million) Forecast, by Application 2019 & 2032
  92. Table 92: United Arab Emirates Rubber Testing Equipment Market Volume (K Unit) Forecast, by Application 2019 & 2032
  93. Table 93: Saudi Arabia Rubber Testing Equipment Market Revenue (Million) Forecast, by Application 2019 & 2032
  94. Table 94: Saudi Arabia Rubber Testing Equipment Market Volume (K Unit) Forecast, by Application 2019 & 2032
  95. Table 95: South Africa Rubber Testing Equipment Market Revenue (Million) Forecast, by Application 2019 & 2032
  96. Table 96: South Africa Rubber Testing Equipment Market Volume (K Unit) Forecast, by Application 2019 & 2032
  97. Table 97: Rest of Middle East and Africa Rubber Testing Equipment Market Revenue (Million) Forecast, by Application 2019 & 2032
  98. Table 98: Rest of Middle East and Africa Rubber Testing Equipment Market Volume (K Unit) Forecast, by Application 2019 & 2032
  99. Table 99: Global Rubber Testing Equipment Market Revenue Million Forecast, by Type of Testing 2019 & 2032
  100. Table 100: Global Rubber Testing Equipment Market Volume K Unit Forecast, by Type of Testing 2019 & 2032
  101. Table 101: Global Rubber Testing Equipment Market Revenue Million Forecast, by End-user Application 2019 & 2032
  102. Table 102: Global Rubber Testing Equipment Market Volume K Unit Forecast, by End-user Application 2019 & 2032
  103. Table 103: Global Rubber Testing Equipment Market Revenue Million Forecast, by Country 2019 & 2032
  104. Table 104: Global Rubber Testing Equipment Market Volume K Unit Forecast, by Country 2019 & 2032
  105. Table 105: Global Rubber Testing Equipment Market Revenue Million Forecast, by Type of Testing 2019 & 2032
  106. Table 106: Global Rubber Testing Equipment Market Volume K Unit Forecast, by Type of Testing 2019 & 2032
  107. Table 107: Global Rubber Testing Equipment Market Revenue Million Forecast, by End-user Application 2019 & 2032
  108. Table 108: Global Rubber Testing Equipment Market Volume K Unit Forecast, by End-user Application 2019 & 2032
  109. Table 109: Global Rubber Testing Equipment Market Revenue Million Forecast, by Country 2019 & 2032
  110. Table 110: Global Rubber Testing Equipment Market Volume K Unit Forecast, by Country 2019 & 2032
  111. Table 111: Global Rubber Testing Equipment Market Revenue Million Forecast, by Type of Testing 2019 & 2032
  112. Table 112: Global Rubber Testing Equipment Market Volume K Unit Forecast, by Type of Testing 2019 & 2032
  113. Table 113: Global Rubber Testing Equipment Market Revenue Million Forecast, by End-user Application 2019 & 2032
  114. Table 114: Global Rubber Testing Equipment Market Volume K Unit Forecast, by End-user Application 2019 & 2032
  115. Table 115: Global Rubber Testing Equipment Market Revenue Million Forecast, by Country 2019 & 2032
  116. Table 116: Global Rubber Testing Equipment Market Volume K Unit Forecast, by Country 2019 & 2032
  117. Table 117: Global Rubber Testing Equipment Market Revenue Million Forecast, by Type of Testing 2019 & 2032
  118. Table 118: Global Rubber Testing Equipment Market Volume K Unit Forecast, by Type of Testing 2019 & 2032
  119. Table 119: Global Rubber Testing Equipment Market Revenue Million Forecast, by End-user Application 2019 & 2032
  120. Table 120: Global Rubber Testing Equipment Market Volume K Unit Forecast, by End-user Application 2019 & 2032
  121. Table 121: Global Rubber Testing Equipment Market Revenue Million Forecast, by Country 2019 & 2032
  122. Table 122: Global Rubber Testing Equipment Market Volume K Unit Forecast, by Country 2019 & 2032
  123. Table 123: Global Rubber Testing Equipment Market Revenue Million Forecast, by Type of Testing 2019 & 2032
  124. Table 124: Global Rubber Testing Equipment Market Volume K Unit Forecast, by Type of Testing 2019 & 2032
  125. Table 125: Global Rubber Testing Equipment Market Revenue Million Forecast, by End-user Application 2019 & 2032
  126. Table 126: Global Rubber Testing Equipment Market Volume K Unit Forecast, by End-user Application 2019 & 2032
  127. Table 127: Global Rubber Testing Equipment Market Revenue Million Forecast, by Country 2019 & 2032
  128. Table 128: Global Rubber Testing Equipment Market Volume K Unit Forecast, by Country 2019 & 2032
  129. Table 129: Global Rubber Testing Equipment Market Revenue Million Forecast, by Type of Testing 2019 & 2032
  130. Table 130: Global Rubber Testing Equipment Market Volume K Unit Forecast, by Type of Testing 2019 & 2032
  131. Table 131: Global Rubber Testing Equipment Market Revenue Million Forecast, by End-user Application 2019 & 2032
  132. Table 132: Global Rubber Testing Equipment Market Volume K Unit Forecast, by End-user Application 2019 & 2032
  133. Table 133: Global Rubber Testing Equipment Market Revenue Million Forecast, by Country 2019 & 2032
  134. Table 134: Global Rubber Testing Equipment Market Volume K Unit Forecast, by Country 2019 & 2032


Frequently Asked Questions

1. What is the projected Compound Annual Growth Rate (CAGR) of the Rubber Testing Equipment Market?

The projected CAGR is approximately 4.70%.

2. Which companies are prominent players in the Rubber Testing Equipment Market?

Key companies in the market include Prescott Instruments Ltd, Montech Rubber Testing Instruments, Gibitre Instruments Sr, Goettfert Inc, TA Instruments Inc, Alpha Technologies, U-Can Dynatex Inc, Norka Instruments Sanghai Ltd, Ektron Tek Co Ltd, Gotech Testing Machines.

3. What are the main segments of the Rubber Testing Equipment Market?

The market segments include Type of Testing, End-user Application.

4. Can you provide details about the market size?

The market size is estimated to be USD 14.90 Million as of 2022.

5. What are some drivers contributing to market growth?

Growing Demand for Durable Goods; Technological Advancements in Rubber Testing.

6. What are the notable trends driving market growth?

The Rising Demand for Tires to Drive the Market.

7. Are there any restraints impacting market growth?

High Cost of Ownership.

8. Can you provide examples of recent developments in the market?

N/A

9. What pricing options are available for accessing the report?

Pricing options include single-user, multi-user, and enterprise licenses priced at USD 4750, USD 5250, and USD 8750 respectively.

10. Is the market size provided in terms of value or volume?

The market size is provided in terms of value, measured in Million and volume, measured in K Unit.

11. Are there any specific market keywords associated with the report?

Yes, the market keyword associated with the report is "Rubber Testing Equipment Market," which aids in identifying and referencing the specific market segment covered.

12. How do I determine which pricing option suits my needs best?

The pricing options vary based on user requirements and access needs. Individual users may opt for single-user licenses, while businesses requiring broader access may choose multi-user or enterprise licenses for cost-effective access to the report.

13. Are there any additional resources or data provided in the Rubber Testing Equipment Market report?

While the report offers comprehensive insights, it's advisable to review the specific contents or supplementary materials provided to ascertain if additional resources or data are available.

14. How can I stay updated on further developments or reports in the Rubber Testing Equipment Market?

To stay informed about further developments, trends, and reports in the Rubber Testing Equipment Market, consider subscribing to industry newsletters, following relevant companies and organizations, or regularly checking reputable industry news sources and publications.


Methodology

Step 1 - Identification of Relevant Samples Size from Population Database

Step Chart
Bar Chart
Method Chart

Step 2 - Approaches for Defining Global Market Size (Value, Volume* & Price*)

Approach Chart
Top-down and bottom-up approaches are used to validate the global market size and estimate the market size for manufactures, regional segments, product, and application.

Note*: In applicable scenarios

Step 3 - Data Sources

Primary Research

  • Web Analytics
  • Survey Reports
  • Research Institute
  • Latest Research Reports
  • Opinion Leaders

Secondary Research

  • Annual Reports
  • White Paper
  • Latest Press Release
  • Industry Association
  • Paid Database
  • Investor Presentations
Analyst Chart

Step 4 - Data Triangulation

Involves using different sources of information in order to increase the validity of a study

These sources are likely to be stakeholders in a program - participants, other researchers, program staff, other community members, and so on.

Then we put all data in single framework & apply various statistical tools to find out the dynamic on the market.

During the analysis stage, feedback from the stakeholder groups would be compared to determine areas of agreement as well as areas of divergence

Additionally, after gathering mixed and scattered data from a wide range of sources, data is triangulated and correlated to come up with estimated figures which are further validated through primary mediums or industry experts, opinion leaders.

About Visionary Data Reports

Visionary Data Reports provides future-focused market research, advanced analytics, and strategic insights for technology, healthcare, green energy, and finance. Our reports help you anticipate trends, innovate, and lead in your industry. Our expert team combines primary research, data science, and industry knowledge to deliver actionable intelligence. We offer syndicated reports, custom analytics, and consulting services tailored to your business needs. At Visionary Data Reports, we are committed to quality, transparency, and client satisfaction. Every report is rigorously validated to ensure accuracy and relevance. Our global perspective and forward-thinking approach help you understand both current and emerging market dynamics.

Stay ahead with Visionary Data Reports. Subscribe to our newsletter for the latest insights and research highlights, and follow us on social media for real-time updates. Visionary Data Reports – Your Guide to Tomorrow’s Opportunities.

artwork spiralartwork spiralRelated Reports
artwork underline

Exploring Growth Avenues in Webtoons Market Market

Explore the booming Webtoons market, projected at USD 7.39 million with a 35.27% CAGR. Discover key drivers, trends, revenue models, and regional growth in digital comics.

December 2025
Base Year: 2024
No Of Pages: 234
Price: $4750

India ICT Market 2025-2033 Analysis: Trends, Competitor Dynamics, and Growth Opportunities

The size of the India ICT Market market was valued at USD XX Million in 2024 and is projected to reach USD XXX Million by 2033, with an expected CAGR of 9.04% during the forecast period.

December 2025
Base Year: 2024
No Of Pages: 234
Price: $4750

Wires and Cables Market Size, Share, and Growth Report: In-Depth Analysis and Forecast to 2033

Explore the dynamic global wires and cables market, projected to reach USD 228.42 million by 2025 with a 5.50% CAGR. Discover key drivers, evolving trends in power, telecom, and construction, and leading companies shaping the future of connectivity and energy infrastructure.

December 2025
Base Year: 2024
No Of Pages: 234
Price: $4750

Strategizing Growth: Building Automation Industry Market’s Decade Ahead 2025-2033

Explore the surging Building Automation Industry market analysis, CAGR 8.00%, key drivers, trends, and detailed segment insights for smart buildings. Discover growth opportunities in HVAC, BMS, security, and energy management systems.

December 2025
Base Year: 2024
No Of Pages: 234
Price: $4750

Security Robots Industry 2025 Market Trends and 2033 Forecasts: Exploring Growth Potential

Explore the booming Security Robots market, projected to hit $15.70 billion by 2025 with a 13.57% CAGR. Discover key drivers, trends, and segments like UAVs, UGVs, and defense applications shaping the future of autonomous security.

December 2025
Base Year: 2024
No Of Pages: 234
Price: $4750

Europe Fixed Wireless Access (FWA) Market Market Expansion: Growth Outlook 2025-2033

Discover the booming Europe Fixed Wireless Access market, projected to reach $2.04 billion by 2025 with a 27.24% CAGR. Explore key drivers, trends, and top companies shaping the future of wireless broadband connectivity.

December 2025
Base Year: 2024
No Of Pages: 234
Price: $4750

Navigating Media Gateway Industry Market Growth 2025-2033

Explore the dynamic Media Gateway market, driven by digital transformation and growing demand for unified communications. Discover key trends, drivers, and regional insights for 2025-2033.

December 2025
Base Year: 2024
No Of Pages: 234
Price: $4750

South America Data Center Physical Security Market 2025-2033 Trends: Unveiling Growth Opportunities and Competitor Dynamics

Explore the booming South America Data Center Physical Security market, driven by cloud adoption and digital transformation. Discover key trends, market size, CAGR, and leading companies.

December 2025
Base Year: 2024
No Of Pages: 210
Price: $4750

Qatar Facility Management Industry Innovations Shaping Market Growth 2025-2033

Explore the booming Qatar Facility Management market! Discover key insights, market size, CAGR, drivers, and trends shaping this dynamic industry. Get essential data for strategic planning and investment.

November 2025
Base Year: 2024
No Of Pages: 197
Price: $3800

Japan Video Surveillance Market 2025-2033 Analysis: Trends, Competitor Dynamics, and Growth Opportunities

Explore the dynamic Japan video surveillance market analysis, detailing significant growth to $8.10 billion by 2025, driven by AI, IP cameras, and VSaaS. Discover key trends, market drivers, and restraints impacting security solutions in Japan.

November 2025
Base Year: 2024
No Of Pages: 197
Price: $3800

Opportunities in Emerging France Facility Management Industry Industry Markets

Explore the booming France Facility Management industry analysis (2025-2033). Discover market size, growth drivers, key trends like outsourcing and hard/soft FM services, and leading companies. Get expert insights into the commercial, institutional, and industrial sectors.

November 2025
Base Year: 2024
No Of Pages: 197
Price: $3800

Analyzing Consumer Behavior in Satellite IoT Communication Market Market

Explore the booming Satellite IoT Communication Market, driven by LEO constellations and growing demand in remote areas. Discover key drivers, trends, and company insights from 2025-2033.

November 2025
Base Year: 2024
No Of Pages: 234
Price: $4750

Cyprus E Commerce Industry CAGR Growth Drivers and Trends: Forecasts 2025-2033

Explore the booming Cyprus E-commerce market with a $1.2 billion valuation in 2025 and a 13.87% CAGR. Discover key drivers, segment growth, and future trends shaping online retail in Cyprus.

November 2025
Base Year: 2024
No Of Pages: 197
Price: $3800

APM Market Competitive Advantage: Trends and Opportunities to 2033

Explore the booming Asset Performance Management (APM) market, driven by predictive analytics and IoT. Discover key trends, drivers, restraints, and regional insights from 2019-2033.

November 2025
Base Year: 2024
No Of Pages: 234
Price: $4750

Exploring Growth Patterns in US Marketing Analytics Industry Market

Explore the booming US Marketing Analytics market, driven by digital transformation and AI. Discover key trends, growth drivers, and sector insights from 2019-2033.

November 2025
Base Year: 2024
No Of Pages: 197
Price: $3800

Middle East and Africa SSD Caching Industry Market’s Consumer Preferences: Trends and Analysis 2025-2033

The size of the Middle East and Africa SSD Caching Industry market was valued at USD XX Million in 2024 and is projected to reach USD XXX Million by 2033, with an expected CAGR of 7.89% during the forecast period.

November 2025
Base Year: 2024
No Of Pages: 197
Price: $3800

Mexico ICT Market Market Analysis and Forecasts

The size of the Mexico ICT Market market was valued at USD XX Million in 2024 and is projected to reach USD XXX Million by 2033, with an expected CAGR of 10.60% during the forecast period.

November 2025
Base Year: 2024
No Of Pages: 197
Price: $3800

Physical Identity and Access Management (PIAM) Software Industry XX CAGR Growth to Drive Market Size to XXX Million by 2033

The size of the Physical Identity and Access Management (PIAM) Software Industry market was valued at USD 0.86 Million in 2024 and is projected to reach USD 2.18 Million by 2033, with an expected CAGR of 14.22% during the forecast period.

November 2025
Base Year: 2024
No Of Pages: 234
Price: $4750

Unlocking Growth in Wealth Management Software Market Market 2025-2033

Explore the booming Wealth Management Software Market, driven by a 14.04% CAGR. Discover key trends, market drivers, and growth opportunities in this essential fintech sector for banks and investment firms.

November 2025
Base Year: 2024
No Of Pages: 234
Price: $4750

Cloud System Management Software Industry Insights: Market Size Analysis to 2033

The size of the Cloud System Management Software Industry market was valued at USD XX Million in 2024 and is projected to reach USD XXX Million by 2033, with an expected CAGR of 25.10">> 25.10% during the forecast period.

November 2025
Base Year: 2024
No Of Pages: 234
Price: $4750

Machine Safety Industry Market’s Technological Evolution: Trends and Analysis 2025-2033

The size of the Machine Safety Industry market was valued at USD 5.07 Million in 2024 and is projected to reach USD 9.86 Million by 2033, with an expected CAGR of 9.97% during the forecast period.

November 2025
Base Year: 2024
No Of Pages: 234
Price: $4750

IR Cameras Industry Market’s Decade-Long Growth Trends and Future Projections 2025-2033

The size of the IR Cameras Industry market was valued at USD 9.22 Million in 2024 and is projected to reach USD 15.60 Million by 2033, with an expected CAGR of 7.80% during the forecast period.

November 2025
Base Year: 2024
No Of Pages: 234
Price: $4750

Customer Data Platform Development Market Competitive Strategies: Trends and Forecasts 2025-2033

Explore the explosive growth of the Customer Data Platform (CDP) Development Market, driven by AI, personalization, and cloud adoption. Uncover market size, CAGR, key drivers, trends, restraints, and leading companies from 2025-2033.

November 2025
Base Year: 2024
No Of Pages: 234
Price: $4750

Comprehensive Insights into Japan Cybersecurity Industry: Trends and Growth Projections 2025-2033

The size of the Japan Cybersecurity Industry market was valued at USD 2.03 Million in 2024 and is projected to reach USD 4.46 Million by 2033, with an expected CAGR of 11.89% during the forecast period.

November 2025
Base Year: 2024
No Of Pages: 197
Price: $3800

Consumer Trends in NA SSD Caching Market Market 2025-2033

Explore the North American SSD Caching Market analysis, including market size, CAGR of 8.50%, key drivers, restraints, and growth trends for enterprise and personal storage through 2033.

November 2025
Base Year: 2024
No Of Pages: 197
Price: $3800

Kenya ICT Market Future-Proofing Growth: Strategic Insights and Analysis 2025-2033

Explore the booming Kenyan ICT market with insights on its USD 10.57 million size, 5.91% CAGR, key growth drivers like cloud and cybersecurity, and emerging trends across BFSI, IT, retail, and manufacturing sectors. Discover market segmentation and leading companies shaping Kenya's digital future.

November 2025
Base Year: 2024
No Of Pages: 197
Price: $3800

Latin America POS Terminal Devices Industry Trends and Forecasts: Comprehensive Insights

Explore the dynamic Latin America POS Terminal Devices Market: drivers, trends, restraints, and key segments. Discover growth projections and leading companies shaping digital payments in Brazil, Mexico, and beyond.

November 2025
Base Year: 2024
No Of Pages: 210
Price: $4750

Analyzing the Future of Laser Diode Market: Key Trends to 2033

The size of the Laser Diode Market market was valued at USD XX Million in 2024 and is projected to reach USD XXX Million by 2033, with an expected CAGR of 11.20% during the forecast period.

November 2025
Base Year: 2024
No Of Pages: 234
Price: $4750

Future Trends Shaping Hong Kong Storage Industry Growth

Explore the booming Hong Kong storage industry! Discover market size, 8.00% CAGR, key drivers, trends, and restraints. Essential insights for self-storage, business storage, and logistics solutions.

November 2025
Base Year: 2024
No Of Pages: 197
Price: $3800

US Satellite-based Earth Observation Market Market Expansion Strategies

The size of the US Satellite-based Earth Observation Market market was valued at USD XX Million in 2024 and is projected to reach USD XXX Million by 2033, with an expected CAGR of 10.25% during the forecast period.

November 2025
Base Year: 2024
No Of Pages: 197
Price: $3800

Japan Data Center Construction Market Strategic Insights for 2025 and Forecasts to 2033: Market Trends

Explore the dynamic Japan Data Center Construction Market, driven by digital transformation. Discover key insights into market size, growth CAGR, essential infrastructure needs, and leading end-users from 2019-2033.

November 2025
Base Year: 2024
No Of Pages: 197
Price: $3800

FSM Industry Strategic Dynamics: Competitor Analysis 2025-2033

The size of the FSM Industry market was valued at USD 4.94 Million in 2024 and is projected to reach USD 10.72 Million by 2033, with an expected CAGR of 11.70% during the forecast period.

November 2025
Base Year: 2024
No Of Pages: 234
Price: $4750

Cloud Network Infrastructure Industry Market Disruption and Future Trends

Explore the burgeoning Cloud Network Infrastructure market, projected for significant growth driven by hybrid cloud adoption, AI, and 5G. Discover key trends, drivers, and segments shaping the future of cloud networking.

November 2025
Base Year: 2024
No Of Pages: 234
Price: $4750

Qatar ICT Market Insights: Growth at XX CAGR Through 2033

Explore the dynamic Qatar ICT Market, projected to reach $8,500 million with an 8.50% CAGR. Discover key drivers, emerging trends in AI, cloud, and 5G, market segments, and leading companies shaping Qatar's digital future.

November 2025
Base Year: 2024
No Of Pages: 197
Price: $3800

Exploring Key Dynamics of United Kingdom Commercial HVAC Market Industry

Explore the burgeoning UK Commercial HVAC market, driven by energy efficiency, sustainability, and smart technology. Analyze market size, CAGR, key drivers, trends, restraints, and leading companies shaping the future of building climate control.

November 2025
Base Year: 2024
No Of Pages: 197
Price: $3800

AI Computing Hardware Industry Market’s Consumer Preferences: Trends and Analysis 2025-2033

Explore the dynamic AI Computing Hardware market, projected to reach $38 billion by 2025 and grow at a 26% CAGR. Discover key drivers, trends in embedded AI, and leading companies shaping the future of artificial intelligence processing.

November 2025
Base Year: 2024
No Of Pages: 234
Price: $4750

Automotive Inertial Measurement Unit Sensors Industry 2025-2033 Trends and Competitor Dynamics: Unlocking Growth Opportunities

Explore the booming Automotive Inertial Measurement Unit (IMU) Sensors market, projected to reach USD 1.09 billion by 2033 with an 11.31% CAGR. Discover key drivers like ADAS and autonomous driving, emerging trends, and market share by region.

November 2025
Base Year: 2024
No Of Pages: 234
Price: $4750

Emerging Denmark Cybersecurity Market Trends and Opportunities

The size of the Denmark Cybersecurity Market market was valued at USD XX Million in 2024 and is projected to reach USD XXX Million by 2033, with an expected CAGR of 6.90% during the forecast period.

November 2025
Base Year: 2024
No Of Pages: 234
Price: $4750

Electrical Enclosures Industry Growth Opportunities and Market Forecast 2025-2033: A Strategic Analysis

Explore the dynamic Electrical Enclosures market, projected to exceed 52.42 million units with a 4.90% CAGR. Discover key drivers, industry trends, and segment analysis for Energy, Industrial, and Process sectors.

November 2025
Base Year: 2024
No Of Pages: 234
Price: $4750

Europe Temperature Sensor Industry in Focus: Growth Trajectories and Strategic Insights 2025-2033

Explore the robust European temperature sensor market, its key drivers like automotive and energy, and technological trends including wireless and advanced sensing. Discover market size, CAGR, and leading companies shaping innovation.

November 2025
Base Year: 2024
No Of Pages: 234
Price: $4750

APAC Marine Satellite Communications Market: Competitive Landscape and Growth Trends 2025-2033

Explore the booming APAC Marine Satellite Communications Market, driven by smart shipping, offshore growth, and connectivity demands. Discover market size, CAGR, key trends, and leading companies in this vital sector.

October 2025
Base Year: 2024
No Of Pages: 197
Price: $3800

Norway Data Center Power Market Market Predictions: Growth and Size Trends to 2033

Explore the robust growth of the Norway Data Center Power Market, driven by digitalization and renewable energy. Get insights on market size, CAGR, key drivers, and leading companies shaping this vital sector.

October 2025
Base Year: 2024
No Of Pages: 197
Price: $3800

Europe Surveillance Camera Market Charting Growth Trajectories: Analysis and Forecasts 2025-2033

Explore the booming Europe Surveillance Camera Market, projected to reach over $16 billion by 2033 with a 10.65% CAGR. Discover key drivers, trends, and industry insights for advanced security solutions.

October 2025
Base Year: 2024
No Of Pages: 210
Price: $4750

Exploring Oxygen Gas Sensors Industry Market Evolution 2025-2033

Explore the dynamic global Oxygen Gas Sensors market, projected to reach $1.39 billion with a 4.76% CAGR. Discover key drivers, trends, and leading technologies shaping this essential industry.

October 2025
Base Year: 2024
No Of Pages: 234
Price: $4750

Data Center Server Market Strategic Dynamics: Competitor Analysis 2025-2033

The size of the Data Center Server Market market was valued at USD XX Million in 2024 and is projected to reach USD XXX Million by 2033, with an expected CAGR of 15.50% during the forecast period.

October 2025
Base Year: 2024
No Of Pages: 234
Price: $4750

Electronic Nose (E-Nose) Market Growth Pathways: Strategic Analysis and Forecasts 2025-2033

Explore the dynamic Electronic Nose (E-nose) market's projected growth to USD 27.38 million by 2025, driven by advanced sensor technology and AI integration. Discover key market drivers, emerging trends, and segmented applications in defense, healthcare, food & beverage, and waste management.

October 2025
Base Year: 2024
No Of Pages: 234
Price: $4750

Opportunities in APAC Positive Displacement Pumps Market Market 2025-2033

Explore the dynamic Asia Pacific Positive Displacement Pumps Market analysis, revealing key trends, growth drivers, and market size projections up to 2033. Discover opportunities in oil & gas, chemicals, and food & beverage sectors.

October 2025
Base Year: 2024
No Of Pages: 210
Price: $4750

Metering Pumps Market Future-proof Strategies: Trends, Competitor Dynamics, and Opportunities 2025-2033

Explore the Metering Pumps Market analysis, including market size, CAGR of 4.50%, key drivers like industrial growth and regulations, dominant segments, and regional trends. Get insights into this vital fluid handling technology.

October 2025
Base Year: 2024
No Of Pages: 234
Price: $4750

Europe Alternating Current (AC) Drive Market 2025-2033 Overview: Trends, Competitor Dynamics, and Opportunities

Explore the expanding European AC Drive Market, driven by energy efficiency, automation, and IIoT adoption in key industries like Oil & Gas and Power Generation. Discover growth drivers, trends, and market forecasts.

October 2025
Base Year: 2024
No Of Pages: 210
Price: $4750

Innovations Driving Asia-Pacific People Screening Market Market 2025-2033

Explore the booming Asia-Pacific People Screening Market, driven by advanced technologies and security needs. Discover market size, growth forecasts, key drivers, and future trends.

October 2025
Base Year: 2024
No Of Pages: 210
Price: $4750
  • Home
  • About Us
  • Industries
    • Packaging
    • Automotive
    • Home and Property Improvement
    • Retail
    • Energy & Power
    • Food & Beverage
    • Real Estate and Construction
    • Hospitality and Tourism
    • Agriculture
    • Manufacturing Products and Services
    • Healthcare
    • Logistics
    • Aerospace & Defense
    • Chemicals & Materials
    • Professional and Commercial Services
    • Financial Services and Investment Intelligence
    • Consumer Goods and Services
    • Animal Nutrition & Wellness
    • Technology, Media and Telecom
  • Services
  • Contact
Main Logo
  • Home
  • About Us
  • Industries
    • Packaging
    • Automotive
    • Home and Property Improvement
    • Retail
    • Energy & Power
    • Food & Beverage
    • Real Estate and Construction
    • Hospitality and Tourism
    • Agriculture
    • Manufacturing Products and Services
    • Healthcare
    • Logistics
    • Aerospace & Defense
    • Chemicals & Materials
    • Professional and Commercial Services
    • Financial Services and Investment Intelligence
    • Consumer Goods and Services
    • Animal Nutrition & Wellness
    • Technology, Media and Telecom
  • Services
  • Contact
+17162654855
[email protected]

+17162654855

[email protected]

Business Address

Head Office

Ansec House 3 rd floor Tank Road, Yerwada, Pune, Maharashtra 411014

Contact Information

Craig Francis

Business Development Head

+17162654855

[email protected]

Secure Payment Partners

payment image
RetailPackagingLogisticsAutomotiveHealthcareAgricultureEnergy & PowerFood & BeverageAerospace & DefenseChemicals & MaterialsHospitality and TourismConsumer Goods and ServicesAnimal Nutrition & WellnessReal Estate and ConstructionHome and Property ImprovementTechnology, Media and TelecomManufacturing Products and ServicesFinancial Services and Investment Intelligence

© 2025 PRDUA Research & Media Private Limited, All rights reserved

Privacy Policy
Terms and Conditions
FAQ