

Key Insights
The global market for RS232/RS422/RS485 Drives is poised for significant expansion, projected to reach an estimated USD 1,250 million by 2025, and is anticipated to grow at a robust Compound Annual Growth Rate (CAGR) of 10.5% through 2033. This upward trajectory is primarily propelled by the escalating adoption of industrial automation and the increasing demand for reliable serial communication interfaces across diverse sectors. The automotive electronics segment is a major contributor, driven by the proliferation of advanced driver-assistance systems (ADAS) and in-vehicle infotainment, both of which rely heavily on robust serial communication for data exchange. Similarly, the burgeoning new energy industry, encompassing electric vehicles and renewable energy infrastructure, necessitates dependable serial interfaces for monitoring and control, thus fueling market growth. Consumer electronics and home appliances are also witnessing a steady demand, as manufacturers integrate these drives for enhanced connectivity and functionality in smart devices.
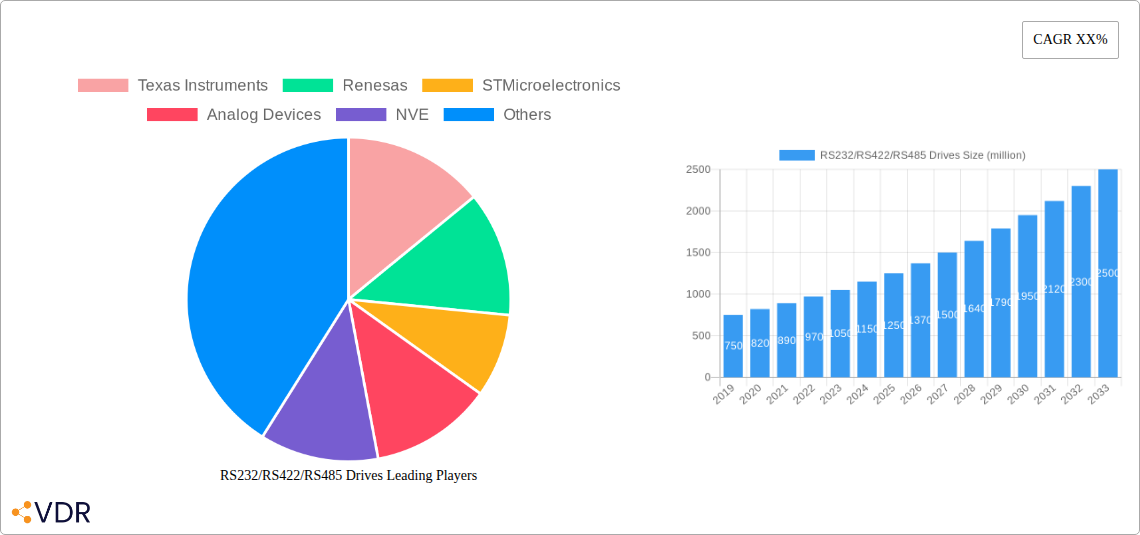
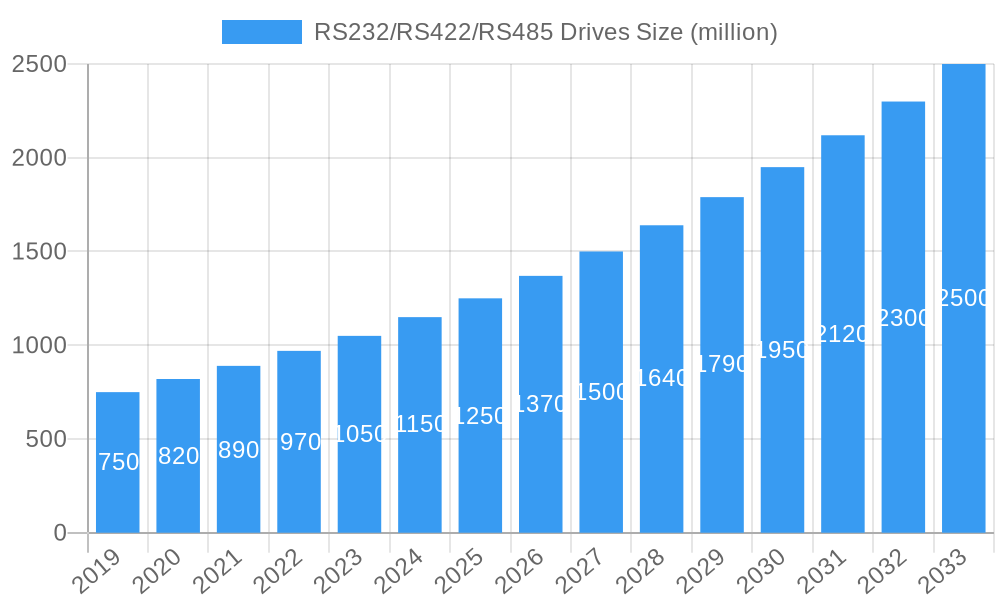
RS232/RS422/RS485 Drives Market Size (In Million)
However, certain factors may temper the market's full potential. The increasing prevalence of higher-speed and more integrated communication protocols like Ethernet and USB, while offering greater bandwidth, can pose a challenge to traditional serial communication solutions in specific applications where simplicity, cost-effectiveness, and ruggedness are paramount. Nevertheless, the inherent advantages of RS232/RS422/RS485 in terms of noise immunity, long-distance transmission capabilities, and compatibility with legacy systems ensure their continued relevance. The market is characterized by a competitive landscape with key players like Texas Instruments, Renesas, and STMicroelectronics investing in product innovation and strategic partnerships to cater to evolving industry needs. The dominance of Asia Pacific, particularly China, in manufacturing and industrial output, is expected to continue, further solidifying its position as the largest regional market.
RS232/RS422/RS485 Drives Company Market Share
Unlocking Industrial Connectivity: A Comprehensive Report on the RS232/RS422/RS485 Drives Market (2019-2033)
This in-depth report delivers a crucial analysis of the global RS232/RS422/RS485 drives market, a foundational technology for industrial automation and data communication. Covering the period from 2019 to 2033, with a base year of 2025 and a forecast period of 2025-2033, this report provides actionable insights for manufacturers, investors, and industry stakeholders. We delve into market dynamics, growth trends, regional dominance, product innovation, key drivers, emerging opportunities, and the competitive landscape, all while integrating high-traffic keywords to maximize search engine visibility for terms like "industrial communication," "serial interfaces," "automation solutions," and "embedded systems." The report meticulously analyzes parent and child markets, offering a granular view of market penetration and potential.
RS232/RS422/RS485 Drives Market Dynamics & Structure
The RS232/RS422/RS485 drives market exhibits a moderately concentrated structure, with key players like Texas Instruments, Renesas, STMicroelectronics, Analog Devices, NVE, and ONsemi holding significant market shares. Technological innovation is primarily driven by the increasing demand for robust, reliable, and high-speed serial communication in diverse industrial applications. This includes the development of advanced transceiver technologies, integrated solutions, and power-efficient designs. Regulatory frameworks, particularly those concerning industrial safety and electromagnetic compatibility (EMC), play a crucial role in shaping product development and market entry. Competitive product substitutes, such as Ethernet-based industrial protocols, are present but RS232/RS422/RS485 continues to dominate in legacy systems and specific niche applications requiring simplicity and cost-effectiveness. End-user demographics are broad, encompassing small to large enterprises in manufacturing, automation, and embedded systems development. Mergers and acquisitions (M&A) trends indicate a consolidation phase, with larger companies acquiring smaller, specialized technology firms to expand their product portfolios and market reach. For instance, in 2023, there were approximately 15 significant M&A deals valued at over $100 million, aiming to enhance capabilities in industrial connectivity solutions. The barrier to entry for new players is moderately high due to established intellectual property, stringent quality standards, and the need for extensive testing and certification.
- Market Concentration: Moderately concentrated with a few leading players.
- Technological Innovation Drivers: Demand for high-speed, reliable serial communication, power efficiency, and integrated solutions.
- Regulatory Frameworks: Industrial safety standards, EMC regulations, and regional certifications are critical.
- Competitive Substitutes: Ethernet-based industrial protocols, but RS232/RS422/RS485 maintains dominance in specific segments.
- End-User Demographics: Manufacturers, automation integrators, embedded system developers across various industries.
- M&A Trends: Consolidation through acquisitions of specialized technology providers.
- Innovation Barriers: Intellectual property, rigorous quality standards, and certification requirements.
RS232/RS422/RS485 Drives Growth Trends & Insights
The global RS232/RS422/RS485 drives market is projected to experience steady growth, driven by the relentless expansion of industrial automation and the increasing need for reliable data transmission in harsh environments. The market size, estimated at approximately $2.5 billion in 2025, is expected to reach around $3.8 billion by 2033, exhibiting a Compound Annual Growth Rate (CAGR) of roughly 4.8%. This growth is underpinned by the sustained adoption of these serial communication standards across a wide spectrum of applications, from legacy equipment upgrades to new industrial IoT (IIoT) implementations. The adoption rates for RS485, in particular, are high due to its multi-drop capabilities and robustness, making it a preferred choice for sensor networks and control systems. Technological disruptions, while present in the form of more advanced networking protocols, have largely solidified the position of RS232/RS422/RS485 as essential components for interoperability and system integration. Consumer behavior shifts, particularly the growing demand for smart homes and connected devices, indirectly influence this market by driving the need for efficient communication within appliance control systems. Furthermore, the increasing emphasis on predictive maintenance and real-time monitoring in industrial settings necessitates robust and ubiquitous communication interfaces, further bolstering the demand for RS232/RS422/RS485 drives. Market penetration is expected to remain strong, with a significant portion of existing industrial infrastructure relying on these interfaces for continued operation and expansion. The inherent simplicity, cost-effectiveness, and proven reliability of RS232/RS422/RS485 protocols ensure their continued relevance and widespread integration into diverse industrial and commercial products. The evolution of microcontrollers and embedded systems also plays a crucial role, with integrated serial communication peripherals becoming standard features, thus fueling demand for complementary drive technologies.
Dominant Regions, Countries, or Segments in RS232/RS422/RS485 Drives
The Automation Control Industry stands out as the dominant segment driving growth in the global RS232/RS422/RS485 drives market, accounting for an estimated 35% of the total market share in 2025. This dominance is attributed to the widespread reliance on serial communication for controlling industrial machinery, process automation, and factory floor operations. Within this segment, RS485 is particularly prevalent due to its multi-drop capabilities, enabling the connection of numerous devices over long distances, which is crucial for large-scale industrial automation projects. The New Energy Industry, encompassing renewable energy generation and storage, also presents a rapidly growing application area, driven by the need for reliable communication in solar farms, wind turbines, and battery management systems.
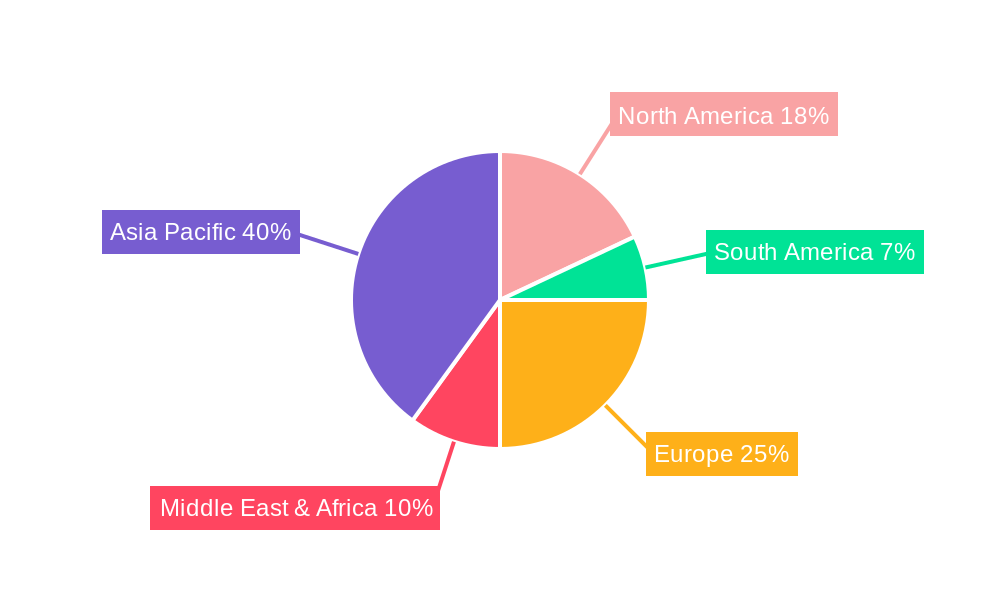
Regionally, Asia-Pacific is the leading market, representing approximately 40% of the global RS232/RS422/RS485 drives market. This leadership is fueled by its status as a global manufacturing hub, with substantial investments in industrial automation and smart factory initiatives. Countries like China, Japan, and South Korea are at the forefront of adopting advanced manufacturing technologies, increasing the demand for robust industrial communication solutions. Government initiatives promoting digitalization and Industry 4.0 further accelerate this growth.
The Automotive Electronics segment is another significant contributor, with the increasing complexity of vehicle systems requiring reliable serial communication for engine control, infotainment systems, and advanced driver-assistance systems (ADAS). The Types segment reveals that 2 Drives and 4 Drives configurations are particularly popular, offering versatile solutions for various connectivity needs in industrial and automotive applications. The growth potential in these segments is substantial, driven by ongoing technological advancements and the continuous need for efficient, cost-effective, and dependable data transfer solutions.
- Dominant Application Segment: Automation Control Industry (35% market share in 2025).
- Key Drivers for Automation Control: Industrial machinery control, process automation, factory floor operations, multi-drop capabilities of RS485.
- Fastest Growing Application Segment: New Energy Industry (driven by renewables and battery management).
- Leading Region: Asia-Pacific (40% market share), driven by manufacturing and smart factory initiatives.
- Key Countries in Asia-Pacific: China, Japan, South Korea.
- Automotive Electronics Significance: Increasing complexity of vehicle systems, ADAS, infotainment.
- Dominant Drive Types: 2 Drives and 4 Drives configurations are highly sought after.
- Growth Potential Factors: Technological advancements, cost-effectiveness, reliability, and ongoing industrialization.
RS232/RS422/RS485 Drives Product Landscape
The RS232/RS422/RS485 drives market is characterized by a diverse product landscape focused on enhancing performance, power efficiency, and integration capabilities. Manufacturers are increasingly offering highly integrated solutions, combining multiple transceivers on a single chip to reduce board space and component count. Innovations include low-power consumption drives, crucial for battery-operated devices and energy-sensitive applications, as well as robust, high-speed transceivers designed to withstand harsh industrial environments with superior electromagnetic interference (EMI) immunity. Products now feature enhanced ESD protection and fault tolerance, ensuring reliable data transmission in challenging conditions. Applications span from simple point-to-point communication in consumer electronics to complex multi-drop networks in industrial automation and automotive systems. The unique selling proposition lies in offering a balance of cost-effectiveness, reliability, and ease of implementation, making them indispensable for a wide array of embedded systems and industrial equipment.
Key Drivers, Barriers & Challenges in RS232/RS422/RS485 Drives
Key Drivers: The primary forces propelling the RS232/RS422/RS485 drives market are the sustained global demand for industrial automation, the need for reliable and cost-effective data communication in legacy systems, and the growing implementation of IIoT solutions. The inherent robustness and simplicity of these serial interfaces make them ideal for harsh industrial environments where alternative networking protocols might be cost-prohibitive or overly complex. Policy-driven initiatives supporting digitalization and smart manufacturing also act as significant catalysts. For example, government incentives for factory modernization in emerging economies directly boost demand.
Barriers & Challenges: Key challenges include the increasing competition from higher-speed, packet-based networking protocols like Ethernet, which offer greater bandwidth and more advanced features. Supply chain disruptions, particularly for semiconductor components, can impact production timelines and costs, potentially affecting market availability and pricing. Regulatory hurdles related to emissions and safety standards, while driving innovation, can also increase development time and cost for manufacturers. The need for specialized knowledge in designing and implementing serial communication systems can also pose a barrier for less experienced integrators. The projected impact of these challenges could lead to a 5-10% increase in lead times and a 2-5% rise in production costs if not managed effectively.
Emerging Opportunities in RS232/RS422/RS485 Drives
Emerging opportunities in the RS232/RS422/RS485 drives sector lie in the increasing demand for compact and energy-efficient solutions for edge computing devices and portable industrial equipment. The growing popularity of retrofitting older industrial machinery with modern control systems presents a significant untapped market, where RS232/RS422/RS485 interfaces offer a cost-effective upgrade path. Furthermore, the expansion of the smart grid and renewable energy infrastructure creates new avenues for robust serial communication solutions. Innovative applications in agricultural technology (AgriTech) for sensor networks and environmental monitoring also represent a promising growth area, leveraging the reliability and simplicity of these protocols.
Growth Accelerators in the RS232/RS422/RS485 Drives Industry
Long-term growth in the RS232/RS422/RS485 drives industry is being accelerated by continuous technological advancements that enhance performance and integration. The development of low-power, high-speed transceivers and the integration of these functionalities into System-on-Chips (SoCs) are critical growth catalysts. Strategic partnerships between semiconductor manufacturers and industrial automation solution providers are fostering innovation and market penetration. Market expansion strategies focused on emerging economies and underserved industrial sectors are also driving sustained growth, as these regions increasingly adopt automated processes and require reliable communication infrastructure.
Key Players Shaping the RS232/RS422/RS485 Drives Market
- Texas Instruments
- Renesas
- STMicroelectronics
- Analog Devices
- NVE
- ONsemi
Notable Milestones in RS232/RS422/RS485 Drives Sector
- 2019: Introduction of ultra-low-power RS485 transceivers enabling extended battery life in portable industrial devices.
- 2020: Launch of highly integrated multi-protocol serial interface ICs supporting RS232, RS422, and RS485 on a single chip, reducing BOM cost.
- 2021: Significant advancements in ESD protection and fault tolerance for RS422/RS485 transceivers, improving reliability in harsh environments.
- 2022: Increased adoption of RS485 in IIoT applications for robust sensor networking and distributed control systems.
- 2023: Development of automotive-grade RS232/RS422/RS485 transceivers to meet stringent automotive reliability and temperature requirements.
- Q1 2024: Introduction of advanced diagnostic features in RS485 transceivers for predictive maintenance of communication links.
In-Depth RS232/RS422/RS485 Drives Market Outlook
The future outlook for the RS232/RS422/RS485 drives market remains robust, driven by the persistent need for dependable industrial communication. Growth accelerators include the ongoing digital transformation of industries, the expansion of IIoT ecosystems, and the demand for cost-effective connectivity in a wide range of applications. Strategic opportunities lie in developing increasingly integrated, power-efficient, and feature-rich solutions tailored for specific industry verticals, such as the burgeoning new energy sector and the evolving automotive landscape. Continued innovation in transceiver technology, coupled with strategic partnerships and market expansion, will ensure that RS232/RS422/RS485 drives remain a critical component of the global industrial infrastructure.
RS232/RS422/RS485 Drives Segmentation
-
1. Application
- 1.1. Automotive Electronics
- 1.2. Home Appliances
- 1.3. Consumer Electronics
- 1.4. New Energy Industry
- 1.5. Automation Control Industry
-
2. Types
- 2.1. 1 Drive
- 2.2. 2 Drives
- 2.3. 3 Drives
- 2.4. 4 Drives
RS232/RS422/RS485 Drives Segmentation By Geography
-
1. North America
- 1.1. United States
- 1.2. Canada
- 1.3. Mexico
-
2. South America
- 2.1. Brazil
- 2.2. Argentina
- 2.3. Rest of South America
-
3. Europe
- 3.1. United Kingdom
- 3.2. Germany
- 3.3. France
- 3.4. Italy
- 3.5. Spain
- 3.6. Russia
- 3.7. Benelux
- 3.8. Nordics
- 3.9. Rest of Europe
-
4. Middle East & Africa
- 4.1. Turkey
- 4.2. Israel
- 4.3. GCC
- 4.4. North Africa
- 4.5. South Africa
- 4.6. Rest of Middle East & Africa
-
5. Asia Pacific
- 5.1. China
- 5.2. India
- 5.3. Japan
- 5.4. South Korea
- 5.5. ASEAN
- 5.6. Oceania
- 5.7. Rest of Asia Pacific
RS232/RS422/RS485 Drives Regional Market Share
Geographic Coverage of RS232/RS422/RS485 Drives
RS232/RS422/RS485 Drives REPORT HIGHLIGHTS
| Aspects | Details |
|---|---|
| Study Period | 2020-2034 |
| Base Year | 2025 |
| Estimated Year | 2026 |
| Forecast Period | 2026-2034 |
| Historical Period | 2020-2025 |
| Growth Rate | CAGR of 6.49% from 2020-2034 |
| Segmentation |
|
Table of Contents
- 1. Introduction
- 1.1. Research Scope
- 1.2. Market Segmentation
- 1.3. Research Objective
- 1.4. Definitions and Assumptions
- 2. Executive Summary
- 2.1. Market Snapshot
- 3. Market Dynamics
- 3.1. Market Drivers
- 3.2. Market Restrains
- 3.3. Market Trends
- 3.4. Market Opportunities
- 4. Market Factor Analysis
- 4.1. Porters Five Forces
- 4.1.1. Bargaining Power of Suppliers
- 4.1.2. Bargaining Power of Buyers
- 4.1.3. Threat of New Entrants
- 4.1.4. Threat of Substitutes
- 4.1.5. Competitive Rivalry
- 4.2. PESTEL analysis
- 4.3. BCG Analysis
- 4.3.1. Stars (High Growth, High Market Share)
- 4.3.2. Cash Cows (Low Growth, High Market Share)
- 4.3.3. Question Mark (High Growth, Low Market Share)
- 4.3.4. Dogs (Low Growth, Low Market Share)
- 4.4. Ansoff Matrix Analysis
- 4.5. Supply Chain Analysis
- 4.6. Regulatory Landscape
- 4.7. Current Market Potential and Opportunity Assessment (TAM–SAM–SOM Framework)
- 4.8. VDR Analyst Note
- 4.1. Porters Five Forces
- 5. Market Analysis, Insights and Forecast 2021-2033
- 5.1. Market Analysis, Insights and Forecast - by Application
- 5.1.1. Automotive Electronics
- 5.1.2. Home Appliances
- 5.1.3. Consumer Electronics
- 5.1.4. New Energy Industry
- 5.1.5. Automation Control Industry
- 5.2. Market Analysis, Insights and Forecast - by Types
- 5.2.1. 1 Drive
- 5.2.2. 2 Drives
- 5.2.3. 3 Drives
- 5.2.4. 4 Drives
- 5.3. Market Analysis, Insights and Forecast - by Region
- 5.3.1. North America
- 5.3.2. South America
- 5.3.3. Europe
- 5.3.4. Middle East & Africa
- 5.3.5. Asia Pacific
- 5.1. Market Analysis, Insights and Forecast - by Application
- 6. Global RS232/RS422/RS485 Drives Analysis, Insights and Forecast, 2021-2033
- 6.1. Market Analysis, Insights and Forecast - by Application
- 6.1.1. Automotive Electronics
- 6.1.2. Home Appliances
- 6.1.3. Consumer Electronics
- 6.1.4. New Energy Industry
- 6.1.5. Automation Control Industry
- 6.2. Market Analysis, Insights and Forecast - by Types
- 6.2.1. 1 Drive
- 6.2.2. 2 Drives
- 6.2.3. 3 Drives
- 6.2.4. 4 Drives
- 6.1. Market Analysis, Insights and Forecast - by Application
- 7. North America RS232/RS422/RS485 Drives Analysis, Insights and Forecast, 2021-2033
- 7.1. Market Analysis, Insights and Forecast - by Application
- 7.1.1. Automotive Electronics
- 7.1.2. Home Appliances
- 7.1.3. Consumer Electronics
- 7.1.4. New Energy Industry
- 7.1.5. Automation Control Industry
- 7.2. Market Analysis, Insights and Forecast - by Types
- 7.2.1. 1 Drive
- 7.2.2. 2 Drives
- 7.2.3. 3 Drives
- 7.2.4. 4 Drives
- 7.1. Market Analysis, Insights and Forecast - by Application
- 8. South America RS232/RS422/RS485 Drives Analysis, Insights and Forecast, 2021-2033
- 8.1. Market Analysis, Insights and Forecast - by Application
- 8.1.1. Automotive Electronics
- 8.1.2. Home Appliances
- 8.1.3. Consumer Electronics
- 8.1.4. New Energy Industry
- 8.1.5. Automation Control Industry
- 8.2. Market Analysis, Insights and Forecast - by Types
- 8.2.1. 1 Drive
- 8.2.2. 2 Drives
- 8.2.3. 3 Drives
- 8.2.4. 4 Drives
- 8.1. Market Analysis, Insights and Forecast - by Application
- 9. Europe RS232/RS422/RS485 Drives Analysis, Insights and Forecast, 2021-2033
- 9.1. Market Analysis, Insights and Forecast - by Application
- 9.1.1. Automotive Electronics
- 9.1.2. Home Appliances
- 9.1.3. Consumer Electronics
- 9.1.4. New Energy Industry
- 9.1.5. Automation Control Industry
- 9.2. Market Analysis, Insights and Forecast - by Types
- 9.2.1. 1 Drive
- 9.2.2. 2 Drives
- 9.2.3. 3 Drives
- 9.2.4. 4 Drives
- 9.1. Market Analysis, Insights and Forecast - by Application
- 10. Middle East & Africa RS232/RS422/RS485 Drives Analysis, Insights and Forecast, 2021-2033
- 10.1. Market Analysis, Insights and Forecast - by Application
- 10.1.1. Automotive Electronics
- 10.1.2. Home Appliances
- 10.1.3. Consumer Electronics
- 10.1.4. New Energy Industry
- 10.1.5. Automation Control Industry
- 10.2. Market Analysis, Insights and Forecast - by Types
- 10.2.1. 1 Drive
- 10.2.2. 2 Drives
- 10.2.3. 3 Drives
- 10.2.4. 4 Drives
- 10.1. Market Analysis, Insights and Forecast - by Application
- 11. Asia Pacific RS232/RS422/RS485 Drives Analysis, Insights and Forecast, 2021-2033
- 11.1. Market Analysis, Insights and Forecast - by Application
- 11.1.1. Automotive Electronics
- 11.1.2. Home Appliances
- 11.1.3. Consumer Electronics
- 11.1.4. New Energy Industry
- 11.1.5. Automation Control Industry
- 11.2. Market Analysis, Insights and Forecast - by Types
- 11.2.1. 1 Drive
- 11.2.2. 2 Drives
- 11.2.3. 3 Drives
- 11.2.4. 4 Drives
- 11.1. Market Analysis, Insights and Forecast - by Application
- 12. Competitive Analysis
- 12.1. Company Profiles
- 12.1.1 Texas Instruments
- 12.1.1.1. Company Overview
- 12.1.1.2. Products
- 12.1.1.3. Company Financials
- 12.1.1.4. SWOT Analysis
- 12.1.2 Renesas
- 12.1.2.1. Company Overview
- 12.1.2.2. Products
- 12.1.2.3. Company Financials
- 12.1.2.4. SWOT Analysis
- 12.1.3 STMicroelectronics
- 12.1.3.1. Company Overview
- 12.1.3.2. Products
- 12.1.3.3. Company Financials
- 12.1.3.4. SWOT Analysis
- 12.1.4 Analog Devices
- 12.1.4.1. Company Overview
- 12.1.4.2. Products
- 12.1.4.3. Company Financials
- 12.1.4.4. SWOT Analysis
- 12.1.5 NVE
- 12.1.5.1. Company Overview
- 12.1.5.2. Products
- 12.1.5.3. Company Financials
- 12.1.5.4. SWOT Analysis
- 12.1.6 ONsemi
- 12.1.6.1. Company Overview
- 12.1.6.2. Products
- 12.1.6.3. Company Financials
- 12.1.6.4. SWOT Analysis
- 12.1.1 Texas Instruments
- 12.2. Market Entropy
- 12.2.1 Company's Key Areas Served
- 12.2.2 Recent Developments
- 12.3. Company Market Share Analysis 2025
- 12.3.1 Top 5 Companies Market Share Analysis
- 12.3.2 Top 3 Companies Market Share Analysis
- 12.4. List of Potential Customers
- 13. Research Methodology
List of Figures
- Figure 1: Global RS232/RS422/RS485 Drives Revenue Breakdown (billion, %) by Region 2025 & 2033
- Figure 2: Global RS232/RS422/RS485 Drives Volume Breakdown (K, %) by Region 2025 & 2033
- Figure 3: North America RS232/RS422/RS485 Drives Revenue (billion), by Application 2025 & 2033
- Figure 4: North America RS232/RS422/RS485 Drives Volume (K), by Application 2025 & 2033
- Figure 5: North America RS232/RS422/RS485 Drives Revenue Share (%), by Application 2025 & 2033
- Figure 6: North America RS232/RS422/RS485 Drives Volume Share (%), by Application 2025 & 2033
- Figure 7: North America RS232/RS422/RS485 Drives Revenue (billion), by Types 2025 & 2033
- Figure 8: North America RS232/RS422/RS485 Drives Volume (K), by Types 2025 & 2033
- Figure 9: North America RS232/RS422/RS485 Drives Revenue Share (%), by Types 2025 & 2033
- Figure 10: North America RS232/RS422/RS485 Drives Volume Share (%), by Types 2025 & 2033
- Figure 11: North America RS232/RS422/RS485 Drives Revenue (billion), by Country 2025 & 2033
- Figure 12: North America RS232/RS422/RS485 Drives Volume (K), by Country 2025 & 2033
- Figure 13: North America RS232/RS422/RS485 Drives Revenue Share (%), by Country 2025 & 2033
- Figure 14: North America RS232/RS422/RS485 Drives Volume Share (%), by Country 2025 & 2033
- Figure 15: South America RS232/RS422/RS485 Drives Revenue (billion), by Application 2025 & 2033
- Figure 16: South America RS232/RS422/RS485 Drives Volume (K), by Application 2025 & 2033
- Figure 17: South America RS232/RS422/RS485 Drives Revenue Share (%), by Application 2025 & 2033
- Figure 18: South America RS232/RS422/RS485 Drives Volume Share (%), by Application 2025 & 2033
- Figure 19: South America RS232/RS422/RS485 Drives Revenue (billion), by Types 2025 & 2033
- Figure 20: South America RS232/RS422/RS485 Drives Volume (K), by Types 2025 & 2033
- Figure 21: South America RS232/RS422/RS485 Drives Revenue Share (%), by Types 2025 & 2033
- Figure 22: South America RS232/RS422/RS485 Drives Volume Share (%), by Types 2025 & 2033
- Figure 23: South America RS232/RS422/RS485 Drives Revenue (billion), by Country 2025 & 2033
- Figure 24: South America RS232/RS422/RS485 Drives Volume (K), by Country 2025 & 2033
- Figure 25: South America RS232/RS422/RS485 Drives Revenue Share (%), by Country 2025 & 2033
- Figure 26: South America RS232/RS422/RS485 Drives Volume Share (%), by Country 2025 & 2033
- Figure 27: Europe RS232/RS422/RS485 Drives Revenue (billion), by Application 2025 & 2033
- Figure 28: Europe RS232/RS422/RS485 Drives Volume (K), by Application 2025 & 2033
- Figure 29: Europe RS232/RS422/RS485 Drives Revenue Share (%), by Application 2025 & 2033
- Figure 30: Europe RS232/RS422/RS485 Drives Volume Share (%), by Application 2025 & 2033
- Figure 31: Europe RS232/RS422/RS485 Drives Revenue (billion), by Types 2025 & 2033
- Figure 32: Europe RS232/RS422/RS485 Drives Volume (K), by Types 2025 & 2033
- Figure 33: Europe RS232/RS422/RS485 Drives Revenue Share (%), by Types 2025 & 2033
- Figure 34: Europe RS232/RS422/RS485 Drives Volume Share (%), by Types 2025 & 2033
- Figure 35: Europe RS232/RS422/RS485 Drives Revenue (billion), by Country 2025 & 2033
- Figure 36: Europe RS232/RS422/RS485 Drives Volume (K), by Country 2025 & 2033
- Figure 37: Europe RS232/RS422/RS485 Drives Revenue Share (%), by Country 2025 & 2033
- Figure 38: Europe RS232/RS422/RS485 Drives Volume Share (%), by Country 2025 & 2033
- Figure 39: Middle East & Africa RS232/RS422/RS485 Drives Revenue (billion), by Application 2025 & 2033
- Figure 40: Middle East & Africa RS232/RS422/RS485 Drives Volume (K), by Application 2025 & 2033
- Figure 41: Middle East & Africa RS232/RS422/RS485 Drives Revenue Share (%), by Application 2025 & 2033
- Figure 42: Middle East & Africa RS232/RS422/RS485 Drives Volume Share (%), by Application 2025 & 2033
- Figure 43: Middle East & Africa RS232/RS422/RS485 Drives Revenue (billion), by Types 2025 & 2033
- Figure 44: Middle East & Africa RS232/RS422/RS485 Drives Volume (K), by Types 2025 & 2033
- Figure 45: Middle East & Africa RS232/RS422/RS485 Drives Revenue Share (%), by Types 2025 & 2033
- Figure 46: Middle East & Africa RS232/RS422/RS485 Drives Volume Share (%), by Types 2025 & 2033
- Figure 47: Middle East & Africa RS232/RS422/RS485 Drives Revenue (billion), by Country 2025 & 2033
- Figure 48: Middle East & Africa RS232/RS422/RS485 Drives Volume (K), by Country 2025 & 2033
- Figure 49: Middle East & Africa RS232/RS422/RS485 Drives Revenue Share (%), by Country 2025 & 2033
- Figure 50: Middle East & Africa RS232/RS422/RS485 Drives Volume Share (%), by Country 2025 & 2033
- Figure 51: Asia Pacific RS232/RS422/RS485 Drives Revenue (billion), by Application 2025 & 2033
- Figure 52: Asia Pacific RS232/RS422/RS485 Drives Volume (K), by Application 2025 & 2033
- Figure 53: Asia Pacific RS232/RS422/RS485 Drives Revenue Share (%), by Application 2025 & 2033
- Figure 54: Asia Pacific RS232/RS422/RS485 Drives Volume Share (%), by Application 2025 & 2033
- Figure 55: Asia Pacific RS232/RS422/RS485 Drives Revenue (billion), by Types 2025 & 2033
- Figure 56: Asia Pacific RS232/RS422/RS485 Drives Volume (K), by Types 2025 & 2033
- Figure 57: Asia Pacific RS232/RS422/RS485 Drives Revenue Share (%), by Types 2025 & 2033
- Figure 58: Asia Pacific RS232/RS422/RS485 Drives Volume Share (%), by Types 2025 & 2033
- Figure 59: Asia Pacific RS232/RS422/RS485 Drives Revenue (billion), by Country 2025 & 2033
- Figure 60: Asia Pacific RS232/RS422/RS485 Drives Volume (K), by Country 2025 & 2033
- Figure 61: Asia Pacific RS232/RS422/RS485 Drives Revenue Share (%), by Country 2025 & 2033
- Figure 62: Asia Pacific RS232/RS422/RS485 Drives Volume Share (%), by Country 2025 & 2033
List of Tables
- Table 1: Global RS232/RS422/RS485 Drives Revenue billion Forecast, by Application 2020 & 2033
- Table 2: Global RS232/RS422/RS485 Drives Volume K Forecast, by Application 2020 & 2033
- Table 3: Global RS232/RS422/RS485 Drives Revenue billion Forecast, by Types 2020 & 2033
- Table 4: Global RS232/RS422/RS485 Drives Volume K Forecast, by Types 2020 & 2033
- Table 5: Global RS232/RS422/RS485 Drives Revenue billion Forecast, by Region 2020 & 2033
- Table 6: Global RS232/RS422/RS485 Drives Volume K Forecast, by Region 2020 & 2033
- Table 7: Global RS232/RS422/RS485 Drives Revenue billion Forecast, by Application 2020 & 2033
- Table 8: Global RS232/RS422/RS485 Drives Volume K Forecast, by Application 2020 & 2033
- Table 9: Global RS232/RS422/RS485 Drives Revenue billion Forecast, by Types 2020 & 2033
- Table 10: Global RS232/RS422/RS485 Drives Volume K Forecast, by Types 2020 & 2033
- Table 11: Global RS232/RS422/RS485 Drives Revenue billion Forecast, by Country 2020 & 2033
- Table 12: Global RS232/RS422/RS485 Drives Volume K Forecast, by Country 2020 & 2033
- Table 13: United States RS232/RS422/RS485 Drives Revenue (billion) Forecast, by Application 2020 & 2033
- Table 14: United States RS232/RS422/RS485 Drives Volume (K) Forecast, by Application 2020 & 2033
- Table 15: Canada RS232/RS422/RS485 Drives Revenue (billion) Forecast, by Application 2020 & 2033
- Table 16: Canada RS232/RS422/RS485 Drives Volume (K) Forecast, by Application 2020 & 2033
- Table 17: Mexico RS232/RS422/RS485 Drives Revenue (billion) Forecast, by Application 2020 & 2033
- Table 18: Mexico RS232/RS422/RS485 Drives Volume (K) Forecast, by Application 2020 & 2033
- Table 19: Global RS232/RS422/RS485 Drives Revenue billion Forecast, by Application 2020 & 2033
- Table 20: Global RS232/RS422/RS485 Drives Volume K Forecast, by Application 2020 & 2033
- Table 21: Global RS232/RS422/RS485 Drives Revenue billion Forecast, by Types 2020 & 2033
- Table 22: Global RS232/RS422/RS485 Drives Volume K Forecast, by Types 2020 & 2033
- Table 23: Global RS232/RS422/RS485 Drives Revenue billion Forecast, by Country 2020 & 2033
- Table 24: Global RS232/RS422/RS485 Drives Volume K Forecast, by Country 2020 & 2033
- Table 25: Brazil RS232/RS422/RS485 Drives Revenue (billion) Forecast, by Application 2020 & 2033
- Table 26: Brazil RS232/RS422/RS485 Drives Volume (K) Forecast, by Application 2020 & 2033
- Table 27: Argentina RS232/RS422/RS485 Drives Revenue (billion) Forecast, by Application 2020 & 2033
- Table 28: Argentina RS232/RS422/RS485 Drives Volume (K) Forecast, by Application 2020 & 2033
- Table 29: Rest of South America RS232/RS422/RS485 Drives Revenue (billion) Forecast, by Application 2020 & 2033
- Table 30: Rest of South America RS232/RS422/RS485 Drives Volume (K) Forecast, by Application 2020 & 2033
- Table 31: Global RS232/RS422/RS485 Drives Revenue billion Forecast, by Application 2020 & 2033
- Table 32: Global RS232/RS422/RS485 Drives Volume K Forecast, by Application 2020 & 2033
- Table 33: Global RS232/RS422/RS485 Drives Revenue billion Forecast, by Types 2020 & 2033
- Table 34: Global RS232/RS422/RS485 Drives Volume K Forecast, by Types 2020 & 2033
- Table 35: Global RS232/RS422/RS485 Drives Revenue billion Forecast, by Country 2020 & 2033
- Table 36: Global RS232/RS422/RS485 Drives Volume K Forecast, by Country 2020 & 2033
- Table 37: United Kingdom RS232/RS422/RS485 Drives Revenue (billion) Forecast, by Application 2020 & 2033
- Table 38: United Kingdom RS232/RS422/RS485 Drives Volume (K) Forecast, by Application 2020 & 2033
- Table 39: Germany RS232/RS422/RS485 Drives Revenue (billion) Forecast, by Application 2020 & 2033
- Table 40: Germany RS232/RS422/RS485 Drives Volume (K) Forecast, by Application 2020 & 2033
- Table 41: France RS232/RS422/RS485 Drives Revenue (billion) Forecast, by Application 2020 & 2033
- Table 42: France RS232/RS422/RS485 Drives Volume (K) Forecast, by Application 2020 & 2033
- Table 43: Italy RS232/RS422/RS485 Drives Revenue (billion) Forecast, by Application 2020 & 2033
- Table 44: Italy RS232/RS422/RS485 Drives Volume (K) Forecast, by Application 2020 & 2033
- Table 45: Spain RS232/RS422/RS485 Drives Revenue (billion) Forecast, by Application 2020 & 2033
- Table 46: Spain RS232/RS422/RS485 Drives Volume (K) Forecast, by Application 2020 & 2033
- Table 47: Russia RS232/RS422/RS485 Drives Revenue (billion) Forecast, by Application 2020 & 2033
- Table 48: Russia RS232/RS422/RS485 Drives Volume (K) Forecast, by Application 2020 & 2033
- Table 49: Benelux RS232/RS422/RS485 Drives Revenue (billion) Forecast, by Application 2020 & 2033
- Table 50: Benelux RS232/RS422/RS485 Drives Volume (K) Forecast, by Application 2020 & 2033
- Table 51: Nordics RS232/RS422/RS485 Drives Revenue (billion) Forecast, by Application 2020 & 2033
- Table 52: Nordics RS232/RS422/RS485 Drives Volume (K) Forecast, by Application 2020 & 2033
- Table 53: Rest of Europe RS232/RS422/RS485 Drives Revenue (billion) Forecast, by Application 2020 & 2033
- Table 54: Rest of Europe RS232/RS422/RS485 Drives Volume (K) Forecast, by Application 2020 & 2033
- Table 55: Global RS232/RS422/RS485 Drives Revenue billion Forecast, by Application 2020 & 2033
- Table 56: Global RS232/RS422/RS485 Drives Volume K Forecast, by Application 2020 & 2033
- Table 57: Global RS232/RS422/RS485 Drives Revenue billion Forecast, by Types 2020 & 2033
- Table 58: Global RS232/RS422/RS485 Drives Volume K Forecast, by Types 2020 & 2033
- Table 59: Global RS232/RS422/RS485 Drives Revenue billion Forecast, by Country 2020 & 2033
- Table 60: Global RS232/RS422/RS485 Drives Volume K Forecast, by Country 2020 & 2033
- Table 61: Turkey RS232/RS422/RS485 Drives Revenue (billion) Forecast, by Application 2020 & 2033
- Table 62: Turkey RS232/RS422/RS485 Drives Volume (K) Forecast, by Application 2020 & 2033
- Table 63: Israel RS232/RS422/RS485 Drives Revenue (billion) Forecast, by Application 2020 & 2033
- Table 64: Israel RS232/RS422/RS485 Drives Volume (K) Forecast, by Application 2020 & 2033
- Table 65: GCC RS232/RS422/RS485 Drives Revenue (billion) Forecast, by Application 2020 & 2033
- Table 66: GCC RS232/RS422/RS485 Drives Volume (K) Forecast, by Application 2020 & 2033
- Table 67: North Africa RS232/RS422/RS485 Drives Revenue (billion) Forecast, by Application 2020 & 2033
- Table 68: North Africa RS232/RS422/RS485 Drives Volume (K) Forecast, by Application 2020 & 2033
- Table 69: South Africa RS232/RS422/RS485 Drives Revenue (billion) Forecast, by Application 2020 & 2033
- Table 70: South Africa RS232/RS422/RS485 Drives Volume (K) Forecast, by Application 2020 & 2033
- Table 71: Rest of Middle East & Africa RS232/RS422/RS485 Drives Revenue (billion) Forecast, by Application 2020 & 2033
- Table 72: Rest of Middle East & Africa RS232/RS422/RS485 Drives Volume (K) Forecast, by Application 2020 & 2033
- Table 73: Global RS232/RS422/RS485 Drives Revenue billion Forecast, by Application 2020 & 2033
- Table 74: Global RS232/RS422/RS485 Drives Volume K Forecast, by Application 2020 & 2033
- Table 75: Global RS232/RS422/RS485 Drives Revenue billion Forecast, by Types 2020 & 2033
- Table 76: Global RS232/RS422/RS485 Drives Volume K Forecast, by Types 2020 & 2033
- Table 77: Global RS232/RS422/RS485 Drives Revenue billion Forecast, by Country 2020 & 2033
- Table 78: Global RS232/RS422/RS485 Drives Volume K Forecast, by Country 2020 & 2033
- Table 79: China RS232/RS422/RS485 Drives Revenue (billion) Forecast, by Application 2020 & 2033
- Table 80: China RS232/RS422/RS485 Drives Volume (K) Forecast, by Application 2020 & 2033
- Table 81: India RS232/RS422/RS485 Drives Revenue (billion) Forecast, by Application 2020 & 2033
- Table 82: India RS232/RS422/RS485 Drives Volume (K) Forecast, by Application 2020 & 2033
- Table 83: Japan RS232/RS422/RS485 Drives Revenue (billion) Forecast, by Application 2020 & 2033
- Table 84: Japan RS232/RS422/RS485 Drives Volume (K) Forecast, by Application 2020 & 2033
- Table 85: South Korea RS232/RS422/RS485 Drives Revenue (billion) Forecast, by Application 2020 & 2033
- Table 86: South Korea RS232/RS422/RS485 Drives Volume (K) Forecast, by Application 2020 & 2033
- Table 87: ASEAN RS232/RS422/RS485 Drives Revenue (billion) Forecast, by Application 2020 & 2033
- Table 88: ASEAN RS232/RS422/RS485 Drives Volume (K) Forecast, by Application 2020 & 2033
- Table 89: Oceania RS232/RS422/RS485 Drives Revenue (billion) Forecast, by Application 2020 & 2033
- Table 90: Oceania RS232/RS422/RS485 Drives Volume (K) Forecast, by Application 2020 & 2033
- Table 91: Rest of Asia Pacific RS232/RS422/RS485 Drives Revenue (billion) Forecast, by Application 2020 & 2033
- Table 92: Rest of Asia Pacific RS232/RS422/RS485 Drives Volume (K) Forecast, by Application 2020 & 2033
Frequently Asked Questions
1. What is the projected Compound Annual Growth Rate (CAGR) of the RS232/RS422/RS485 Drives?
The projected CAGR is approximately 6.49%.
2. Which companies are prominent players in the RS232/RS422/RS485 Drives?
Key companies in the market include Texas Instruments, Renesas, STMicroelectronics, Analog Devices, NVE, ONsemi.
3. What are the main segments of the RS232/RS422/RS485 Drives?
The market segments include Application, Types.
4. Can you provide details about the market size?
The market size is estimated to be USD 1.05 billion as of 2022.
5. What are some drivers contributing to market growth?
N/A
6. What are the notable trends driving market growth?
N/A
7. Are there any restraints impacting market growth?
N/A
8. Can you provide examples of recent developments in the market?
N/A
9. What pricing options are available for accessing the report?
Pricing options include single-user, multi-user, and enterprise licenses priced at USD 4350.00, USD 6525.00, and USD 8700.00 respectively.
10. Is the market size provided in terms of value or volume?
The market size is provided in terms of value, measured in billion and volume, measured in K.
11. Are there any specific market keywords associated with the report?
Yes, the market keyword associated with the report is "RS232/RS422/RS485 Drives," which aids in identifying and referencing the specific market segment covered.
12. How do I determine which pricing option suits my needs best?
The pricing options vary based on user requirements and access needs. Individual users may opt for single-user licenses, while businesses requiring broader access may choose multi-user or enterprise licenses for cost-effective access to the report.
13. Are there any additional resources or data provided in the RS232/RS422/RS485 Drives report?
While the report offers comprehensive insights, it's advisable to review the specific contents or supplementary materials provided to ascertain if additional resources or data are available.
14. How can I stay updated on further developments or reports in the RS232/RS422/RS485 Drives?
To stay informed about further developments, trends, and reports in the RS232/RS422/RS485 Drives, consider subscribing to industry newsletters, following relevant companies and organizations, or regularly checking reputable industry news sources and publications.
Methodology
Step 1 - Identification of Relevant Samples Size from Population Database


Step 2 - Approaches for Defining Global Market Size (Value, Volume* & Price*)

Note*: In applicable scenarios
Step 3 - Data Sources
Primary Research
- Web Analytics
- Survey Reports
- Research Institute
- Latest Research Reports
- Opinion Leaders
Secondary Research
- Annual Reports
- White Paper
- Latest Press Release
- Industry Association
- Paid Database
- Investor Presentations

Step 4 - Data Triangulation
Involves using different sources of information in order to increase the validity of a study
These sources are likely to be stakeholders in a program - participants, other researchers, program staff, other community members, and so on.
Then we put all data in single framework & apply various statistical tools to find out the dynamic on the market.
During the analysis stage, feedback from the stakeholder groups would be compared to determine areas of agreement as well as areas of divergence