
Key Insights
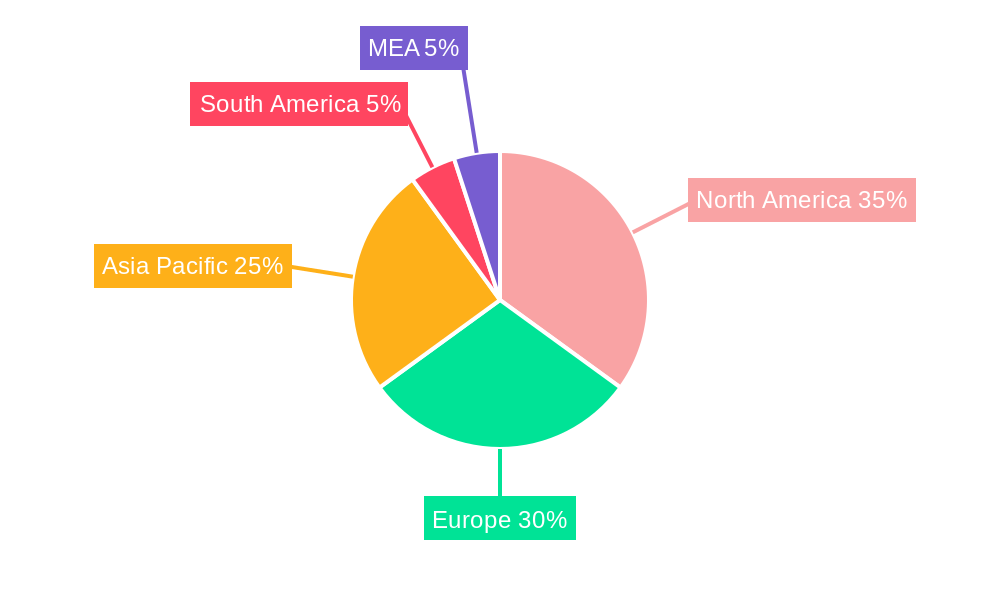
The resorbable polymers market is experiencing robust growth, driven by the increasing demand for biodegradable and biocompatible materials in various medical applications. The market's Compound Annual Growth Rate (CAGR) exceeding 10% signifies significant expansion potential throughout the forecast period (2025-2033). Key drivers include the rising prevalence of chronic diseases necessitating implantable devices, the growing preference for minimally invasive surgeries, and advancements in polymer chemistry leading to improved biodegradability and mechanical properties. The drug delivery segment is a major revenue contributor, fueled by the development of innovative drug eluting stents and controlled-release systems. Orthopedics represents another significant application area, with resorbable polymers finding use in bone fixation devices and tissue engineering scaffolds. While the market faces restraints such as regulatory hurdles and potential concerns about biocompatibility in specific applications, ongoing research and development efforts are addressing these challenges, paving the way for broader adoption. Polylactic acid (PLA) currently holds a dominant market share among the various polymer types due to its established track record and cost-effectiveness. However, other polymers like polyglycolic acid (PGA), polycaprolactone (PCL), and their copolymers are gaining traction due to their unique properties, leading to a more diverse market landscape. Geographical expansion is also driving growth, with North America and Europe currently leading the market, followed by the rapidly developing Asia-Pacific region.
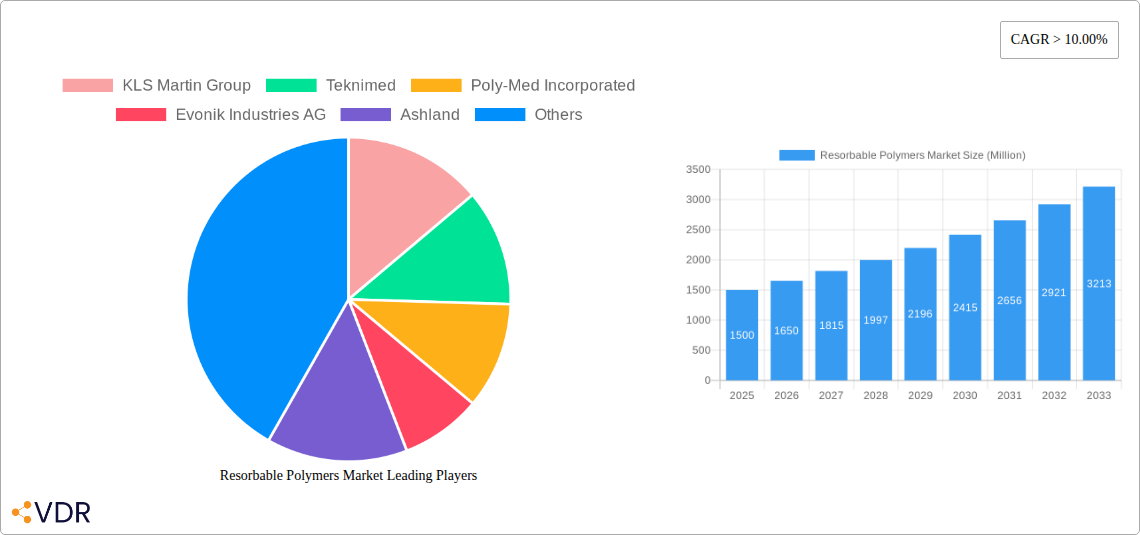
The competitive landscape is characterized by a mix of established players and emerging companies. Key players like KLS Martin Group, Teknimed, Poly-Med Incorporated, Evonik Industries AG, Ashland, Biogeneral, Foster Corporation, and CORBION are investing in research and development to enhance their product offerings and expand their market reach. Strategic partnerships, acquisitions, and technological advancements will continue to shape the competitive dynamics within the industry. The future growth of the resorbable polymers market is expected to be fueled by continued innovation in material science, the expansion of applications into new therapeutic areas, and the increasing demand for safe and effective medical implants worldwide. The market is anticipated to witness significant expansion in developing economies with growing healthcare infrastructure and rising disposable incomes, fostering greater adoption of advanced medical technologies.
Resorbable Polymers Market Report: 2019-2033
This comprehensive report provides a detailed analysis of the Resorbable Polymers market, encompassing its dynamics, growth trends, leading players, and future outlook. The study covers the period from 2019 to 2033, with 2025 serving as the base and estimated year. The parent market is the broader biomedical materials sector, while the child markets include drug delivery systems and orthopedic implants. This report is crucial for businesses, investors, and researchers seeking to understand and capitalize on the opportunities within this rapidly evolving market. Market values are presented in million units.
Resorbable Polymers Market Dynamics & Structure
The resorbable polymers market is characterized by moderate concentration, with a few major players holding significant market share, while numerous smaller companies focus on niche applications. Technological innovation, particularly in biodegradability and biocompatibility, is a key driver. Stringent regulatory frameworks governing biomaterials impact market entry and product development. Competitive substitutes, such as metallic implants, exert pressure, but the advantages of resorbable polymers in terms of reduced secondary surgery and improved patient outcomes drive adoption. End-user demographics are shifting towards an aging population with increased demand for minimally invasive procedures. M&A activity is moderate, reflecting consolidation and expansion efforts within the industry.
- Market Concentration: Moderately concentrated, with top 5 players holding approximately xx% of market share in 2024.
- Technological Innovation: Focus on enhanced biodegradability, improved mechanical properties, and tailored drug release profiles.
- Regulatory Landscape: Stringent regulatory approvals (e.g., FDA, CE Mark) increase development costs and timelines.
- Competitive Substitutes: Metallic implants and other biomaterials offer competition, but resorbable polymers offer advantages in specific applications.
- M&A Activity: xx deals recorded between 2019 and 2024, indicating moderate consolidation.
- Innovation Barriers: High R&D costs, complex regulatory pathways, and challenges in achieving consistent biodegradation.
Resorbable Polymers Market Growth Trends & Insights
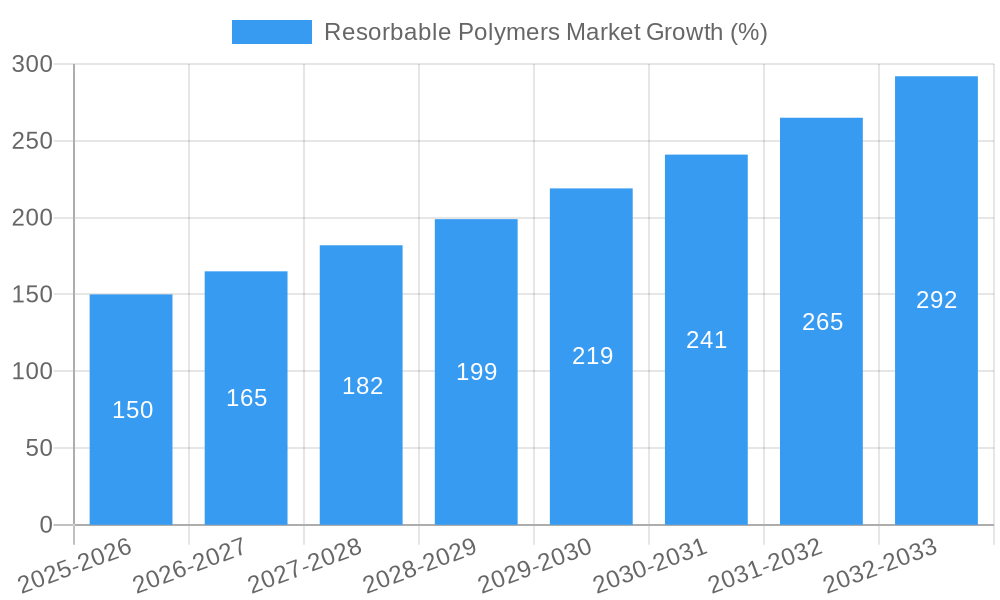
The resorbable polymers market exhibited a CAGR of xx% during the historical period (2019-2024), reaching a market size of xx million units in 2024. This growth is fueled by increasing demand for minimally invasive surgeries, rising prevalence of chronic diseases requiring drug delivery systems, and advancements in material science leading to improved biocompatibility and performance. Technological disruptions, such as the development of novel biodegradable polymers with enhanced properties, have significantly accelerated market expansion. Consumer behavior shifts towards personalized medicine and patient-centric care further bolster market growth. The market is projected to maintain a robust CAGR of xx% during the forecast period (2025-2033), driven by continued innovation and increasing adoption across various applications. Market penetration is expected to increase from xx% in 2024 to xx% by 2033.
Dominant Regions, Countries, or Segments in Resorbable Polymers Market
North America currently holds the largest market share within the resorbable polymers market, driven by robust healthcare infrastructure, high adoption rates of advanced medical technologies, and significant R&D investments. Europe follows as a major market, with strong regulatory frameworks supporting innovation and market growth. Within material segments, Polylactic Acid (PLA) and Polyglycolic Acid (PGA) dominate due to their established track record and widespread use in various applications. The Orthopedics segment is the largest application area, accounting for a significant portion of market revenue, followed by drug delivery systems.
- Key Drivers in North America: High healthcare expenditure, strong regulatory support for innovation, and a large aging population.
- Key Drivers in Europe: Well-established healthcare infrastructure, advanced medical technologies adoption, and focus on minimally invasive procedures.
- Dominant Material Segment: PLA and PGA dominate due to established biocompatibility and ease of processing.
- Dominant Application Segment: Orthopedics holds the largest market share due to high demand for resorbable implants.
- Growth Potential: Asia-Pacific is projected to demonstrate significant growth potential due to rising healthcare spending and increasing awareness of advanced medical treatments.
Resorbable Polymers Market Product Landscape
The resorbable polymers market offers a diverse range of products tailored to specific applications, including sutures, implants, drug delivery devices, and tissue engineering scaffolds. Recent innovations focus on enhancing biodegradability, mechanical strength, and biocompatibility. Products with tailored drug release profiles are gaining traction, enabling targeted therapeutic delivery. Unique selling propositions often include superior biocompatibility, faster degradation rates, and improved mechanical properties compared to existing alternatives. Technological advancements are leading to the development of polymers with improved tissue integration and reduced inflammation.
Key Drivers, Barriers & Challenges in Resorbable Polymers Market
Key Drivers:
- Increasing demand for minimally invasive surgical procedures.
- Rising prevalence of chronic diseases requiring drug delivery systems.
- Technological advancements leading to improved biocompatibility and performance.
- Favorable regulatory environment in key markets.
Key Challenges:
- High R&D costs and lengthy regulatory approval processes.
- Competition from established biomaterials like metals and ceramics.
- Ensuring consistent and predictable biodegradation profiles.
- Supply chain disruptions and material sourcing challenges. An estimated xx% impact on market growth due to supply chain issues in 2024.
Emerging Opportunities in Resorbable Polymers Market
- Growing demand for personalized medicine and targeted drug delivery.
- Expanding applications in tissue engineering and regenerative medicine.
- Development of novel biodegradable polymers with enhanced properties.
- Increased focus on sustainable and environmentally friendly biomaterials.
Growth Accelerators in the Resorbable Polymers Market Industry
Technological breakthroughs in polymer synthesis are paving the way for new materials with superior properties. Strategic partnerships between material suppliers and medical device manufacturers are driving innovation and product development. Market expansion into emerging economies with increasing healthcare spending offers substantial growth opportunities. The development of advanced manufacturing techniques enabling the creation of complex and customized implants further accelerates market growth.
Key Players Shaping the Resorbable Polymers Market Market
- KLS Martin Group
- Teknimed
- Poly-Med Incorporated
- Evonik Industries AG
- Ashland
- Biogeneral
- Foster Corporation
- CORBION
Notable Milestones in Resorbable Polymers Market Sector
- Jan 2021: Evonik announced the closing of the LACTEL Absorbable Polymers acquisition from DURECT Corporation, expanding its portfolio and market presence.
In-Depth Resorbable Polymers Market Market Outlook
The resorbable polymers market is poised for continued growth, driven by ongoing technological advancements, expanding applications, and rising demand in healthcare. Strategic collaborations and investments in R&D will shape the competitive landscape. Opportunities exist in developing novel biomaterials with enhanced functionalities and exploring new applications in regenerative medicine and personalized healthcare. The market’s future potential is significant, offering attractive prospects for both established players and new entrants.
Resorbable Polymers Market Segmentation
-
1. Material
- 1.1. Polylactic Acid (PLA)
- 1.2. Polyglycolic Acid (PGA)
- 1.3. Polycaprolactone (PCL)
- 1.4. PGA/PLA Copolymers
-
2. Application
- 2.1. Drug Delivery
- 2.2. Orthopedics
Resorbable Polymers Market Segmentation By Geography
-
1. Asia Pacific
- 1.1. China
- 1.2. India
- 1.3. Japan
- 1.4. South Korea
- 1.5. Rest of Asia Pacific
-
2. North America
- 2.1. United States
- 2.2. Canada
- 2.3. Mexico
-
3. Europe
- 3.1. Germany
- 3.2. United Kingdom
- 3.3. Italy
- 3.4. France
- 3.5. Rest of Europe
-
4. South America
- 4.1. Brazil
- 4.2. Argentina
- 4.3. Rest of South America
-
5. Middle East & Africa
- 5.1. UAE
- 5.2. Saudi Arabia
- 5.3. South Africa
- 5.4. Rest of Middle East & Africa
Resorbable Polymers Market REPORT HIGHLIGHTS
| Aspects | Details |
|---|---|
| Study Period | 2019-2033 |
| Base Year | 2024 |
| Estimated Year | 2025 |
| Forecast Period | 2025-2033 |
| Historical Period | 2019-2024 |
| Growth Rate | CAGR of > 10.00% from 2019-2033 |
| Segmentation |
|
Table of Contents
- 1. Introduction
- 1.1. Research Scope
- 1.2. Market Segmentation
- 1.3. Research Methodology
- 1.4. Definitions and Assumptions
- 2. Executive Summary
- 2.1. Introduction
- 3. Market Dynamics
- 3.1. Introduction
- 3.2. Market Drivers
- 3.2.1. Growing Demand from Medical Industry; Other Drivers
- 3.3. Market Restrains
- 3.3.1. Other Restraints
- 3.4. Market Trends
- 3.4.1. Orthopedics to Dominate the Market
- 4. Market Factor Analysis
- 4.1. Porters Five Forces
- 4.2. Supply/Value Chain
- 4.3. PESTEL analysis
- 4.4. Market Entropy
- 4.5. Patent/Trademark Analysis
- 5. Global Resorbable Polymers Market Analysis, Insights and Forecast, 2019-2031
- 5.1. Market Analysis, Insights and Forecast - by Material
- 5.1.1. Polylactic Acid (PLA)
- 5.1.2. Polyglycolic Acid (PGA)
- 5.1.3. Polycaprolactone (PCL)
- 5.1.4. PGA/PLA Copolymers
- 5.2. Market Analysis, Insights and Forecast - by Application
- 5.2.1. Drug Delivery
- 5.2.2. Orthopedics
- 5.3. Market Analysis, Insights and Forecast - by Region
- 5.3.1. Asia Pacific
- 5.3.2. North America
- 5.3.3. Europe
- 5.3.4. South America
- 5.3.5. Middle East & Africa
- 5.1. Market Analysis, Insights and Forecast - by Material
- 6. Asia Pacific Resorbable Polymers Market Analysis, Insights and Forecast, 2019-2031
- 6.1. Market Analysis, Insights and Forecast - by Material
- 6.1.1. Polylactic Acid (PLA)
- 6.1.2. Polyglycolic Acid (PGA)
- 6.1.3. Polycaprolactone (PCL)
- 6.1.4. PGA/PLA Copolymers
- 6.2. Market Analysis, Insights and Forecast - by Application
- 6.2.1. Drug Delivery
- 6.2.2. Orthopedics
- 6.1. Market Analysis, Insights and Forecast - by Material
- 7. North America Resorbable Polymers Market Analysis, Insights and Forecast, 2019-2031
- 7.1. Market Analysis, Insights and Forecast - by Material
- 7.1.1. Polylactic Acid (PLA)
- 7.1.2. Polyglycolic Acid (PGA)
- 7.1.3. Polycaprolactone (PCL)
- 7.1.4. PGA/PLA Copolymers
- 7.2. Market Analysis, Insights and Forecast - by Application
- 7.2.1. Drug Delivery
- 7.2.2. Orthopedics
- 7.1. Market Analysis, Insights and Forecast - by Material
- 8. Europe Resorbable Polymers Market Analysis, Insights and Forecast, 2019-2031
- 8.1. Market Analysis, Insights and Forecast - by Material
- 8.1.1. Polylactic Acid (PLA)
- 8.1.2. Polyglycolic Acid (PGA)
- 8.1.3. Polycaprolactone (PCL)
- 8.1.4. PGA/PLA Copolymers
- 8.2. Market Analysis, Insights and Forecast - by Application
- 8.2.1. Drug Delivery
- 8.2.2. Orthopedics
- 8.1. Market Analysis, Insights and Forecast - by Material
- 9. South America Resorbable Polymers Market Analysis, Insights and Forecast, 2019-2031
- 9.1. Market Analysis, Insights and Forecast - by Material
- 9.1.1. Polylactic Acid (PLA)
- 9.1.2. Polyglycolic Acid (PGA)
- 9.1.3. Polycaprolactone (PCL)
- 9.1.4. PGA/PLA Copolymers
- 9.2. Market Analysis, Insights and Forecast - by Application
- 9.2.1. Drug Delivery
- 9.2.2. Orthopedics
- 9.1. Market Analysis, Insights and Forecast - by Material
- 10. Middle East & Africa Resorbable Polymers Market Analysis, Insights and Forecast, 2019-2031
- 10.1. Market Analysis, Insights and Forecast - by Material
- 10.1.1. Polylactic Acid (PLA)
- 10.1.2. Polyglycolic Acid (PGA)
- 10.1.3. Polycaprolactone (PCL)
- 10.1.4. PGA/PLA Copolymers
- 10.2. Market Analysis, Insights and Forecast - by Application
- 10.2.1. Drug Delivery
- 10.2.2. Orthopedics
- 10.1. Market Analysis, Insights and Forecast - by Material
- 11. North America Resorbable Polymers Market Analysis, Insights and Forecast, 2019-2031
- 11.1. Market Analysis, Insights and Forecast - By Country/Sub-region
- 11.1.1 United States
- 11.1.2 Canada
- 11.1.3 Mexico
- 12. Europe Resorbable Polymers Market Analysis, Insights and Forecast, 2019-2031
- 12.1. Market Analysis, Insights and Forecast - By Country/Sub-region
- 12.1.1 Germany
- 12.1.2 United Kingdom
- 12.1.3 France
- 12.1.4 Spain
- 12.1.5 Italy
- 12.1.6 Spain
- 12.1.7 Belgium
- 12.1.8 Netherland
- 12.1.9 Nordics
- 12.1.10 Rest of Europe
- 13. Asia Pacific Resorbable Polymers Market Analysis, Insights and Forecast, 2019-2031
- 13.1. Market Analysis, Insights and Forecast - By Country/Sub-region
- 13.1.1 China
- 13.1.2 Japan
- 13.1.3 India
- 13.1.4 South Korea
- 13.1.5 Southeast Asia
- 13.1.6 Australia
- 13.1.7 Indonesia
- 13.1.8 Phillipes
- 13.1.9 Singapore
- 13.1.10 Thailandc
- 13.1.11 Rest of Asia Pacific
- 14. South America Resorbable Polymers Market Analysis, Insights and Forecast, 2019-2031
- 14.1. Market Analysis, Insights and Forecast - By Country/Sub-region
- 14.1.1 Brazil
- 14.1.2 Argentina
- 14.1.3 Peru
- 14.1.4 Chile
- 14.1.5 Colombia
- 14.1.6 Ecuador
- 14.1.7 Venezuela
- 14.1.8 Rest of South America
- 15. North America Resorbable Polymers Market Analysis, Insights and Forecast, 2019-2031
- 15.1. Market Analysis, Insights and Forecast - By Country/Sub-region
- 15.1.1 United States
- 15.1.2 Canada
- 15.1.3 Mexico
- 16. MEA Resorbable Polymers Market Analysis, Insights and Forecast, 2019-2031
- 16.1. Market Analysis, Insights and Forecast - By Country/Sub-region
- 16.1.1 United Arab Emirates
- 16.1.2 Saudi Arabia
- 16.1.3 South Africa
- 16.1.4 Rest of Middle East and Africa
- 17. Competitive Analysis
- 17.1. Global Market Share Analysis 2024
- 17.2. Company Profiles
- 17.2.1 KLS Martin Group
- 17.2.1.1. Overview
- 17.2.1.2. Products
- 17.2.1.3. SWOT Analysis
- 17.2.1.4. Recent Developments
- 17.2.1.5. Financials (Based on Availability)
- 17.2.2 Teknimed
- 17.2.2.1. Overview
- 17.2.2.2. Products
- 17.2.2.3. SWOT Analysis
- 17.2.2.4. Recent Developments
- 17.2.2.5. Financials (Based on Availability)
- 17.2.3 Poly-Med Incorporated
- 17.2.3.1. Overview
- 17.2.3.2. Products
- 17.2.3.3. SWOT Analysis
- 17.2.3.4. Recent Developments
- 17.2.3.5. Financials (Based on Availability)
- 17.2.4 Evonik Industries AG
- 17.2.4.1. Overview
- 17.2.4.2. Products
- 17.2.4.3. SWOT Analysis
- 17.2.4.4. Recent Developments
- 17.2.4.5. Financials (Based on Availability)
- 17.2.5 Ashland
- 17.2.5.1. Overview
- 17.2.5.2. Products
- 17.2.5.3. SWOT Analysis
- 17.2.5.4. Recent Developments
- 17.2.5.5. Financials (Based on Availability)
- 17.2.6 Biogeneral
- 17.2.6.1. Overview
- 17.2.6.2. Products
- 17.2.6.3. SWOT Analysis
- 17.2.6.4. Recent Developments
- 17.2.6.5. Financials (Based on Availability)
- 17.2.7 Foster Corporation
- 17.2.7.1. Overview
- 17.2.7.2. Products
- 17.2.7.3. SWOT Analysis
- 17.2.7.4. Recent Developments
- 17.2.7.5. Financials (Based on Availability)
- 17.2.8 CORBION
- 17.2.8.1. Overview
- 17.2.8.2. Products
- 17.2.8.3. SWOT Analysis
- 17.2.8.4. Recent Developments
- 17.2.8.5. Financials (Based on Availability)
- 17.2.1 KLS Martin Group
List of Figures
- Figure 1: Global Resorbable Polymers Market Revenue Breakdown (Million, %) by Region 2024 & 2032
- Figure 2: Global Resorbable Polymers Market Volume Breakdown (K Tons, %) by Region 2024 & 2032
- Figure 3: North America Resorbable Polymers Market Revenue (Million), by Country 2024 & 2032
- Figure 4: North America Resorbable Polymers Market Volume (K Tons), by Country 2024 & 2032
- Figure 5: North America Resorbable Polymers Market Revenue Share (%), by Country 2024 & 2032
- Figure 6: North America Resorbable Polymers Market Volume Share (%), by Country 2024 & 2032
- Figure 7: Europe Resorbable Polymers Market Revenue (Million), by Country 2024 & 2032
- Figure 8: Europe Resorbable Polymers Market Volume (K Tons), by Country 2024 & 2032
- Figure 9: Europe Resorbable Polymers Market Revenue Share (%), by Country 2024 & 2032
- Figure 10: Europe Resorbable Polymers Market Volume Share (%), by Country 2024 & 2032
- Figure 11: Asia Pacific Resorbable Polymers Market Revenue (Million), by Country 2024 & 2032
- Figure 12: Asia Pacific Resorbable Polymers Market Volume (K Tons), by Country 2024 & 2032
- Figure 13: Asia Pacific Resorbable Polymers Market Revenue Share (%), by Country 2024 & 2032
- Figure 14: Asia Pacific Resorbable Polymers Market Volume Share (%), by Country 2024 & 2032
- Figure 15: South America Resorbable Polymers Market Revenue (Million), by Country 2024 & 2032
- Figure 16: South America Resorbable Polymers Market Volume (K Tons), by Country 2024 & 2032
- Figure 17: South America Resorbable Polymers Market Revenue Share (%), by Country 2024 & 2032
- Figure 18: South America Resorbable Polymers Market Volume Share (%), by Country 2024 & 2032
- Figure 19: North America Resorbable Polymers Market Revenue (Million), by Country 2024 & 2032
- Figure 20: North America Resorbable Polymers Market Volume (K Tons), by Country 2024 & 2032
- Figure 21: North America Resorbable Polymers Market Revenue Share (%), by Country 2024 & 2032
- Figure 22: North America Resorbable Polymers Market Volume Share (%), by Country 2024 & 2032
- Figure 23: MEA Resorbable Polymers Market Revenue (Million), by Country 2024 & 2032
- Figure 24: MEA Resorbable Polymers Market Volume (K Tons), by Country 2024 & 2032
- Figure 25: MEA Resorbable Polymers Market Revenue Share (%), by Country 2024 & 2032
- Figure 26: MEA Resorbable Polymers Market Volume Share (%), by Country 2024 & 2032
- Figure 27: Asia Pacific Resorbable Polymers Market Revenue (Million), by Material 2024 & 2032
- Figure 28: Asia Pacific Resorbable Polymers Market Volume (K Tons), by Material 2024 & 2032
- Figure 29: Asia Pacific Resorbable Polymers Market Revenue Share (%), by Material 2024 & 2032
- Figure 30: Asia Pacific Resorbable Polymers Market Volume Share (%), by Material 2024 & 2032
- Figure 31: Asia Pacific Resorbable Polymers Market Revenue (Million), by Application 2024 & 2032
- Figure 32: Asia Pacific Resorbable Polymers Market Volume (K Tons), by Application 2024 & 2032
- Figure 33: Asia Pacific Resorbable Polymers Market Revenue Share (%), by Application 2024 & 2032
- Figure 34: Asia Pacific Resorbable Polymers Market Volume Share (%), by Application 2024 & 2032
- Figure 35: Asia Pacific Resorbable Polymers Market Revenue (Million), by Country 2024 & 2032
- Figure 36: Asia Pacific Resorbable Polymers Market Volume (K Tons), by Country 2024 & 2032
- Figure 37: Asia Pacific Resorbable Polymers Market Revenue Share (%), by Country 2024 & 2032
- Figure 38: Asia Pacific Resorbable Polymers Market Volume Share (%), by Country 2024 & 2032
- Figure 39: North America Resorbable Polymers Market Revenue (Million), by Material 2024 & 2032
- Figure 40: North America Resorbable Polymers Market Volume (K Tons), by Material 2024 & 2032
- Figure 41: North America Resorbable Polymers Market Revenue Share (%), by Material 2024 & 2032
- Figure 42: North America Resorbable Polymers Market Volume Share (%), by Material 2024 & 2032
- Figure 43: North America Resorbable Polymers Market Revenue (Million), by Application 2024 & 2032
- Figure 44: North America Resorbable Polymers Market Volume (K Tons), by Application 2024 & 2032
- Figure 45: North America Resorbable Polymers Market Revenue Share (%), by Application 2024 & 2032
- Figure 46: North America Resorbable Polymers Market Volume Share (%), by Application 2024 & 2032
- Figure 47: North America Resorbable Polymers Market Revenue (Million), by Country 2024 & 2032
- Figure 48: North America Resorbable Polymers Market Volume (K Tons), by Country 2024 & 2032
- Figure 49: North America Resorbable Polymers Market Revenue Share (%), by Country 2024 & 2032
- Figure 50: North America Resorbable Polymers Market Volume Share (%), by Country 2024 & 2032
- Figure 51: Europe Resorbable Polymers Market Revenue (Million), by Material 2024 & 2032
- Figure 52: Europe Resorbable Polymers Market Volume (K Tons), by Material 2024 & 2032
- Figure 53: Europe Resorbable Polymers Market Revenue Share (%), by Material 2024 & 2032
- Figure 54: Europe Resorbable Polymers Market Volume Share (%), by Material 2024 & 2032
- Figure 55: Europe Resorbable Polymers Market Revenue (Million), by Application 2024 & 2032
- Figure 56: Europe Resorbable Polymers Market Volume (K Tons), by Application 2024 & 2032
- Figure 57: Europe Resorbable Polymers Market Revenue Share (%), by Application 2024 & 2032
- Figure 58: Europe Resorbable Polymers Market Volume Share (%), by Application 2024 & 2032
- Figure 59: Europe Resorbable Polymers Market Revenue (Million), by Country 2024 & 2032
- Figure 60: Europe Resorbable Polymers Market Volume (K Tons), by Country 2024 & 2032
- Figure 61: Europe Resorbable Polymers Market Revenue Share (%), by Country 2024 & 2032
- Figure 62: Europe Resorbable Polymers Market Volume Share (%), by Country 2024 & 2032
- Figure 63: South America Resorbable Polymers Market Revenue (Million), by Material 2024 & 2032
- Figure 64: South America Resorbable Polymers Market Volume (K Tons), by Material 2024 & 2032
- Figure 65: South America Resorbable Polymers Market Revenue Share (%), by Material 2024 & 2032
- Figure 66: South America Resorbable Polymers Market Volume Share (%), by Material 2024 & 2032
- Figure 67: South America Resorbable Polymers Market Revenue (Million), by Application 2024 & 2032
- Figure 68: South America Resorbable Polymers Market Volume (K Tons), by Application 2024 & 2032
- Figure 69: South America Resorbable Polymers Market Revenue Share (%), by Application 2024 & 2032
- Figure 70: South America Resorbable Polymers Market Volume Share (%), by Application 2024 & 2032
- Figure 71: South America Resorbable Polymers Market Revenue (Million), by Country 2024 & 2032
- Figure 72: South America Resorbable Polymers Market Volume (K Tons), by Country 2024 & 2032
- Figure 73: South America Resorbable Polymers Market Revenue Share (%), by Country 2024 & 2032
- Figure 74: South America Resorbable Polymers Market Volume Share (%), by Country 2024 & 2032
- Figure 75: Middle East & Africa Resorbable Polymers Market Revenue (Million), by Material 2024 & 2032
- Figure 76: Middle East & Africa Resorbable Polymers Market Volume (K Tons), by Material 2024 & 2032
- Figure 77: Middle East & Africa Resorbable Polymers Market Revenue Share (%), by Material 2024 & 2032
- Figure 78: Middle East & Africa Resorbable Polymers Market Volume Share (%), by Material 2024 & 2032
- Figure 79: Middle East & Africa Resorbable Polymers Market Revenue (Million), by Application 2024 & 2032
- Figure 80: Middle East & Africa Resorbable Polymers Market Volume (K Tons), by Application 2024 & 2032
- Figure 81: Middle East & Africa Resorbable Polymers Market Revenue Share (%), by Application 2024 & 2032
- Figure 82: Middle East & Africa Resorbable Polymers Market Volume Share (%), by Application 2024 & 2032
- Figure 83: Middle East & Africa Resorbable Polymers Market Revenue (Million), by Country 2024 & 2032
- Figure 84: Middle East & Africa Resorbable Polymers Market Volume (K Tons), by Country 2024 & 2032
- Figure 85: Middle East & Africa Resorbable Polymers Market Revenue Share (%), by Country 2024 & 2032
- Figure 86: Middle East & Africa Resorbable Polymers Market Volume Share (%), by Country 2024 & 2032
List of Tables
- Table 1: Global Resorbable Polymers Market Revenue Million Forecast, by Region 2019 & 2032
- Table 2: Global Resorbable Polymers Market Volume K Tons Forecast, by Region 2019 & 2032
- Table 3: Global Resorbable Polymers Market Revenue Million Forecast, by Material 2019 & 2032
- Table 4: Global Resorbable Polymers Market Volume K Tons Forecast, by Material 2019 & 2032
- Table 5: Global Resorbable Polymers Market Revenue Million Forecast, by Application 2019 & 2032
- Table 6: Global Resorbable Polymers Market Volume K Tons Forecast, by Application 2019 & 2032
- Table 7: Global Resorbable Polymers Market Revenue Million Forecast, by Region 2019 & 2032
- Table 8: Global Resorbable Polymers Market Volume K Tons Forecast, by Region 2019 & 2032
- Table 9: Global Resorbable Polymers Market Revenue Million Forecast, by Country 2019 & 2032
- Table 10: Global Resorbable Polymers Market Volume K Tons Forecast, by Country 2019 & 2032
- Table 11: United States Resorbable Polymers Market Revenue (Million) Forecast, by Application 2019 & 2032
- Table 12: United States Resorbable Polymers Market Volume (K Tons) Forecast, by Application 2019 & 2032
- Table 13: Canada Resorbable Polymers Market Revenue (Million) Forecast, by Application 2019 & 2032
- Table 14: Canada Resorbable Polymers Market Volume (K Tons) Forecast, by Application 2019 & 2032
- Table 15: Mexico Resorbable Polymers Market Revenue (Million) Forecast, by Application 2019 & 2032
- Table 16: Mexico Resorbable Polymers Market Volume (K Tons) Forecast, by Application 2019 & 2032
- Table 17: Global Resorbable Polymers Market Revenue Million Forecast, by Country 2019 & 2032
- Table 18: Global Resorbable Polymers Market Volume K Tons Forecast, by Country 2019 & 2032
- Table 19: Germany Resorbable Polymers Market Revenue (Million) Forecast, by Application 2019 & 2032
- Table 20: Germany Resorbable Polymers Market Volume (K Tons) Forecast, by Application 2019 & 2032
- Table 21: United Kingdom Resorbable Polymers Market Revenue (Million) Forecast, by Application 2019 & 2032
- Table 22: United Kingdom Resorbable Polymers Market Volume (K Tons) Forecast, by Application 2019 & 2032
- Table 23: France Resorbable Polymers Market Revenue (Million) Forecast, by Application 2019 & 2032
- Table 24: France Resorbable Polymers Market Volume (K Tons) Forecast, by Application 2019 & 2032
- Table 25: Spain Resorbable Polymers Market Revenue (Million) Forecast, by Application 2019 & 2032
- Table 26: Spain Resorbable Polymers Market Volume (K Tons) Forecast, by Application 2019 & 2032
- Table 27: Italy Resorbable Polymers Market Revenue (Million) Forecast, by Application 2019 & 2032
- Table 28: Italy Resorbable Polymers Market Volume (K Tons) Forecast, by Application 2019 & 2032
- Table 29: Spain Resorbable Polymers Market Revenue (Million) Forecast, by Application 2019 & 2032
- Table 30: Spain Resorbable Polymers Market Volume (K Tons) Forecast, by Application 2019 & 2032
- Table 31: Belgium Resorbable Polymers Market Revenue (Million) Forecast, by Application 2019 & 2032
- Table 32: Belgium Resorbable Polymers Market Volume (K Tons) Forecast, by Application 2019 & 2032
- Table 33: Netherland Resorbable Polymers Market Revenue (Million) Forecast, by Application 2019 & 2032
- Table 34: Netherland Resorbable Polymers Market Volume (K Tons) Forecast, by Application 2019 & 2032
- Table 35: Nordics Resorbable Polymers Market Revenue (Million) Forecast, by Application 2019 & 2032
- Table 36: Nordics Resorbable Polymers Market Volume (K Tons) Forecast, by Application 2019 & 2032
- Table 37: Rest of Europe Resorbable Polymers Market Revenue (Million) Forecast, by Application 2019 & 2032
- Table 38: Rest of Europe Resorbable Polymers Market Volume (K Tons) Forecast, by Application 2019 & 2032
- Table 39: Global Resorbable Polymers Market Revenue Million Forecast, by Country 2019 & 2032
- Table 40: Global Resorbable Polymers Market Volume K Tons Forecast, by Country 2019 & 2032
- Table 41: China Resorbable Polymers Market Revenue (Million) Forecast, by Application 2019 & 2032
- Table 42: China Resorbable Polymers Market Volume (K Tons) Forecast, by Application 2019 & 2032
- Table 43: Japan Resorbable Polymers Market Revenue (Million) Forecast, by Application 2019 & 2032
- Table 44: Japan Resorbable Polymers Market Volume (K Tons) Forecast, by Application 2019 & 2032
- Table 45: India Resorbable Polymers Market Revenue (Million) Forecast, by Application 2019 & 2032
- Table 46: India Resorbable Polymers Market Volume (K Tons) Forecast, by Application 2019 & 2032
- Table 47: South Korea Resorbable Polymers Market Revenue (Million) Forecast, by Application 2019 & 2032
- Table 48: South Korea Resorbable Polymers Market Volume (K Tons) Forecast, by Application 2019 & 2032
- Table 49: Southeast Asia Resorbable Polymers Market Revenue (Million) Forecast, by Application 2019 & 2032
- Table 50: Southeast Asia Resorbable Polymers Market Volume (K Tons) Forecast, by Application 2019 & 2032
- Table 51: Australia Resorbable Polymers Market Revenue (Million) Forecast, by Application 2019 & 2032
- Table 52: Australia Resorbable Polymers Market Volume (K Tons) Forecast, by Application 2019 & 2032
- Table 53: Indonesia Resorbable Polymers Market Revenue (Million) Forecast, by Application 2019 & 2032
- Table 54: Indonesia Resorbable Polymers Market Volume (K Tons) Forecast, by Application 2019 & 2032
- Table 55: Phillipes Resorbable Polymers Market Revenue (Million) Forecast, by Application 2019 & 2032
- Table 56: Phillipes Resorbable Polymers Market Volume (K Tons) Forecast, by Application 2019 & 2032
- Table 57: Singapore Resorbable Polymers Market Revenue (Million) Forecast, by Application 2019 & 2032
- Table 58: Singapore Resorbable Polymers Market Volume (K Tons) Forecast, by Application 2019 & 2032
- Table 59: Thailandc Resorbable Polymers Market Revenue (Million) Forecast, by Application 2019 & 2032
- Table 60: Thailandc Resorbable Polymers Market Volume (K Tons) Forecast, by Application 2019 & 2032
- Table 61: Rest of Asia Pacific Resorbable Polymers Market Revenue (Million) Forecast, by Application 2019 & 2032
- Table 62: Rest of Asia Pacific Resorbable Polymers Market Volume (K Tons) Forecast, by Application 2019 & 2032
- Table 63: Global Resorbable Polymers Market Revenue Million Forecast, by Country 2019 & 2032
- Table 64: Global Resorbable Polymers Market Volume K Tons Forecast, by Country 2019 & 2032
- Table 65: Brazil Resorbable Polymers Market Revenue (Million) Forecast, by Application 2019 & 2032
- Table 66: Brazil Resorbable Polymers Market Volume (K Tons) Forecast, by Application 2019 & 2032
- Table 67: Argentina Resorbable Polymers Market Revenue (Million) Forecast, by Application 2019 & 2032
- Table 68: Argentina Resorbable Polymers Market Volume (K Tons) Forecast, by Application 2019 & 2032
- Table 69: Peru Resorbable Polymers Market Revenue (Million) Forecast, by Application 2019 & 2032
- Table 70: Peru Resorbable Polymers Market Volume (K Tons) Forecast, by Application 2019 & 2032
- Table 71: Chile Resorbable Polymers Market Revenue (Million) Forecast, by Application 2019 & 2032
- Table 72: Chile Resorbable Polymers Market Volume (K Tons) Forecast, by Application 2019 & 2032
- Table 73: Colombia Resorbable Polymers Market Revenue (Million) Forecast, by Application 2019 & 2032
- Table 74: Colombia Resorbable Polymers Market Volume (K Tons) Forecast, by Application 2019 & 2032
- Table 75: Ecuador Resorbable Polymers Market Revenue (Million) Forecast, by Application 2019 & 2032
- Table 76: Ecuador Resorbable Polymers Market Volume (K Tons) Forecast, by Application 2019 & 2032
- Table 77: Venezuela Resorbable Polymers Market Revenue (Million) Forecast, by Application 2019 & 2032
- Table 78: Venezuela Resorbable Polymers Market Volume (K Tons) Forecast, by Application 2019 & 2032
- Table 79: Rest of South America Resorbable Polymers Market Revenue (Million) Forecast, by Application 2019 & 2032
- Table 80: Rest of South America Resorbable Polymers Market Volume (K Tons) Forecast, by Application 2019 & 2032
- Table 81: Global Resorbable Polymers Market Revenue Million Forecast, by Country 2019 & 2032
- Table 82: Global Resorbable Polymers Market Volume K Tons Forecast, by Country 2019 & 2032
- Table 83: United States Resorbable Polymers Market Revenue (Million) Forecast, by Application 2019 & 2032
- Table 84: United States Resorbable Polymers Market Volume (K Tons) Forecast, by Application 2019 & 2032
- Table 85: Canada Resorbable Polymers Market Revenue (Million) Forecast, by Application 2019 & 2032
- Table 86: Canada Resorbable Polymers Market Volume (K Tons) Forecast, by Application 2019 & 2032
- Table 87: Mexico Resorbable Polymers Market Revenue (Million) Forecast, by Application 2019 & 2032
- Table 88: Mexico Resorbable Polymers Market Volume (K Tons) Forecast, by Application 2019 & 2032
- Table 89: Global Resorbable Polymers Market Revenue Million Forecast, by Country 2019 & 2032
- Table 90: Global Resorbable Polymers Market Volume K Tons Forecast, by Country 2019 & 2032
- Table 91: United Arab Emirates Resorbable Polymers Market Revenue (Million) Forecast, by Application 2019 & 2032
- Table 92: United Arab Emirates Resorbable Polymers Market Volume (K Tons) Forecast, by Application 2019 & 2032
- Table 93: Saudi Arabia Resorbable Polymers Market Revenue (Million) Forecast, by Application 2019 & 2032
- Table 94: Saudi Arabia Resorbable Polymers Market Volume (K Tons) Forecast, by Application 2019 & 2032
- Table 95: South Africa Resorbable Polymers Market Revenue (Million) Forecast, by Application 2019 & 2032
- Table 96: South Africa Resorbable Polymers Market Volume (K Tons) Forecast, by Application 2019 & 2032
- Table 97: Rest of Middle East and Africa Resorbable Polymers Market Revenue (Million) Forecast, by Application 2019 & 2032
- Table 98: Rest of Middle East and Africa Resorbable Polymers Market Volume (K Tons) Forecast, by Application 2019 & 2032
- Table 99: Global Resorbable Polymers Market Revenue Million Forecast, by Material 2019 & 2032
- Table 100: Global Resorbable Polymers Market Volume K Tons Forecast, by Material 2019 & 2032
- Table 101: Global Resorbable Polymers Market Revenue Million Forecast, by Application 2019 & 2032
- Table 102: Global Resorbable Polymers Market Volume K Tons Forecast, by Application 2019 & 2032
- Table 103: Global Resorbable Polymers Market Revenue Million Forecast, by Country 2019 & 2032
- Table 104: Global Resorbable Polymers Market Volume K Tons Forecast, by Country 2019 & 2032
- Table 105: China Resorbable Polymers Market Revenue (Million) Forecast, by Application 2019 & 2032
- Table 106: China Resorbable Polymers Market Volume (K Tons) Forecast, by Application 2019 & 2032
- Table 107: India Resorbable Polymers Market Revenue (Million) Forecast, by Application 2019 & 2032
- Table 108: India Resorbable Polymers Market Volume (K Tons) Forecast, by Application 2019 & 2032
- Table 109: Japan Resorbable Polymers Market Revenue (Million) Forecast, by Application 2019 & 2032
- Table 110: Japan Resorbable Polymers Market Volume (K Tons) Forecast, by Application 2019 & 2032
- Table 111: South Korea Resorbable Polymers Market Revenue (Million) Forecast, by Application 2019 & 2032
- Table 112: South Korea Resorbable Polymers Market Volume (K Tons) Forecast, by Application 2019 & 2032
- Table 113: Rest of Asia Pacific Resorbable Polymers Market Revenue (Million) Forecast, by Application 2019 & 2032
- Table 114: Rest of Asia Pacific Resorbable Polymers Market Volume (K Tons) Forecast, by Application 2019 & 2032
- Table 115: Global Resorbable Polymers Market Revenue Million Forecast, by Material 2019 & 2032
- Table 116: Global Resorbable Polymers Market Volume K Tons Forecast, by Material 2019 & 2032
- Table 117: Global Resorbable Polymers Market Revenue Million Forecast, by Application 2019 & 2032
- Table 118: Global Resorbable Polymers Market Volume K Tons Forecast, by Application 2019 & 2032
- Table 119: Global Resorbable Polymers Market Revenue Million Forecast, by Country 2019 & 2032
- Table 120: Global Resorbable Polymers Market Volume K Tons Forecast, by Country 2019 & 2032
- Table 121: United States Resorbable Polymers Market Revenue (Million) Forecast, by Application 2019 & 2032
- Table 122: United States Resorbable Polymers Market Volume (K Tons) Forecast, by Application 2019 & 2032
- Table 123: Canada Resorbable Polymers Market Revenue (Million) Forecast, by Application 2019 & 2032
- Table 124: Canada Resorbable Polymers Market Volume (K Tons) Forecast, by Application 2019 & 2032
- Table 125: Mexico Resorbable Polymers Market Revenue (Million) Forecast, by Application 2019 & 2032
- Table 126: Mexico Resorbable Polymers Market Volume (K Tons) Forecast, by Application 2019 & 2032
- Table 127: Global Resorbable Polymers Market Revenue Million Forecast, by Material 2019 & 2032
- Table 128: Global Resorbable Polymers Market Volume K Tons Forecast, by Material 2019 & 2032
- Table 129: Global Resorbable Polymers Market Revenue Million Forecast, by Application 2019 & 2032
- Table 130: Global Resorbable Polymers Market Volume K Tons Forecast, by Application 2019 & 2032
- Table 131: Global Resorbable Polymers Market Revenue Million Forecast, by Country 2019 & 2032
- Table 132: Global Resorbable Polymers Market Volume K Tons Forecast, by Country 2019 & 2032
- Table 133: Germany Resorbable Polymers Market Revenue (Million) Forecast, by Application 2019 & 2032
- Table 134: Germany Resorbable Polymers Market Volume (K Tons) Forecast, by Application 2019 & 2032
- Table 135: United Kingdom Resorbable Polymers Market Revenue (Million) Forecast, by Application 2019 & 2032
- Table 136: United Kingdom Resorbable Polymers Market Volume (K Tons) Forecast, by Application 2019 & 2032
- Table 137: Italy Resorbable Polymers Market Revenue (Million) Forecast, by Application 2019 & 2032
- Table 138: Italy Resorbable Polymers Market Volume (K Tons) Forecast, by Application 2019 & 2032
- Table 139: France Resorbable Polymers Market Revenue (Million) Forecast, by Application 2019 & 2032
- Table 140: France Resorbable Polymers Market Volume (K Tons) Forecast, by Application 2019 & 2032
- Table 141: Rest of Europe Resorbable Polymers Market Revenue (Million) Forecast, by Application 2019 & 2032
- Table 142: Rest of Europe Resorbable Polymers Market Volume (K Tons) Forecast, by Application 2019 & 2032
- Table 143: Global Resorbable Polymers Market Revenue Million Forecast, by Material 2019 & 2032
- Table 144: Global Resorbable Polymers Market Volume K Tons Forecast, by Material 2019 & 2032
- Table 145: Global Resorbable Polymers Market Revenue Million Forecast, by Application 2019 & 2032
- Table 146: Global Resorbable Polymers Market Volume K Tons Forecast, by Application 2019 & 2032
- Table 147: Global Resorbable Polymers Market Revenue Million Forecast, by Country 2019 & 2032
- Table 148: Global Resorbable Polymers Market Volume K Tons Forecast, by Country 2019 & 2032
- Table 149: Brazil Resorbable Polymers Market Revenue (Million) Forecast, by Application 2019 & 2032
- Table 150: Brazil Resorbable Polymers Market Volume (K Tons) Forecast, by Application 2019 & 2032
- Table 151: Argentina Resorbable Polymers Market Revenue (Million) Forecast, by Application 2019 & 2032
- Table 152: Argentina Resorbable Polymers Market Volume (K Tons) Forecast, by Application 2019 & 2032
- Table 153: Rest of South America Resorbable Polymers Market Revenue (Million) Forecast, by Application 2019 & 2032
- Table 154: Rest of South America Resorbable Polymers Market Volume (K Tons) Forecast, by Application 2019 & 2032
- Table 155: Global Resorbable Polymers Market Revenue Million Forecast, by Material 2019 & 2032
- Table 156: Global Resorbable Polymers Market Volume K Tons Forecast, by Material 2019 & 2032
- Table 157: Global Resorbable Polymers Market Revenue Million Forecast, by Application 2019 & 2032
- Table 158: Global Resorbable Polymers Market Volume K Tons Forecast, by Application 2019 & 2032
- Table 159: Global Resorbable Polymers Market Revenue Million Forecast, by Country 2019 & 2032
- Table 160: Global Resorbable Polymers Market Volume K Tons Forecast, by Country 2019 & 2032
- Table 161: UAE Resorbable Polymers Market Revenue (Million) Forecast, by Application 2019 & 2032
- Table 162: UAE Resorbable Polymers Market Volume (K Tons) Forecast, by Application 2019 & 2032
- Table 163: Saudi Arabia Resorbable Polymers Market Revenue (Million) Forecast, by Application 2019 & 2032
- Table 164: Saudi Arabia Resorbable Polymers Market Volume (K Tons) Forecast, by Application 2019 & 2032
- Table 165: South Africa Resorbable Polymers Market Revenue (Million) Forecast, by Application 2019 & 2032
- Table 166: South Africa Resorbable Polymers Market Volume (K Tons) Forecast, by Application 2019 & 2032
- Table 167: Rest of Middle East & Africa Resorbable Polymers Market Revenue (Million) Forecast, by Application 2019 & 2032
- Table 168: Rest of Middle East & Africa Resorbable Polymers Market Volume (K Tons) Forecast, by Application 2019 & 2032
Frequently Asked Questions
1. What is the projected Compound Annual Growth Rate (CAGR) of the Resorbable Polymers Market?
The projected CAGR is approximately > 10.00%.
2. Which companies are prominent players in the Resorbable Polymers Market?
Key companies in the market include KLS Martin Group, Teknimed, Poly-Med Incorporated, Evonik Industries AG, Ashland, Biogeneral, Foster Corporation, CORBION.
3. What are the main segments of the Resorbable Polymers Market?
The market segments include Material, Application.
4. Can you provide details about the market size?
The market size is estimated to be USD XX Million as of 2022.
5. What are some drivers contributing to market growth?
Growing Demand from Medical Industry; Other Drivers.
6. What are the notable trends driving market growth?
Orthopedics to Dominate the Market.
7. Are there any restraints impacting market growth?
Other Restraints.
8. Can you provide examples of recent developments in the market?
In Jan 2021, Evonik announced the closing of the LACTEL Absorbable Polymers acquisition from DURECT Corporation.
9. What pricing options are available for accessing the report?
Pricing options include single-user, multi-user, and enterprise licenses priced at USD 4750, USD 5250, and USD 8750 respectively.
10. Is the market size provided in terms of value or volume?
The market size is provided in terms of value, measured in Million and volume, measured in K Tons.
11. Are there any specific market keywords associated with the report?
Yes, the market keyword associated with the report is "Resorbable Polymers Market," which aids in identifying and referencing the specific market segment covered.
12. How do I determine which pricing option suits my needs best?
The pricing options vary based on user requirements and access needs. Individual users may opt for single-user licenses, while businesses requiring broader access may choose multi-user or enterprise licenses for cost-effective access to the report.
13. Are there any additional resources or data provided in the Resorbable Polymers Market report?
While the report offers comprehensive insights, it's advisable to review the specific contents or supplementary materials provided to ascertain if additional resources or data are available.
14. How can I stay updated on further developments or reports in the Resorbable Polymers Market?
To stay informed about further developments, trends, and reports in the Resorbable Polymers Market, consider subscribing to industry newsletters, following relevant companies and organizations, or regularly checking reputable industry news sources and publications.
Methodology
Step 1 - Identification of Relevant Samples Size from Population Database


Step 2 - Approaches for Defining Global Market Size (Value, Volume* & Price*)

Note*: In applicable scenarios
Step 3 - Data Sources
Primary Research
- Web Analytics
- Survey Reports
- Research Institute
- Latest Research Reports
- Opinion Leaders
Secondary Research
- Annual Reports
- White Paper
- Latest Press Release
- Industry Association
- Paid Database
- Investor Presentations

Step 4 - Data Triangulation
Involves using different sources of information in order to increase the validity of a study
These sources are likely to be stakeholders in a program - participants, other researchers, program staff, other community members, and so on.
Then we put all data in single framework & apply various statistical tools to find out the dynamic on the market.
During the analysis stage, feedback from the stakeholder groups would be compared to determine areas of agreement as well as areas of divergence


