
Key Insights
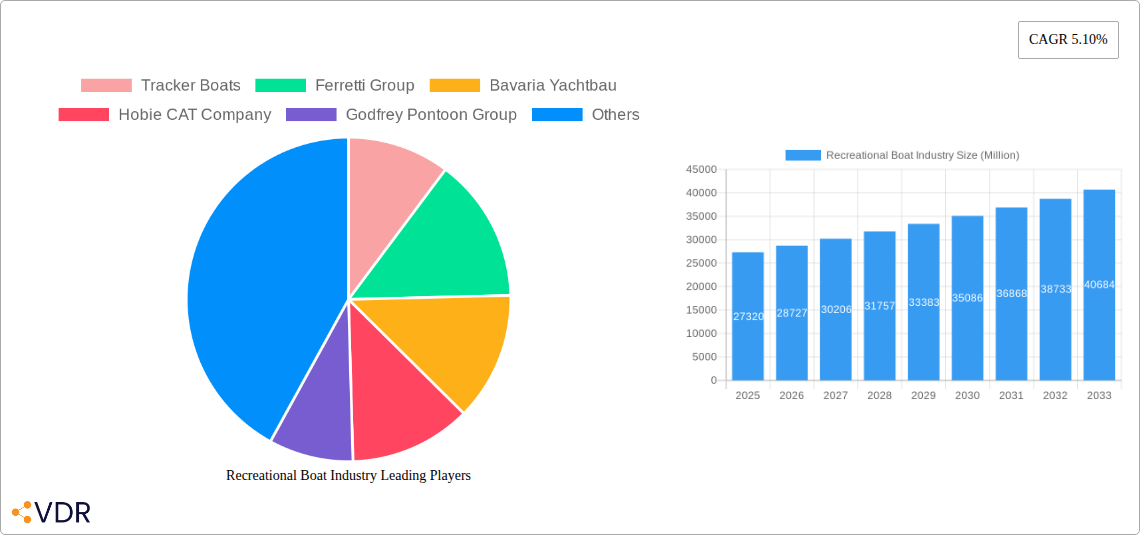
The global recreational boat industry, valued at $27.32 billion in 2025, is projected to experience robust growth, driven by several key factors. Rising disposable incomes in developing economies, coupled with a growing interest in water-based leisure activities, are fueling demand for various boat types, including inboard boats, outboard boats, and personal watercraft. Technological advancements, such as the integration of electric power sources and improved navigation systems, are enhancing the overall boating experience and attracting a wider range of consumers. The industry is segmented by application (watersports and fishing), power source (internal combustion engine and electric power), and boat type, offering diverse options catering to specific needs and preferences. While supply chain disruptions and fluctuating raw material prices pose challenges, the industry's overall growth trajectory remains positive, supported by increasing eco-tourism and the popularity of boating as a family-oriented activity. Key players like Brunswick Corporation, Groupe Beneteau, and Tracker Boats are strategically investing in research and development, expanding their product lines, and exploring new markets to capitalize on this growth opportunity. The North American market currently holds a significant share, due to established boating culture and high consumer spending, but the Asia-Pacific region is poised for substantial growth in the coming years, driven by increasing urbanization and rising middle-class populations.
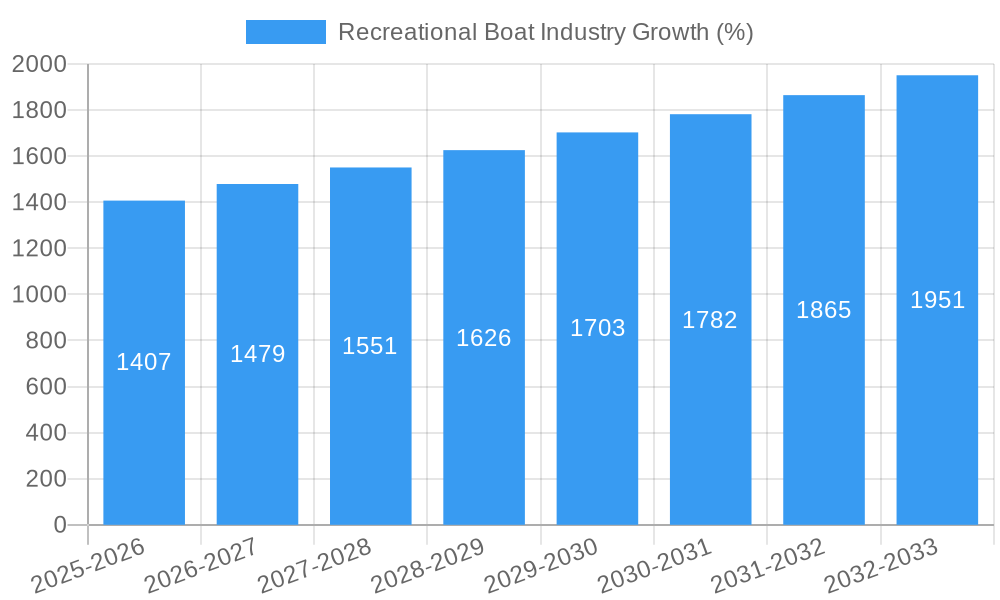
The forecast period of 2025-2033 anticipates continued expansion, with a Compound Annual Growth Rate (CAGR) of 5.10%. This growth will be influenced by the successful introduction of new boat models featuring advanced features and improved fuel efficiency. Furthermore, the industry’s focus on sustainability, including the development of environmentally friendly boating technologies and responsible boating practices, will likely attract environmentally conscious consumers. Market segmentation strategies will continue to be crucial for manufacturers seeking to address the diverse preferences of various consumer demographics. Competitive pressures will necessitate innovation in design, materials, and technology to remain ahead in this dynamic market. Geographic expansion into emerging markets will also be a key strategy for companies aiming to broaden their customer base and secure future growth. Regulatory changes concerning emission standards and safety regulations will require companies to adapt and invest in compliant technologies, ensuring long-term sustainability in the industry.
Recreational Boat Industry Market Report: 2019-2033
This comprehensive report provides a detailed analysis of the recreational boat industry, encompassing market dynamics, growth trends, key players, and future outlook. The study period covers 2019-2033, with a base year of 2025 and a forecast period of 2025-2033. This report is essential for industry professionals, investors, and anyone seeking to understand this dynamic market. We examine parent markets (recreational vehicles) and child markets (watersports equipment, fishing gear) to provide a holistic view.
Recreational Boat Industry Market Dynamics & Structure
The recreational boat industry is characterized by a moderately concentrated market structure, with several major players holding significant market share. Market concentration is estimated at xx%, with the top five players accounting for approximately xx million units. Technological innovation, particularly in electric propulsion and advanced materials, is a key driver of growth. Stringent regulatory frameworks regarding emissions and safety standards significantly impact operations. Competitive substitutes, such as alternative leisure activities, pose a challenge. End-user demographics are shifting towards younger, tech-savvy consumers, demanding more efficient and environmentally friendly boats. M&A activity is relatively frequent, with xx deals recorded between 2019 and 2024, predominantly focused on consolidating market share and accessing new technologies.
- Market Concentration: xx% (Top 5 players: xx million units)
- Technological Innovation: Electric propulsion, advanced materials (carbon fiber, etc.)
- Regulatory Landscape: Emission standards, safety regulations
- Competitive Substitutes: Alternative leisure activities (e.g., camping, hiking)
- End-User Demographics: Younger, tech-savvy consumers
- M&A Activity: xx deals (2019-2024)
Recreational Boat Industry Growth Trends & Insights
The recreational boat industry experienced a CAGR of xx% during the historical period (2019-2024). Market size is projected to reach xx million units by 2025 and xx million units by 2033, driven by rising disposable incomes, increasing leisure time, and a growing preference for outdoor recreational activities. Technological disruptions, such as the increasing adoption of electric power and autonomous features, are reshaping the market. Consumer behavior is shifting towards personalized experiences and eco-conscious choices, demanding sustainable and technologically advanced boats. Market penetration of electric boats is expected to reach xx% by 2033. The adoption of advanced materials is also contributing to higher performance and fuel efficiency.
Dominant Regions, Countries, or Segments in Recreational Boat Industry
North America currently holds the largest market share (xx%) in the recreational boat industry, followed by Europe (xx%) and Asia-Pacific (xx%). Within the segmentation, the fishing segment dominates by application, representing xx% of the total market. IC Engine-powered boats constitute the majority (xx%) of the market share by power source. Outboard boats are the most popular boat type, holding the largest market share (xx%).
- Key Regional Drivers:
- North America: Strong disposable incomes, well-established boating culture
- Europe: Growing tourism industry, investments in marinas and infrastructure
- Asia-Pacific: Rising middle class, increased demand for luxury boats
- Segmental Drivers:
- Fishing (Application): Growing popularity of fishing as a recreational activity
- IC Engine (Power Source): Established technology, wide availability, and performance advantages.
- Outboard Boats (Boat Type): Versatility, affordability, and ease of maintenance
Recreational Boat Industry Product Landscape
The recreational boat market offers a diverse range of products, from small personal watercraft to large luxury yachts. Recent innovations include advanced hull designs for improved fuel efficiency, electric propulsion systems for reduced environmental impact, and integrated smart technology for enhanced navigation and safety. Unique selling propositions encompass high-performance engines, luxurious interiors, and advanced safety features. Technological advancements continue to focus on increasing fuel efficiency, reducing noise pollution, and improving overall boat performance.
Key Drivers, Barriers & Challenges in Recreational Boat Industry
Key Drivers:
- Rising disposable incomes and increased leisure time.
- Growing demand for outdoor recreation and water sports.
- Technological advancements in boat design and propulsion systems.
- Government initiatives promoting sustainable tourism and recreational activities.
Key Challenges:
- High manufacturing costs and fluctuating raw material prices (impacting xx% of production costs).
- Stringent environmental regulations impacting the production and usage of IC Engine boats.
- Intense competition from established and emerging players.
- Supply chain disruptions impacting production cycles and delivery timelines.
Emerging Opportunities in Recreational Boat Industry
- Growth in the electric boat segment driven by environmental concerns.
- Increased demand for personalized and customized boats.
- Expansion into emerging markets with growing middle classes.
- Development of innovative boat designs for specific niche applications.
Growth Accelerators in the Recreational Boat Industry
Long-term growth will be propelled by technological advancements in electric propulsion and autonomous navigation systems, coupled with strategic partnerships to expand market reach and access new technologies. Sustainable materials, such as recycled plastics and bio-based composites, offer significant opportunities. Expansion into untapped markets in developing economies will also contribute to long-term growth.
Key Players Shaping the Recreational Boat Industry Market
- Tracker Boats
- Ferretti Group
- Bavaria Yachtbau
- Hobie CAT Company
- Godfrey Pontoon Group
- Sportsman Boats Manufacturing Inc
- Brunswick Corporation
- Bennington Marine LLC
- Catalina Yachts
- Marine Product Corporation
- Azimut Benetti Group
- Mahindra Odyssea
- Ranger Boats
- Groupe Beneteau
- Sunseeker International Limited
Notable Milestones in Recreational Boat Industry Sector
- July 2022: Vision Marine Technologies and Groupe Beneteau partnered to integrate electric outboard motors.
- July 2022: Mercury Marine (Brunswick Corporation) collaborated with Alliant Energy on a solar array project.
- July 2022: Benetti launched the 37-meter Benetti B.Yond (Goga) yacht.
In-Depth Recreational Boat Industry Market Outlook
The future of the recreational boat industry is bright, driven by innovation and evolving consumer preferences. Strategic partnerships, investments in sustainable technologies, and expansion into new markets will shape the industry's trajectory. The increasing adoption of electric boats and autonomous features will redefine the boating experience, attracting a wider range of consumers. The market's overall growth potential remains robust, offering significant opportunities for existing and emerging players.
Recreational Boat Industry Segmentation
-
1. Boat Type
- 1.1. Inboard Boats
- 1.2. Outboard Boats
- 1.3. Personal Watercraft Boats
- 1.4. Other Boat Types
-
2. Application
- 2.1. Watersports
- 2.2. Fishing
-
3. Power Source
- 3.1. IC Engine
- 3.2. Electric Power
Recreational Boat Industry Segmentation By Geography
-
1. North America
- 1.1. United States
- 1.2. Canada
- 1.3. Rest of North America
-
2. Europe
- 2.1. Germany
- 2.2. United Kingdom
- 2.3. France
- 2.4. Rest of Europe
-
3. Asia Pacific
- 3.1. China
- 3.2. Japan
- 3.3. India
- 3.4. South Korea
- 3.5. Rest of Asia Pacific
-
4. Rest of the World
- 4.1. South America
- 4.2. Middle East and Africa

Recreational Boat Industry REPORT HIGHLIGHTS
| Aspects | Details |
|---|---|
| Study Period | 2019-2033 |
| Base Year | 2024 |
| Estimated Year | 2025 |
| Forecast Period | 2025-2033 |
| Historical Period | 2019-2024 |
| Growth Rate | CAGR of 5.10% from 2019-2033 |
| Segmentation |
|
Table of Contents
- 1. Introduction
- 1.1. Research Scope
- 1.2. Market Segmentation
- 1.3. Research Methodology
- 1.4. Definitions and Assumptions
- 2. Executive Summary
- 2.1. Introduction
- 3. Market Dynamics
- 3.1. Introduction
- 3.2. Market Drivers
- 3.2.1. Increasing Demand For Electric School Buses
- 3.3. Market Restrains
- 3.3.1. Uncertainty of The Global Pandemic
- 3.4. Market Trends
- 3.4.1. Increasing Watersports and Recreational Activities
- 4. Market Factor Analysis
- 4.1. Porters Five Forces
- 4.2. Supply/Value Chain
- 4.3. PESTEL analysis
- 4.4. Market Entropy
- 4.5. Patent/Trademark Analysis
- 5. Global Recreational Boat Industry Analysis, Insights and Forecast, 2019-2031
- 5.1. Market Analysis, Insights and Forecast - by Boat Type
- 5.1.1. Inboard Boats
- 5.1.2. Outboard Boats
- 5.1.3. Personal Watercraft Boats
- 5.1.4. Other Boat Types
- 5.2. Market Analysis, Insights and Forecast - by Application
- 5.2.1. Watersports
- 5.2.2. Fishing
- 5.3. Market Analysis, Insights and Forecast - by Power Source
- 5.3.1. IC Engine
- 5.3.2. Electric Power
- 5.4. Market Analysis, Insights and Forecast - by Region
- 5.4.1. North America
- 5.4.2. Europe
- 5.4.3. Asia Pacific
- 5.4.4. Rest of the World
- 5.1. Market Analysis, Insights and Forecast - by Boat Type
- 6. North America Recreational Boat Industry Analysis, Insights and Forecast, 2019-2031
- 6.1. Market Analysis, Insights and Forecast - by Boat Type
- 6.1.1. Inboard Boats
- 6.1.2. Outboard Boats
- 6.1.3. Personal Watercraft Boats
- 6.1.4. Other Boat Types
- 6.2. Market Analysis, Insights and Forecast - by Application
- 6.2.1. Watersports
- 6.2.2. Fishing
- 6.3. Market Analysis, Insights and Forecast - by Power Source
- 6.3.1. IC Engine
- 6.3.2. Electric Power
- 6.1. Market Analysis, Insights and Forecast - by Boat Type
- 7. Europe Recreational Boat Industry Analysis, Insights and Forecast, 2019-2031
- 7.1. Market Analysis, Insights and Forecast - by Boat Type
- 7.1.1. Inboard Boats
- 7.1.2. Outboard Boats
- 7.1.3. Personal Watercraft Boats
- 7.1.4. Other Boat Types
- 7.2. Market Analysis, Insights and Forecast - by Application
- 7.2.1. Watersports
- 7.2.2. Fishing
- 7.3. Market Analysis, Insights and Forecast - by Power Source
- 7.3.1. IC Engine
- 7.3.2. Electric Power
- 7.1. Market Analysis, Insights and Forecast - by Boat Type
- 8. Asia Pacific Recreational Boat Industry Analysis, Insights and Forecast, 2019-2031
- 8.1. Market Analysis, Insights and Forecast - by Boat Type
- 8.1.1. Inboard Boats
- 8.1.2. Outboard Boats
- 8.1.3. Personal Watercraft Boats
- 8.1.4. Other Boat Types
- 8.2. Market Analysis, Insights and Forecast - by Application
- 8.2.1. Watersports
- 8.2.2. Fishing
- 8.3. Market Analysis, Insights and Forecast - by Power Source
- 8.3.1. IC Engine
- 8.3.2. Electric Power
- 8.1. Market Analysis, Insights and Forecast - by Boat Type
- 9. Rest of the World Recreational Boat Industry Analysis, Insights and Forecast, 2019-2031
- 9.1. Market Analysis, Insights and Forecast - by Boat Type
- 9.1.1. Inboard Boats
- 9.1.2. Outboard Boats
- 9.1.3. Personal Watercraft Boats
- 9.1.4. Other Boat Types
- 9.2. Market Analysis, Insights and Forecast - by Application
- 9.2.1. Watersports
- 9.2.2. Fishing
- 9.3. Market Analysis, Insights and Forecast - by Power Source
- 9.3.1. IC Engine
- 9.3.2. Electric Power
- 9.1. Market Analysis, Insights and Forecast - by Boat Type
- 10. North America Recreational Boat Industry Analysis, Insights and Forecast, 2019-2031
- 10.1. Market Analysis, Insights and Forecast - By Country/Sub-region
- 10.1.1 United States
- 10.1.2 Canada
- 10.1.3 Rest of North America
- 11. Europe Recreational Boat Industry Analysis, Insights and Forecast, 2019-2031
- 11.1. Market Analysis, Insights and Forecast - By Country/Sub-region
- 11.1.1 Germany
- 11.1.2 United Kingdom
- 11.1.3 France
- 11.1.4 Rest of Europe
- 12. Asia Pacific Recreational Boat Industry Analysis, Insights and Forecast, 2019-2031
- 12.1. Market Analysis, Insights and Forecast - By Country/Sub-region
- 12.1.1 China
- 12.1.2 Japan
- 12.1.3 India
- 12.1.4 South Korea
- 12.1.5 Rest of Asia Pacific
- 13. Rest of the World Recreational Boat Industry Analysis, Insights and Forecast, 2019-2031
- 13.1. Market Analysis, Insights and Forecast - By Country/Sub-region
- 13.1.1 South America
- 13.1.2 Middle East and Africa
- 14. Competitive Analysis
- 14.1. Global Market Share Analysis 2024
- 14.2. Company Profiles
- 14.2.1 Tracker Boats
- 14.2.1.1. Overview
- 14.2.1.2. Products
- 14.2.1.3. SWOT Analysis
- 14.2.1.4. Recent Developments
- 14.2.1.5. Financials (Based on Availability)
- 14.2.2 Ferretti Group
- 14.2.2.1. Overview
- 14.2.2.2. Products
- 14.2.2.3. SWOT Analysis
- 14.2.2.4. Recent Developments
- 14.2.2.5. Financials (Based on Availability)
- 14.2.3 Bavaria Yachtbau
- 14.2.3.1. Overview
- 14.2.3.2. Products
- 14.2.3.3. SWOT Analysis
- 14.2.3.4. Recent Developments
- 14.2.3.5. Financials (Based on Availability)
- 14.2.4 Hobie CAT Company
- 14.2.4.1. Overview
- 14.2.4.2. Products
- 14.2.4.3. SWOT Analysis
- 14.2.4.4. Recent Developments
- 14.2.4.5. Financials (Based on Availability)
- 14.2.5 Godfrey Pontoon Group
- 14.2.5.1. Overview
- 14.2.5.2. Products
- 14.2.5.3. SWOT Analysis
- 14.2.5.4. Recent Developments
- 14.2.5.5. Financials (Based on Availability)
- 14.2.6 Sportsman Boats Manufacturing Inc
- 14.2.6.1. Overview
- 14.2.6.2. Products
- 14.2.6.3. SWOT Analysis
- 14.2.6.4. Recent Developments
- 14.2.6.5. Financials (Based on Availability)
- 14.2.7 Brunswick Corporation
- 14.2.7.1. Overview
- 14.2.7.2. Products
- 14.2.7.3. SWOT Analysis
- 14.2.7.4. Recent Developments
- 14.2.7.5. Financials (Based on Availability)
- 14.2.8 Bennington Marine LLC
- 14.2.8.1. Overview
- 14.2.8.2. Products
- 14.2.8.3. SWOT Analysis
- 14.2.8.4. Recent Developments
- 14.2.8.5. Financials (Based on Availability)
- 14.2.9 Catalina Yachts
- 14.2.9.1. Overview
- 14.2.9.2. Products
- 14.2.9.3. SWOT Analysis
- 14.2.9.4. Recent Developments
- 14.2.9.5. Financials (Based on Availability)
- 14.2.10 Marine Product Corporation
- 14.2.10.1. Overview
- 14.2.10.2. Products
- 14.2.10.3. SWOT Analysis
- 14.2.10.4. Recent Developments
- 14.2.10.5. Financials (Based on Availability)
- 14.2.11 Azimut Benetti Group
- 14.2.11.1. Overview
- 14.2.11.2. Products
- 14.2.11.3. SWOT Analysis
- 14.2.11.4. Recent Developments
- 14.2.11.5. Financials (Based on Availability)
- 14.2.12 Mahindra Odyssea
- 14.2.12.1. Overview
- 14.2.12.2. Products
- 14.2.12.3. SWOT Analysis
- 14.2.12.4. Recent Developments
- 14.2.12.5. Financials (Based on Availability)
- 14.2.13 Ranger Boats
- 14.2.13.1. Overview
- 14.2.13.2. Products
- 14.2.13.3. SWOT Analysis
- 14.2.13.4. Recent Developments
- 14.2.13.5. Financials (Based on Availability)
- 14.2.14 Groupe Beneteau
- 14.2.14.1. Overview
- 14.2.14.2. Products
- 14.2.14.3. SWOT Analysis
- 14.2.14.4. Recent Developments
- 14.2.14.5. Financials (Based on Availability)
- 14.2.15 Sunseeker International Limited
- 14.2.15.1. Overview
- 14.2.15.2. Products
- 14.2.15.3. SWOT Analysis
- 14.2.15.4. Recent Developments
- 14.2.15.5. Financials (Based on Availability)
- 14.2.1 Tracker Boats
List of Figures
- Figure 1: Global Recreational Boat Industry Revenue Breakdown (Million, %) by Region 2024 & 2032
- Figure 2: North America Recreational Boat Industry Revenue (Million), by Country 2024 & 2032
- Figure 3: North America Recreational Boat Industry Revenue Share (%), by Country 2024 & 2032
- Figure 4: Europe Recreational Boat Industry Revenue (Million), by Country 2024 & 2032
- Figure 5: Europe Recreational Boat Industry Revenue Share (%), by Country 2024 & 2032
- Figure 6: Asia Pacific Recreational Boat Industry Revenue (Million), by Country 2024 & 2032
- Figure 7: Asia Pacific Recreational Boat Industry Revenue Share (%), by Country 2024 & 2032
- Figure 8: Rest of the World Recreational Boat Industry Revenue (Million), by Country 2024 & 2032
- Figure 9: Rest of the World Recreational Boat Industry Revenue Share (%), by Country 2024 & 2032
- Figure 10: North America Recreational Boat Industry Revenue (Million), by Boat Type 2024 & 2032
- Figure 11: North America Recreational Boat Industry Revenue Share (%), by Boat Type 2024 & 2032
- Figure 12: North America Recreational Boat Industry Revenue (Million), by Application 2024 & 2032
- Figure 13: North America Recreational Boat Industry Revenue Share (%), by Application 2024 & 2032
- Figure 14: North America Recreational Boat Industry Revenue (Million), by Power Source 2024 & 2032
- Figure 15: North America Recreational Boat Industry Revenue Share (%), by Power Source 2024 & 2032
- Figure 16: North America Recreational Boat Industry Revenue (Million), by Country 2024 & 2032
- Figure 17: North America Recreational Boat Industry Revenue Share (%), by Country 2024 & 2032
- Figure 18: Europe Recreational Boat Industry Revenue (Million), by Boat Type 2024 & 2032
- Figure 19: Europe Recreational Boat Industry Revenue Share (%), by Boat Type 2024 & 2032
- Figure 20: Europe Recreational Boat Industry Revenue (Million), by Application 2024 & 2032
- Figure 21: Europe Recreational Boat Industry Revenue Share (%), by Application 2024 & 2032
- Figure 22: Europe Recreational Boat Industry Revenue (Million), by Power Source 2024 & 2032
- Figure 23: Europe Recreational Boat Industry Revenue Share (%), by Power Source 2024 & 2032
- Figure 24: Europe Recreational Boat Industry Revenue (Million), by Country 2024 & 2032
- Figure 25: Europe Recreational Boat Industry Revenue Share (%), by Country 2024 & 2032
- Figure 26: Asia Pacific Recreational Boat Industry Revenue (Million), by Boat Type 2024 & 2032
- Figure 27: Asia Pacific Recreational Boat Industry Revenue Share (%), by Boat Type 2024 & 2032
- Figure 28: Asia Pacific Recreational Boat Industry Revenue (Million), by Application 2024 & 2032
- Figure 29: Asia Pacific Recreational Boat Industry Revenue Share (%), by Application 2024 & 2032
- Figure 30: Asia Pacific Recreational Boat Industry Revenue (Million), by Power Source 2024 & 2032
- Figure 31: Asia Pacific Recreational Boat Industry Revenue Share (%), by Power Source 2024 & 2032
- Figure 32: Asia Pacific Recreational Boat Industry Revenue (Million), by Country 2024 & 2032
- Figure 33: Asia Pacific Recreational Boat Industry Revenue Share (%), by Country 2024 & 2032
- Figure 34: Rest of the World Recreational Boat Industry Revenue (Million), by Boat Type 2024 & 2032
- Figure 35: Rest of the World Recreational Boat Industry Revenue Share (%), by Boat Type 2024 & 2032
- Figure 36: Rest of the World Recreational Boat Industry Revenue (Million), by Application 2024 & 2032
- Figure 37: Rest of the World Recreational Boat Industry Revenue Share (%), by Application 2024 & 2032
- Figure 38: Rest of the World Recreational Boat Industry Revenue (Million), by Power Source 2024 & 2032
- Figure 39: Rest of the World Recreational Boat Industry Revenue Share (%), by Power Source 2024 & 2032
- Figure 40: Rest of the World Recreational Boat Industry Revenue (Million), by Country 2024 & 2032
- Figure 41: Rest of the World Recreational Boat Industry Revenue Share (%), by Country 2024 & 2032
List of Tables
- Table 1: Global Recreational Boat Industry Revenue Million Forecast, by Region 2019 & 2032
- Table 2: Global Recreational Boat Industry Revenue Million Forecast, by Boat Type 2019 & 2032
- Table 3: Global Recreational Boat Industry Revenue Million Forecast, by Application 2019 & 2032
- Table 4: Global Recreational Boat Industry Revenue Million Forecast, by Power Source 2019 & 2032
- Table 5: Global Recreational Boat Industry Revenue Million Forecast, by Region 2019 & 2032
- Table 6: Global Recreational Boat Industry Revenue Million Forecast, by Country 2019 & 2032
- Table 7: United States Recreational Boat Industry Revenue (Million) Forecast, by Application 2019 & 2032
- Table 8: Canada Recreational Boat Industry Revenue (Million) Forecast, by Application 2019 & 2032
- Table 9: Rest of North America Recreational Boat Industry Revenue (Million) Forecast, by Application 2019 & 2032
- Table 10: Global Recreational Boat Industry Revenue Million Forecast, by Country 2019 & 2032
- Table 11: Germany Recreational Boat Industry Revenue (Million) Forecast, by Application 2019 & 2032
- Table 12: United Kingdom Recreational Boat Industry Revenue (Million) Forecast, by Application 2019 & 2032
- Table 13: France Recreational Boat Industry Revenue (Million) Forecast, by Application 2019 & 2032
- Table 14: Rest of Europe Recreational Boat Industry Revenue (Million) Forecast, by Application 2019 & 2032
- Table 15: Global Recreational Boat Industry Revenue Million Forecast, by Country 2019 & 2032
- Table 16: China Recreational Boat Industry Revenue (Million) Forecast, by Application 2019 & 2032
- Table 17: Japan Recreational Boat Industry Revenue (Million) Forecast, by Application 2019 & 2032
- Table 18: India Recreational Boat Industry Revenue (Million) Forecast, by Application 2019 & 2032
- Table 19: South Korea Recreational Boat Industry Revenue (Million) Forecast, by Application 2019 & 2032
- Table 20: Rest of Asia Pacific Recreational Boat Industry Revenue (Million) Forecast, by Application 2019 & 2032
- Table 21: Global Recreational Boat Industry Revenue Million Forecast, by Country 2019 & 2032
- Table 22: South America Recreational Boat Industry Revenue (Million) Forecast, by Application 2019 & 2032
- Table 23: Middle East and Africa Recreational Boat Industry Revenue (Million) Forecast, by Application 2019 & 2032
- Table 24: Global Recreational Boat Industry Revenue Million Forecast, by Boat Type 2019 & 2032
- Table 25: Global Recreational Boat Industry Revenue Million Forecast, by Application 2019 & 2032
- Table 26: Global Recreational Boat Industry Revenue Million Forecast, by Power Source 2019 & 2032
- Table 27: Global Recreational Boat Industry Revenue Million Forecast, by Country 2019 & 2032
- Table 28: United States Recreational Boat Industry Revenue (Million) Forecast, by Application 2019 & 2032
- Table 29: Canada Recreational Boat Industry Revenue (Million) Forecast, by Application 2019 & 2032
- Table 30: Rest of North America Recreational Boat Industry Revenue (Million) Forecast, by Application 2019 & 2032
- Table 31: Global Recreational Boat Industry Revenue Million Forecast, by Boat Type 2019 & 2032
- Table 32: Global Recreational Boat Industry Revenue Million Forecast, by Application 2019 & 2032
- Table 33: Global Recreational Boat Industry Revenue Million Forecast, by Power Source 2019 & 2032
- Table 34: Global Recreational Boat Industry Revenue Million Forecast, by Country 2019 & 2032
- Table 35: Germany Recreational Boat Industry Revenue (Million) Forecast, by Application 2019 & 2032
- Table 36: United Kingdom Recreational Boat Industry Revenue (Million) Forecast, by Application 2019 & 2032
- Table 37: France Recreational Boat Industry Revenue (Million) Forecast, by Application 2019 & 2032
- Table 38: Rest of Europe Recreational Boat Industry Revenue (Million) Forecast, by Application 2019 & 2032
- Table 39: Global Recreational Boat Industry Revenue Million Forecast, by Boat Type 2019 & 2032
- Table 40: Global Recreational Boat Industry Revenue Million Forecast, by Application 2019 & 2032
- Table 41: Global Recreational Boat Industry Revenue Million Forecast, by Power Source 2019 & 2032
- Table 42: Global Recreational Boat Industry Revenue Million Forecast, by Country 2019 & 2032
- Table 43: China Recreational Boat Industry Revenue (Million) Forecast, by Application 2019 & 2032
- Table 44: Japan Recreational Boat Industry Revenue (Million) Forecast, by Application 2019 & 2032
- Table 45: India Recreational Boat Industry Revenue (Million) Forecast, by Application 2019 & 2032
- Table 46: South Korea Recreational Boat Industry Revenue (Million) Forecast, by Application 2019 & 2032
- Table 47: Rest of Asia Pacific Recreational Boat Industry Revenue (Million) Forecast, by Application 2019 & 2032
- Table 48: Global Recreational Boat Industry Revenue Million Forecast, by Boat Type 2019 & 2032
- Table 49: Global Recreational Boat Industry Revenue Million Forecast, by Application 2019 & 2032
- Table 50: Global Recreational Boat Industry Revenue Million Forecast, by Power Source 2019 & 2032
- Table 51: Global Recreational Boat Industry Revenue Million Forecast, by Country 2019 & 2032
- Table 52: South America Recreational Boat Industry Revenue (Million) Forecast, by Application 2019 & 2032
- Table 53: Middle East and Africa Recreational Boat Industry Revenue (Million) Forecast, by Application 2019 & 2032
Frequently Asked Questions
1. What is the projected Compound Annual Growth Rate (CAGR) of the Recreational Boat Industry?
The projected CAGR is approximately 5.10%.
2. Which companies are prominent players in the Recreational Boat Industry?
Key companies in the market include Tracker Boats, Ferretti Group, Bavaria Yachtbau, Hobie CAT Company, Godfrey Pontoon Group, Sportsman Boats Manufacturing Inc, Brunswick Corporation, Bennington Marine LLC, Catalina Yachts, Marine Product Corporation, Azimut Benetti Group, Mahindra Odyssea, Ranger Boats, Groupe Beneteau, Sunseeker International Limited.
3. What are the main segments of the Recreational Boat Industry?
The market segments include Boat Type, Application, Power Source.
4. Can you provide details about the market size?
The market size is estimated to be USD 27.32 Million as of 2022.
5. What are some drivers contributing to market growth?
Increasing Demand For Electric School Buses.
6. What are the notable trends driving market growth?
Increasing Watersports and Recreational Activities.
7. Are there any restraints impacting market growth?
Uncertainty of The Global Pandemic.
8. Can you provide examples of recent developments in the market?
In July 2022, Vision Marine Technologies and Groupe Beneteau formed a partnership to integrate Vision Marine Technologies' high-power electric outboard motors onboard several models across Groupe Beneteau's brand portfolio.
9. What pricing options are available for accessing the report?
Pricing options include single-user, multi-user, and enterprise licenses priced at USD 4750, USD 5250, and USD 8750 respectively.
10. Is the market size provided in terms of value or volume?
The market size is provided in terms of value, measured in Million.
11. Are there any specific market keywords associated with the report?
Yes, the market keyword associated with the report is "Recreational Boat Industry," which aids in identifying and referencing the specific market segment covered.
12. How do I determine which pricing option suits my needs best?
The pricing options vary based on user requirements and access needs. Individual users may opt for single-user licenses, while businesses requiring broader access may choose multi-user or enterprise licenses for cost-effective access to the report.
13. Are there any additional resources or data provided in the Recreational Boat Industry report?
While the report offers comprehensive insights, it's advisable to review the specific contents or supplementary materials provided to ascertain if additional resources or data are available.
14. How can I stay updated on further developments or reports in the Recreational Boat Industry?
To stay informed about further developments, trends, and reports in the Recreational Boat Industry, consider subscribing to industry newsletters, following relevant companies and organizations, or regularly checking reputable industry news sources and publications.
Methodology
Step 1 - Identification of Relevant Samples Size from Population Database


Step 2 - Approaches for Defining Global Market Size (Value, Volume* & Price*)

Note*: In applicable scenarios
Step 3 - Data Sources
Primary Research
- Web Analytics
- Survey Reports
- Research Institute
- Latest Research Reports
- Opinion Leaders
Secondary Research
- Annual Reports
- White Paper
- Latest Press Release
- Industry Association
- Paid Database
- Investor Presentations

Step 4 - Data Triangulation
Involves using different sources of information in order to increase the validity of a study
These sources are likely to be stakeholders in a program - participants, other researchers, program staff, other community members, and so on.
Then we put all data in single framework & apply various statistical tools to find out the dynamic on the market.
During the analysis stage, feedback from the stakeholder groups would be compared to determine areas of agreement as well as areas of divergence


