
Key Insights
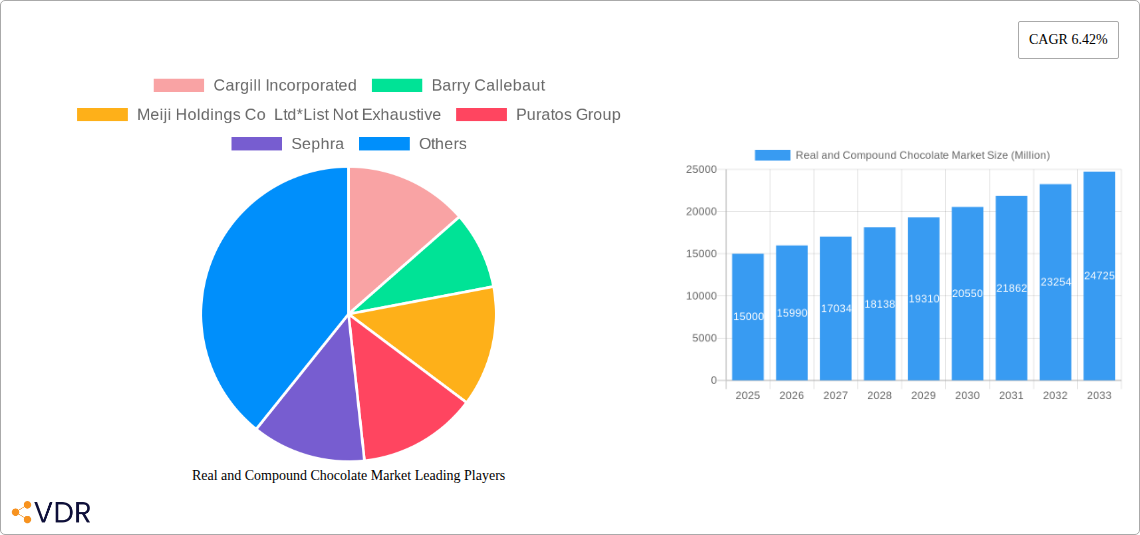
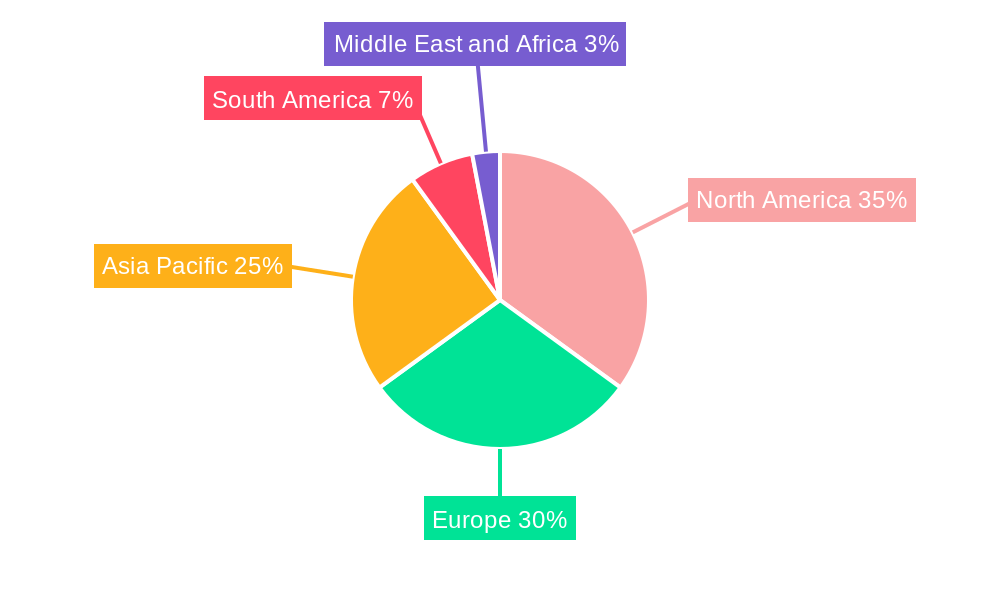
The global real and compound chocolate market, valued at approximately $XX million in 2025, is projected to experience robust growth, driven by increasing consumer demand for premium chocolate products and the expanding use of chocolate in diverse applications beyond traditional confectionery. The market's Compound Annual Growth Rate (CAGR) of 6.42% from 2019 to 2024 suggests a continued upward trajectory. Key growth drivers include rising disposable incomes in developing economies fueling premium chocolate consumption, innovative product development incorporating health-conscious ingredients (e.g., dark chocolate with high cocoa content), and the increasing popularity of chocolate-flavored beverages and bakery items. The market is segmented by form (chocolate chips/drops/chunks, slabs, coatings, others), application (bakery, confectionery, frozen desserts, beverages, cereals, others), and type (dark, milk, white). The chocolate chip/drop/chunk segment is expected to dominate due to its versatility in various food applications. The bakery and confectionery sectors remain the largest consumers, but growth is anticipated in frozen desserts and beverages categories. Regional market dynamics vary, with North America and Europe holding significant market shares due to established chocolate consumption patterns and robust food processing industries. However, rapidly growing economies in Asia-Pacific are expected to witness substantial market expansion in the forecast period (2025-2033), driven by increasing urbanization and changing consumer preferences. Despite the overall positive outlook, market growth may be slightly restrained by fluctuating cocoa bean prices and concerns regarding sugar content and overall health impacts.
The competitive landscape is characterized by a mix of large multinational corporations and smaller specialized manufacturers. Major players such as Cargill, Barry Callebaut, and Mondelez International hold significant market shares through established distribution networks and strong brand recognition. However, smaller players are innovating with unique product offerings and focusing on niche markets to gain market traction. The increasing focus on sustainability and ethically sourced cocoa beans is also influencing market dynamics, pushing companies to adopt responsible sourcing practices and increase transparency in their supply chains. This trend is expected to continue shaping the market in the coming years, impacting production practices and consumer purchasing decisions. The forecast period of 2025-2033 promises further consolidation and increased competition, necessitating strategies focused on product diversification, innovation, and sustainable practices.
Real and Compound Chocolate Market: A Comprehensive Market Report (2019-2033)
This comprehensive report provides an in-depth analysis of the global Real and Compound Chocolate Market, encompassing market dynamics, growth trends, regional dominance, product landscapes, and key players. The study period spans from 2019 to 2033, with a base year of 2025 and a forecast period of 2025-2033. The report is crucial for industry professionals, investors, and strategic decision-makers seeking to understand and capitalize on the opportunities within this dynamic market. Market size is presented in million units.
Real and Compound Chocolate Market Dynamics & Structure
The Real and Compound Chocolate market is characterized by a moderately concentrated landscape with several multinational corporations holding significant market share. Key drivers include technological innovations in processing and formulation, catering to consumer demands for healthier and more sustainable options. Stringent regulatory frameworks concerning ingredients and labeling influence product development and marketing strategies. Competitive substitutes, such as plant-based alternatives, pose challenges, demanding continuous innovation. M&A activity has been moderate, primarily focused on expanding geographical reach and product portfolios. End-user demographics, particularly increasing demand from millennials and Gen Z for premium and specialized chocolates, are shaping market trends.
- Market Concentration: High (xx%), with top 5 players holding xx% market share in 2024.
- Technological Innovation: Focus on sustainable sourcing, reduced sugar content, and innovative flavor profiles.
- Regulatory Landscape: Stringent regulations on labeling, allergen information, and sourcing practices.
- Competitive Substitutes: Plant-based chocolates and other confectionery items.
- M&A Activity: xx deals recorded between 2019-2024, with an average deal value of xx million units.
- Innovation Barriers: High R&D costs, stringent regulations, and consumer preference for established brands.
Real and Compound Chocolate Market Growth Trends & Insights
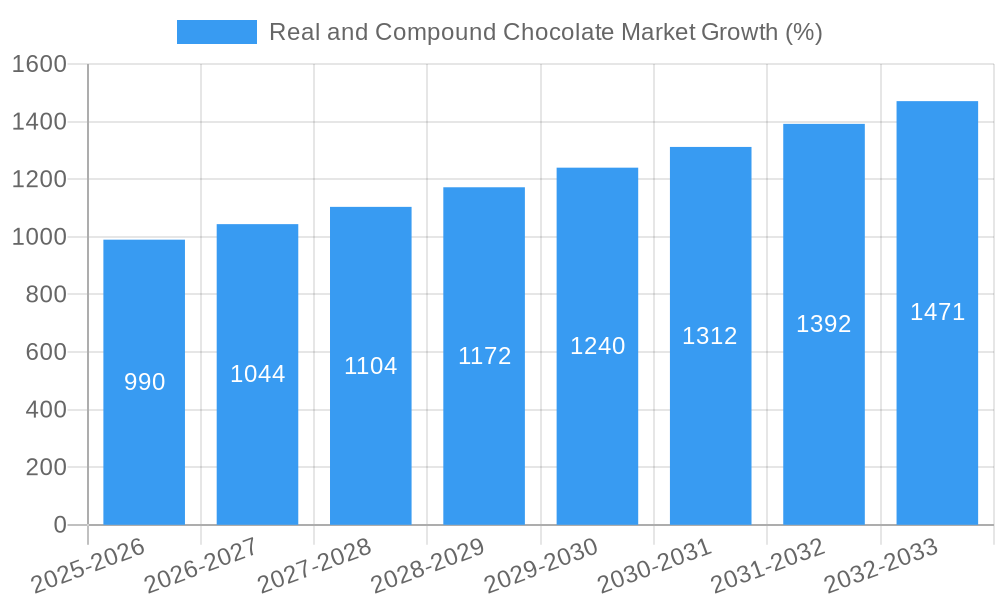
The Real and Compound Chocolate market exhibits consistent growth, driven by increasing consumer spending on premium confectionery products and the expanding application across various industries. The market size experienced a CAGR of xx% during the historical period (2019-2024), reaching xx million units in 2024. This growth is projected to continue at a CAGR of xx% during the forecast period (2025-2033), reaching xx million units by 2033. Technological disruptions, such as the introduction of 3D-printed chocolates and personalized confectionery, are further fueling market expansion. Changing consumer preferences towards healthier options and personalized experiences are reshaping product development and marketing strategies. Market penetration remains high in developed countries but offers significant potential in emerging markets with rising disposable incomes.
Dominant Regions, Countries, or Segments in Real and Compound Chocolate Market
The North American region currently holds the largest market share in the real and compound chocolate market, driven by high chocolate consumption rates and established distribution networks. Within this region, the United States is the dominant country, followed by Canada. In terms of segments, the confectionery application segment holds the largest market share, followed by bakery. The milk chocolate type continues to dominate in terms of volume but dark chocolate shows higher growth potential. Chocolate chips/drops/chunks is the leading form due to its wide applicability across various food and beverage segments.
- Key Drivers (North America): High disposable incomes, strong demand for premium chocolates, established distribution channels.
- Dominance Factors: High per capita consumption, strong brand presence, extensive retail infrastructure.
- Growth Potential: Emerging markets in Asia-Pacific and Latin America offer significant growth opportunities.
- Leading Segments: Confectionery (xx million units in 2024), Milk Chocolate (xx million units in 2024), Chocolate Chips/Drops/Chunks (xx million units in 2024).
Real and Compound Chocolate Market Product Landscape
The real and compound chocolate market offers a diverse product landscape, ranging from traditional chocolate bars and chips to innovative formulations designed to cater to specific dietary needs and preferences. Product innovations focus on incorporating functional ingredients, such as probiotics and superfoods, and creating customized chocolate experiences with varying degrees of sweetness and texture. Technological advancements, such as precision fermentation for flavor enhancement and sustainable sourcing practices, are driving product differentiation.
Key Drivers, Barriers & Challenges in Real and Compound Chocolate Market
Key Drivers: Rising disposable incomes, increasing demand for premium confectionery items, product innovation, growing health consciousness (with focus on dark chocolate), expansion in emerging markets.
Key Challenges: Fluctuations in raw material prices (cocoa beans, sugar), stringent regulations on food safety and labeling, intense competition among established brands, rising transportation costs impacting supply chains, sustainability concerns. Supply chain disruptions led to a xx% increase in costs in 2022, affecting profitability.
Emerging Opportunities in Real and Compound Chocolate Market
Emerging opportunities lie in the growing demand for personalized chocolate experiences, expansion into niche markets such as vegan and organic chocolates, and the development of functional chocolates with added health benefits (e.g., protein, fiber, antioxidants). Untapped markets in developing economies present significant growth potential. Innovative applications in areas such as nutraceuticals and cosmeceuticals are also emerging.
Growth Accelerators in the Real and Compound Chocolate Market Industry
Strategic partnerships between chocolate manufacturers and ingredient suppliers are driving innovation and improving efficiency within the supply chain. Technological advancements in processing and formulation allow for customization and the creation of healthier chocolate products, catering to evolving consumer preferences. Market expansion into new geographical regions, particularly in developing economies, is driving substantial growth.
Key Players Shaping the Real and Compound Chocolate Market Market
- Cargill Incorporated
- Barry Callebaut
- Meiji Holdings Co Ltd
- Puratos Group
- Sephra
- Ferrero International SA
- Clasen Quality Chocolate Inc
- Aalst Wilmar Pte Ltd
- AAK
- Fuji Oil Holdings Inc
- Mondelez International
Notable Milestones in Real and Compound Chocolate Market Sector
- 2021: Increased focus on sustainable cocoa sourcing by major players.
- 2022: Launch of several new vegan chocolate products by key players.
- 2023: Significant investment in new chocolate processing technologies by several companies.
In-Depth Real and Compound Chocolate Market Market Outlook
The Real and Compound Chocolate market is poised for continued growth, driven by factors such as increasing consumer demand, product innovation, and market expansion in emerging economies. Strategic investments in sustainable sourcing and technological advancements will further enhance market prospects. Companies that successfully adapt to changing consumer preferences and adopt sustainable practices will be best positioned for long-term success. The market is expected to remain dynamic, with ongoing competition and innovation shaping future trends.
Real and Compound Chocolate Market Segmentation
-
1. Type
- 1.1. Dark
- 1.2. Milk
- 1.3. White
-
2. Form
- 2.1. Chocolate Chips/Drops/Chunks
- 2.2. Chocolate Slab
- 2.3. Chocolate Coatings
- 2.4. Other Forms
-
3. Application
- 3.1. Bakery
- 3.2. Confectionery
- 3.3. Frozen Desserts and Ice Cream
- 3.4. Beverages
- 3.5. Cereals
- 3.6. Other Applications
Real and Compound Chocolate Market Segmentation By Geography
-
1. North America
- 1.1. United States
- 1.2. Canada
- 1.3. Mexico
- 1.4. Rest of North America
-
2. Europe
- 2.1. Spain
- 2.2. United Kingdom
- 2.3. Germany
- 2.4. France
- 2.5. Italy
- 2.6. Russia
- 2.7. Rest of Europe
-
3. Asia Pacific
- 3.1. China
- 3.2. Japan
- 3.3. India
- 3.4. Australia
- 3.5. Rest of Asia Pacific
-
4. South America
- 4.1. Brazil
- 4.2. Argentina
- 4.3. Rest of South America
-
5. Middle East and Africa
- 5.1. South Africa
- 5.2. United Arab Emirates
- 5.3. Rest of Middle East and Africa
Real and Compound Chocolate Market REPORT HIGHLIGHTS
| Aspects | Details |
|---|---|
| Study Period | 2019-2033 |
| Base Year | 2024 |
| Estimated Year | 2025 |
| Forecast Period | 2025-2033 |
| Historical Period | 2019-2024 |
| Growth Rate | CAGR of 6.42% from 2019-2033 |
| Segmentation |
|
Table of Contents
- 1. Introduction
- 1.1. Research Scope
- 1.2. Market Segmentation
- 1.3. Research Methodology
- 1.4. Definitions and Assumptions
- 2. Executive Summary
- 2.1. Introduction
- 3. Market Dynamics
- 3.1. Introduction
- 3.2. Market Drivers
- 3.2.1. Increasing Demand for Low-Fat and Low-Calorie Food; Increasing Product Innovation
- 3.3. Market Restrains
- 3.3.1. ; Threat of New Entrants; Bargaining Power of Buyers/Consumers; Bargaining Power of Suppliers; Threat of Substitute Products; Degree Of Competition
- 3.4. Market Trends
- 3.4.1. Increasing Demand for Single-origin and Certified Chocolate
- 4. Market Factor Analysis
- 4.1. Porters Five Forces
- 4.2. Supply/Value Chain
- 4.3. PESTEL analysis
- 4.4. Market Entropy
- 4.5. Patent/Trademark Analysis
- 5. Global Real and Compound Chocolate Market Analysis, Insights and Forecast, 2019-2031
- 5.1. Market Analysis, Insights and Forecast - by Type
- 5.1.1. Dark
- 5.1.2. Milk
- 5.1.3. White
- 5.2. Market Analysis, Insights and Forecast - by Form
- 5.2.1. Chocolate Chips/Drops/Chunks
- 5.2.2. Chocolate Slab
- 5.2.3. Chocolate Coatings
- 5.2.4. Other Forms
- 5.3. Market Analysis, Insights and Forecast - by Application
- 5.3.1. Bakery
- 5.3.2. Confectionery
- 5.3.3. Frozen Desserts and Ice Cream
- 5.3.4. Beverages
- 5.3.5. Cereals
- 5.3.6. Other Applications
- 5.4. Market Analysis, Insights and Forecast - by Region
- 5.4.1. North America
- 5.4.2. Europe
- 5.4.3. Asia Pacific
- 5.4.4. South America
- 5.4.5. Middle East and Africa
- 5.1. Market Analysis, Insights and Forecast - by Type
- 6. North America Real and Compound Chocolate Market Analysis, Insights and Forecast, 2019-2031
- 6.1. Market Analysis, Insights and Forecast - by Type
- 6.1.1. Dark
- 6.1.2. Milk
- 6.1.3. White
- 6.2. Market Analysis, Insights and Forecast - by Form
- 6.2.1. Chocolate Chips/Drops/Chunks
- 6.2.2. Chocolate Slab
- 6.2.3. Chocolate Coatings
- 6.2.4. Other Forms
- 6.3. Market Analysis, Insights and Forecast - by Application
- 6.3.1. Bakery
- 6.3.2. Confectionery
- 6.3.3. Frozen Desserts and Ice Cream
- 6.3.4. Beverages
- 6.3.5. Cereals
- 6.3.6. Other Applications
- 6.1. Market Analysis, Insights and Forecast - by Type
- 7. Europe Real and Compound Chocolate Market Analysis, Insights and Forecast, 2019-2031
- 7.1. Market Analysis, Insights and Forecast - by Type
- 7.1.1. Dark
- 7.1.2. Milk
- 7.1.3. White
- 7.2. Market Analysis, Insights and Forecast - by Form
- 7.2.1. Chocolate Chips/Drops/Chunks
- 7.2.2. Chocolate Slab
- 7.2.3. Chocolate Coatings
- 7.2.4. Other Forms
- 7.3. Market Analysis, Insights and Forecast - by Application
- 7.3.1. Bakery
- 7.3.2. Confectionery
- 7.3.3. Frozen Desserts and Ice Cream
- 7.3.4. Beverages
- 7.3.5. Cereals
- 7.3.6. Other Applications
- 7.1. Market Analysis, Insights and Forecast - by Type
- 8. Asia Pacific Real and Compound Chocolate Market Analysis, Insights and Forecast, 2019-2031
- 8.1. Market Analysis, Insights and Forecast - by Type
- 8.1.1. Dark
- 8.1.2. Milk
- 8.1.3. White
- 8.2. Market Analysis, Insights and Forecast - by Form
- 8.2.1. Chocolate Chips/Drops/Chunks
- 8.2.2. Chocolate Slab
- 8.2.3. Chocolate Coatings
- 8.2.4. Other Forms
- 8.3. Market Analysis, Insights and Forecast - by Application
- 8.3.1. Bakery
- 8.3.2. Confectionery
- 8.3.3. Frozen Desserts and Ice Cream
- 8.3.4. Beverages
- 8.3.5. Cereals
- 8.3.6. Other Applications
- 8.1. Market Analysis, Insights and Forecast - by Type
- 9. South America Real and Compound Chocolate Market Analysis, Insights and Forecast, 2019-2031
- 9.1. Market Analysis, Insights and Forecast - by Type
- 9.1.1. Dark
- 9.1.2. Milk
- 9.1.3. White
- 9.2. Market Analysis, Insights and Forecast - by Form
- 9.2.1. Chocolate Chips/Drops/Chunks
- 9.2.2. Chocolate Slab
- 9.2.3. Chocolate Coatings
- 9.2.4. Other Forms
- 9.3. Market Analysis, Insights and Forecast - by Application
- 9.3.1. Bakery
- 9.3.2. Confectionery
- 9.3.3. Frozen Desserts and Ice Cream
- 9.3.4. Beverages
- 9.3.5. Cereals
- 9.3.6. Other Applications
- 9.1. Market Analysis, Insights and Forecast - by Type
- 10. Middle East and Africa Real and Compound Chocolate Market Analysis, Insights and Forecast, 2019-2031
- 10.1. Market Analysis, Insights and Forecast - by Type
- 10.1.1. Dark
- 10.1.2. Milk
- 10.1.3. White
- 10.2. Market Analysis, Insights and Forecast - by Form
- 10.2.1. Chocolate Chips/Drops/Chunks
- 10.2.2. Chocolate Slab
- 10.2.3. Chocolate Coatings
- 10.2.4. Other Forms
- 10.3. Market Analysis, Insights and Forecast - by Application
- 10.3.1. Bakery
- 10.3.2. Confectionery
- 10.3.3. Frozen Desserts and Ice Cream
- 10.3.4. Beverages
- 10.3.5. Cereals
- 10.3.6. Other Applications
- 10.1. Market Analysis, Insights and Forecast - by Type
- 11. North America Real and Compound Chocolate Market Analysis, Insights and Forecast, 2019-2031
- 11.1. Market Analysis, Insights and Forecast - By Country/Sub-region
- 11.1.1 United States
- 11.1.2 Canada
- 11.1.3 Mexico
- 11.1.4 Rest of North America
- 12. Europe Real and Compound Chocolate Market Analysis, Insights and Forecast, 2019-2031
- 12.1. Market Analysis, Insights and Forecast - By Country/Sub-region
- 12.1.1 Spain
- 12.1.2 United Kingdom
- 12.1.3 Germany
- 12.1.4 France
- 12.1.5 Italy
- 12.1.6 Russia
- 12.1.7 Rest of Europe
- 13. Asia Pacific Real and Compound Chocolate Market Analysis, Insights and Forecast, 2019-2031
- 13.1. Market Analysis, Insights and Forecast - By Country/Sub-region
- 13.1.1 China
- 13.1.2 Japan
- 13.1.3 India
- 13.1.4 Australia
- 13.1.5 Rest of Asia Pacific
- 14. South America Real and Compound Chocolate Market Analysis, Insights and Forecast, 2019-2031
- 14.1. Market Analysis, Insights and Forecast - By Country/Sub-region
- 14.1.1 Brazil
- 14.1.2 Argentina
- 14.1.3 Rest of South America
- 15. Middle East and Africa Real and Compound Chocolate Market Analysis, Insights and Forecast, 2019-2031
- 15.1. Market Analysis, Insights and Forecast - By Country/Sub-region
- 15.1.1 South Africa
- 15.1.2 United Arab Emirates
- 15.1.3 Rest of Middle East and Africa
- 16. Competitive Analysis
- 16.1. Global Market Share Analysis 2024
- 16.2. Company Profiles
- 16.2.1 Cargill Incorporated
- 16.2.1.1. Overview
- 16.2.1.2. Products
- 16.2.1.3. SWOT Analysis
- 16.2.1.4. Recent Developments
- 16.2.1.5. Financials (Based on Availability)
- 16.2.2 Barry Callebaut
- 16.2.2.1. Overview
- 16.2.2.2. Products
- 16.2.2.3. SWOT Analysis
- 16.2.2.4. Recent Developments
- 16.2.2.5. Financials (Based on Availability)
- 16.2.3 Meiji Holdings Co Ltd*List Not Exhaustive
- 16.2.3.1. Overview
- 16.2.3.2. Products
- 16.2.3.3. SWOT Analysis
- 16.2.3.4. Recent Developments
- 16.2.3.5. Financials (Based on Availability)
- 16.2.4 Puratos Group
- 16.2.4.1. Overview
- 16.2.4.2. Products
- 16.2.4.3. SWOT Analysis
- 16.2.4.4. Recent Developments
- 16.2.4.5. Financials (Based on Availability)
- 16.2.5 Sephra
- 16.2.5.1. Overview
- 16.2.5.2. Products
- 16.2.5.3. SWOT Analysis
- 16.2.5.4. Recent Developments
- 16.2.5.5. Financials (Based on Availability)
- 16.2.6 Ferrero International SA
- 16.2.6.1. Overview
- 16.2.6.2. Products
- 16.2.6.3. SWOT Analysis
- 16.2.6.4. Recent Developments
- 16.2.6.5. Financials (Based on Availability)
- 16.2.7 Clasen Quality Chocolate Inc
- 16.2.7.1. Overview
- 16.2.7.2. Products
- 16.2.7.3. SWOT Analysis
- 16.2.7.4. Recent Developments
- 16.2.7.5. Financials (Based on Availability)
- 16.2.8 Aalst Wilmar Pte Ltd
- 16.2.8.1. Overview
- 16.2.8.2. Products
- 16.2.8.3. SWOT Analysis
- 16.2.8.4. Recent Developments
- 16.2.8.5. Financials (Based on Availability)
- 16.2.9 AAK
- 16.2.9.1. Overview
- 16.2.9.2. Products
- 16.2.9.3. SWOT Analysis
- 16.2.9.4. Recent Developments
- 16.2.9.5. Financials (Based on Availability)
- 16.2.10 Fuji Oil Holdings Inc
- 16.2.10.1. Overview
- 16.2.10.2. Products
- 16.2.10.3. SWOT Analysis
- 16.2.10.4. Recent Developments
- 16.2.10.5. Financials (Based on Availability)
- 16.2.11 Mondelez International
- 16.2.11.1. Overview
- 16.2.11.2. Products
- 16.2.11.3. SWOT Analysis
- 16.2.11.4. Recent Developments
- 16.2.11.5. Financials (Based on Availability)
- 16.2.1 Cargill Incorporated
List of Figures
- Figure 1: Global Real and Compound Chocolate Market Revenue Breakdown (Million, %) by Region 2024 & 2032
- Figure 2: North America Real and Compound Chocolate Market Revenue (Million), by Country 2024 & 2032
- Figure 3: North America Real and Compound Chocolate Market Revenue Share (%), by Country 2024 & 2032
- Figure 4: Europe Real and Compound Chocolate Market Revenue (Million), by Country 2024 & 2032
- Figure 5: Europe Real and Compound Chocolate Market Revenue Share (%), by Country 2024 & 2032
- Figure 6: Asia Pacific Real and Compound Chocolate Market Revenue (Million), by Country 2024 & 2032
- Figure 7: Asia Pacific Real and Compound Chocolate Market Revenue Share (%), by Country 2024 & 2032
- Figure 8: South America Real and Compound Chocolate Market Revenue (Million), by Country 2024 & 2032
- Figure 9: South America Real and Compound Chocolate Market Revenue Share (%), by Country 2024 & 2032
- Figure 10: Middle East and Africa Real and Compound Chocolate Market Revenue (Million), by Country 2024 & 2032
- Figure 11: Middle East and Africa Real and Compound Chocolate Market Revenue Share (%), by Country 2024 & 2032
- Figure 12: North America Real and Compound Chocolate Market Revenue (Million), by Type 2024 & 2032
- Figure 13: North America Real and Compound Chocolate Market Revenue Share (%), by Type 2024 & 2032
- Figure 14: North America Real and Compound Chocolate Market Revenue (Million), by Form 2024 & 2032
- Figure 15: North America Real and Compound Chocolate Market Revenue Share (%), by Form 2024 & 2032
- Figure 16: North America Real and Compound Chocolate Market Revenue (Million), by Application 2024 & 2032
- Figure 17: North America Real and Compound Chocolate Market Revenue Share (%), by Application 2024 & 2032
- Figure 18: North America Real and Compound Chocolate Market Revenue (Million), by Country 2024 & 2032
- Figure 19: North America Real and Compound Chocolate Market Revenue Share (%), by Country 2024 & 2032
- Figure 20: Europe Real and Compound Chocolate Market Revenue (Million), by Type 2024 & 2032
- Figure 21: Europe Real and Compound Chocolate Market Revenue Share (%), by Type 2024 & 2032
- Figure 22: Europe Real and Compound Chocolate Market Revenue (Million), by Form 2024 & 2032
- Figure 23: Europe Real and Compound Chocolate Market Revenue Share (%), by Form 2024 & 2032
- Figure 24: Europe Real and Compound Chocolate Market Revenue (Million), by Application 2024 & 2032
- Figure 25: Europe Real and Compound Chocolate Market Revenue Share (%), by Application 2024 & 2032
- Figure 26: Europe Real and Compound Chocolate Market Revenue (Million), by Country 2024 & 2032
- Figure 27: Europe Real and Compound Chocolate Market Revenue Share (%), by Country 2024 & 2032
- Figure 28: Asia Pacific Real and Compound Chocolate Market Revenue (Million), by Type 2024 & 2032
- Figure 29: Asia Pacific Real and Compound Chocolate Market Revenue Share (%), by Type 2024 & 2032
- Figure 30: Asia Pacific Real and Compound Chocolate Market Revenue (Million), by Form 2024 & 2032
- Figure 31: Asia Pacific Real and Compound Chocolate Market Revenue Share (%), by Form 2024 & 2032
- Figure 32: Asia Pacific Real and Compound Chocolate Market Revenue (Million), by Application 2024 & 2032
- Figure 33: Asia Pacific Real and Compound Chocolate Market Revenue Share (%), by Application 2024 & 2032
- Figure 34: Asia Pacific Real and Compound Chocolate Market Revenue (Million), by Country 2024 & 2032
- Figure 35: Asia Pacific Real and Compound Chocolate Market Revenue Share (%), by Country 2024 & 2032
- Figure 36: South America Real and Compound Chocolate Market Revenue (Million), by Type 2024 & 2032
- Figure 37: South America Real and Compound Chocolate Market Revenue Share (%), by Type 2024 & 2032
- Figure 38: South America Real and Compound Chocolate Market Revenue (Million), by Form 2024 & 2032
- Figure 39: South America Real and Compound Chocolate Market Revenue Share (%), by Form 2024 & 2032
- Figure 40: South America Real and Compound Chocolate Market Revenue (Million), by Application 2024 & 2032
- Figure 41: South America Real and Compound Chocolate Market Revenue Share (%), by Application 2024 & 2032
- Figure 42: South America Real and Compound Chocolate Market Revenue (Million), by Country 2024 & 2032
- Figure 43: South America Real and Compound Chocolate Market Revenue Share (%), by Country 2024 & 2032
- Figure 44: Middle East and Africa Real and Compound Chocolate Market Revenue (Million), by Type 2024 & 2032
- Figure 45: Middle East and Africa Real and Compound Chocolate Market Revenue Share (%), by Type 2024 & 2032
- Figure 46: Middle East and Africa Real and Compound Chocolate Market Revenue (Million), by Form 2024 & 2032
- Figure 47: Middle East and Africa Real and Compound Chocolate Market Revenue Share (%), by Form 2024 & 2032
- Figure 48: Middle East and Africa Real and Compound Chocolate Market Revenue (Million), by Application 2024 & 2032
- Figure 49: Middle East and Africa Real and Compound Chocolate Market Revenue Share (%), by Application 2024 & 2032
- Figure 50: Middle East and Africa Real and Compound Chocolate Market Revenue (Million), by Country 2024 & 2032
- Figure 51: Middle East and Africa Real and Compound Chocolate Market Revenue Share (%), by Country 2024 & 2032
List of Tables
- Table 1: Global Real and Compound Chocolate Market Revenue Million Forecast, by Region 2019 & 2032
- Table 2: Global Real and Compound Chocolate Market Revenue Million Forecast, by Type 2019 & 2032
- Table 3: Global Real and Compound Chocolate Market Revenue Million Forecast, by Form 2019 & 2032
- Table 4: Global Real and Compound Chocolate Market Revenue Million Forecast, by Application 2019 & 2032
- Table 5: Global Real and Compound Chocolate Market Revenue Million Forecast, by Region 2019 & 2032
- Table 6: Global Real and Compound Chocolate Market Revenue Million Forecast, by Country 2019 & 2032
- Table 7: United States Real and Compound Chocolate Market Revenue (Million) Forecast, by Application 2019 & 2032
- Table 8: Canada Real and Compound Chocolate Market Revenue (Million) Forecast, by Application 2019 & 2032
- Table 9: Mexico Real and Compound Chocolate Market Revenue (Million) Forecast, by Application 2019 & 2032
- Table 10: Rest of North America Real and Compound Chocolate Market Revenue (Million) Forecast, by Application 2019 & 2032
- Table 11: Global Real and Compound Chocolate Market Revenue Million Forecast, by Country 2019 & 2032
- Table 12: Spain Real and Compound Chocolate Market Revenue (Million) Forecast, by Application 2019 & 2032
- Table 13: United Kingdom Real and Compound Chocolate Market Revenue (Million) Forecast, by Application 2019 & 2032
- Table 14: Germany Real and Compound Chocolate Market Revenue (Million) Forecast, by Application 2019 & 2032
- Table 15: France Real and Compound Chocolate Market Revenue (Million) Forecast, by Application 2019 & 2032
- Table 16: Italy Real and Compound Chocolate Market Revenue (Million) Forecast, by Application 2019 & 2032
- Table 17: Russia Real and Compound Chocolate Market Revenue (Million) Forecast, by Application 2019 & 2032
- Table 18: Rest of Europe Real and Compound Chocolate Market Revenue (Million) Forecast, by Application 2019 & 2032
- Table 19: Global Real and Compound Chocolate Market Revenue Million Forecast, by Country 2019 & 2032
- Table 20: China Real and Compound Chocolate Market Revenue (Million) Forecast, by Application 2019 & 2032
- Table 21: Japan Real and Compound Chocolate Market Revenue (Million) Forecast, by Application 2019 & 2032
- Table 22: India Real and Compound Chocolate Market Revenue (Million) Forecast, by Application 2019 & 2032
- Table 23: Australia Real and Compound Chocolate Market Revenue (Million) Forecast, by Application 2019 & 2032
- Table 24: Rest of Asia Pacific Real and Compound Chocolate Market Revenue (Million) Forecast, by Application 2019 & 2032
- Table 25: Global Real and Compound Chocolate Market Revenue Million Forecast, by Country 2019 & 2032
- Table 26: Brazil Real and Compound Chocolate Market Revenue (Million) Forecast, by Application 2019 & 2032
- Table 27: Argentina Real and Compound Chocolate Market Revenue (Million) Forecast, by Application 2019 & 2032
- Table 28: Rest of South America Real and Compound Chocolate Market Revenue (Million) Forecast, by Application 2019 & 2032
- Table 29: Global Real and Compound Chocolate Market Revenue Million Forecast, by Country 2019 & 2032
- Table 30: South Africa Real and Compound Chocolate Market Revenue (Million) Forecast, by Application 2019 & 2032
- Table 31: United Arab Emirates Real and Compound Chocolate Market Revenue (Million) Forecast, by Application 2019 & 2032
- Table 32: Rest of Middle East and Africa Real and Compound Chocolate Market Revenue (Million) Forecast, by Application 2019 & 2032
- Table 33: Global Real and Compound Chocolate Market Revenue Million Forecast, by Type 2019 & 2032
- Table 34: Global Real and Compound Chocolate Market Revenue Million Forecast, by Form 2019 & 2032
- Table 35: Global Real and Compound Chocolate Market Revenue Million Forecast, by Application 2019 & 2032
- Table 36: Global Real and Compound Chocolate Market Revenue Million Forecast, by Country 2019 & 2032
- Table 37: United States Real and Compound Chocolate Market Revenue (Million) Forecast, by Application 2019 & 2032
- Table 38: Canada Real and Compound Chocolate Market Revenue (Million) Forecast, by Application 2019 & 2032
- Table 39: Mexico Real and Compound Chocolate Market Revenue (Million) Forecast, by Application 2019 & 2032
- Table 40: Rest of North America Real and Compound Chocolate Market Revenue (Million) Forecast, by Application 2019 & 2032
- Table 41: Global Real and Compound Chocolate Market Revenue Million Forecast, by Type 2019 & 2032
- Table 42: Global Real and Compound Chocolate Market Revenue Million Forecast, by Form 2019 & 2032
- Table 43: Global Real and Compound Chocolate Market Revenue Million Forecast, by Application 2019 & 2032
- Table 44: Global Real and Compound Chocolate Market Revenue Million Forecast, by Country 2019 & 2032
- Table 45: Spain Real and Compound Chocolate Market Revenue (Million) Forecast, by Application 2019 & 2032
- Table 46: United Kingdom Real and Compound Chocolate Market Revenue (Million) Forecast, by Application 2019 & 2032
- Table 47: Germany Real and Compound Chocolate Market Revenue (Million) Forecast, by Application 2019 & 2032
- Table 48: France Real and Compound Chocolate Market Revenue (Million) Forecast, by Application 2019 & 2032
- Table 49: Italy Real and Compound Chocolate Market Revenue (Million) Forecast, by Application 2019 & 2032
- Table 50: Russia Real and Compound Chocolate Market Revenue (Million) Forecast, by Application 2019 & 2032
- Table 51: Rest of Europe Real and Compound Chocolate Market Revenue (Million) Forecast, by Application 2019 & 2032
- Table 52: Global Real and Compound Chocolate Market Revenue Million Forecast, by Type 2019 & 2032
- Table 53: Global Real and Compound Chocolate Market Revenue Million Forecast, by Form 2019 & 2032
- Table 54: Global Real and Compound Chocolate Market Revenue Million Forecast, by Application 2019 & 2032
- Table 55: Global Real and Compound Chocolate Market Revenue Million Forecast, by Country 2019 & 2032
- Table 56: China Real and Compound Chocolate Market Revenue (Million) Forecast, by Application 2019 & 2032
- Table 57: Japan Real and Compound Chocolate Market Revenue (Million) Forecast, by Application 2019 & 2032
- Table 58: India Real and Compound Chocolate Market Revenue (Million) Forecast, by Application 2019 & 2032
- Table 59: Australia Real and Compound Chocolate Market Revenue (Million) Forecast, by Application 2019 & 2032
- Table 60: Rest of Asia Pacific Real and Compound Chocolate Market Revenue (Million) Forecast, by Application 2019 & 2032
- Table 61: Global Real and Compound Chocolate Market Revenue Million Forecast, by Type 2019 & 2032
- Table 62: Global Real and Compound Chocolate Market Revenue Million Forecast, by Form 2019 & 2032
- Table 63: Global Real and Compound Chocolate Market Revenue Million Forecast, by Application 2019 & 2032
- Table 64: Global Real and Compound Chocolate Market Revenue Million Forecast, by Country 2019 & 2032
- Table 65: Brazil Real and Compound Chocolate Market Revenue (Million) Forecast, by Application 2019 & 2032
- Table 66: Argentina Real and Compound Chocolate Market Revenue (Million) Forecast, by Application 2019 & 2032
- Table 67: Rest of South America Real and Compound Chocolate Market Revenue (Million) Forecast, by Application 2019 & 2032
- Table 68: Global Real and Compound Chocolate Market Revenue Million Forecast, by Type 2019 & 2032
- Table 69: Global Real and Compound Chocolate Market Revenue Million Forecast, by Form 2019 & 2032
- Table 70: Global Real and Compound Chocolate Market Revenue Million Forecast, by Application 2019 & 2032
- Table 71: Global Real and Compound Chocolate Market Revenue Million Forecast, by Country 2019 & 2032
- Table 72: South Africa Real and Compound Chocolate Market Revenue (Million) Forecast, by Application 2019 & 2032
- Table 73: United Arab Emirates Real and Compound Chocolate Market Revenue (Million) Forecast, by Application 2019 & 2032
- Table 74: Rest of Middle East and Africa Real and Compound Chocolate Market Revenue (Million) Forecast, by Application 2019 & 2032
Frequently Asked Questions
1. What is the projected Compound Annual Growth Rate (CAGR) of the Real and Compound Chocolate Market?
The projected CAGR is approximately 6.42%.
2. Which companies are prominent players in the Real and Compound Chocolate Market?
Key companies in the market include Cargill Incorporated, Barry Callebaut, Meiji Holdings Co Ltd*List Not Exhaustive, Puratos Group, Sephra, Ferrero International SA, Clasen Quality Chocolate Inc, Aalst Wilmar Pte Ltd, AAK, Fuji Oil Holdings Inc, Mondelez International.
3. What are the main segments of the Real and Compound Chocolate Market?
The market segments include Type, Form, Application.
4. Can you provide details about the market size?
The market size is estimated to be USD XX Million as of 2022.
5. What are some drivers contributing to market growth?
Increasing Demand for Low-Fat and Low-Calorie Food; Increasing Product Innovation.
6. What are the notable trends driving market growth?
Increasing Demand for Single-origin and Certified Chocolate.
7. Are there any restraints impacting market growth?
; Threat of New Entrants; Bargaining Power of Buyers/Consumers; Bargaining Power of Suppliers; Threat of Substitute Products; Degree Of Competition.
8. Can you provide examples of recent developments in the market?
N/A
9. What pricing options are available for accessing the report?
Pricing options include single-user, multi-user, and enterprise licenses priced at USD 4750, USD 5250, and USD 8750 respectively.
10. Is the market size provided in terms of value or volume?
The market size is provided in terms of value, measured in Million.
11. Are there any specific market keywords associated with the report?
Yes, the market keyword associated with the report is "Real and Compound Chocolate Market," which aids in identifying and referencing the specific market segment covered.
12. How do I determine which pricing option suits my needs best?
The pricing options vary based on user requirements and access needs. Individual users may opt for single-user licenses, while businesses requiring broader access may choose multi-user or enterprise licenses for cost-effective access to the report.
13. Are there any additional resources or data provided in the Real and Compound Chocolate Market report?
While the report offers comprehensive insights, it's advisable to review the specific contents or supplementary materials provided to ascertain if additional resources or data are available.
14. How can I stay updated on further developments or reports in the Real and Compound Chocolate Market?
To stay informed about further developments, trends, and reports in the Real and Compound Chocolate Market, consider subscribing to industry newsletters, following relevant companies and organizations, or regularly checking reputable industry news sources and publications.
Methodology
Step 1 - Identification of Relevant Samples Size from Population Database


Step 2 - Approaches for Defining Global Market Size (Value, Volume* & Price*)

Note*: In applicable scenarios
Step 3 - Data Sources
Primary Research
- Web Analytics
- Survey Reports
- Research Institute
- Latest Research Reports
- Opinion Leaders
Secondary Research
- Annual Reports
- White Paper
- Latest Press Release
- Industry Association
- Paid Database
- Investor Presentations

Step 4 - Data Triangulation
Involves using different sources of information in order to increase the validity of a study
These sources are likely to be stakeholders in a program - participants, other researchers, program staff, other community members, and so on.
Then we put all data in single framework & apply various statistical tools to find out the dynamic on the market.
During the analysis stage, feedback from the stakeholder groups would be compared to determine areas of agreement as well as areas of divergence


