
Key Insights
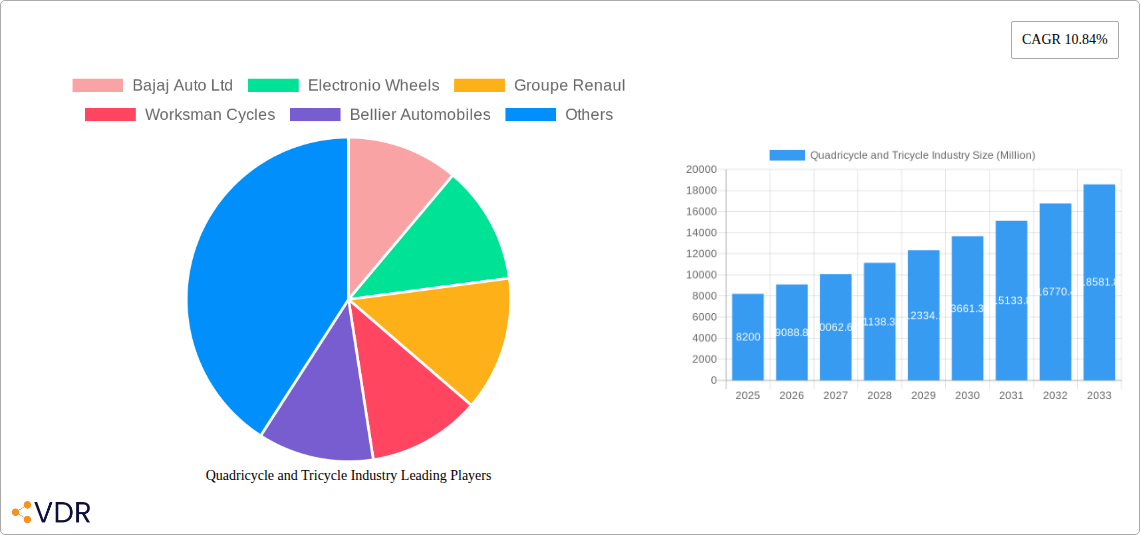
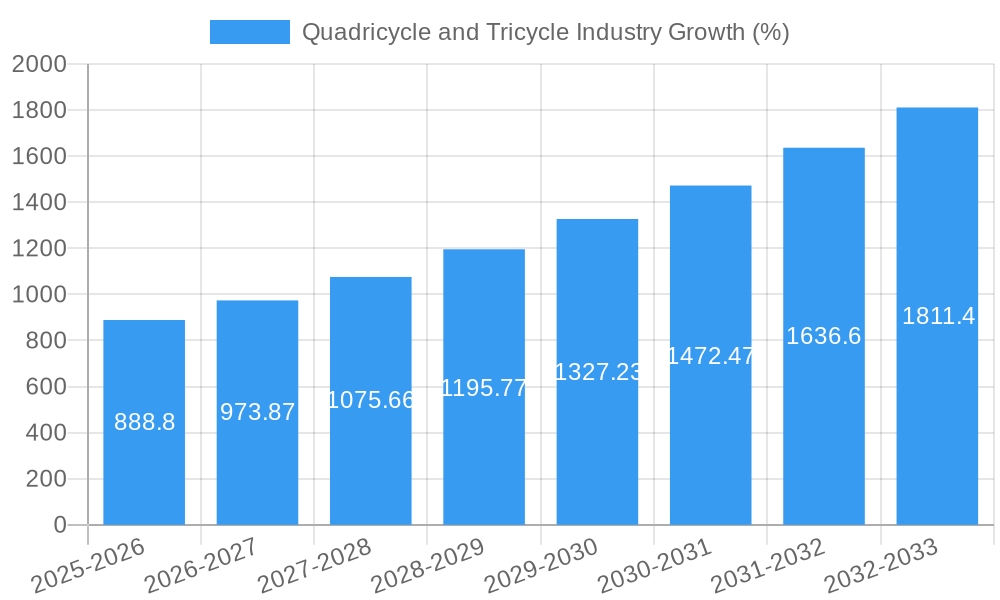
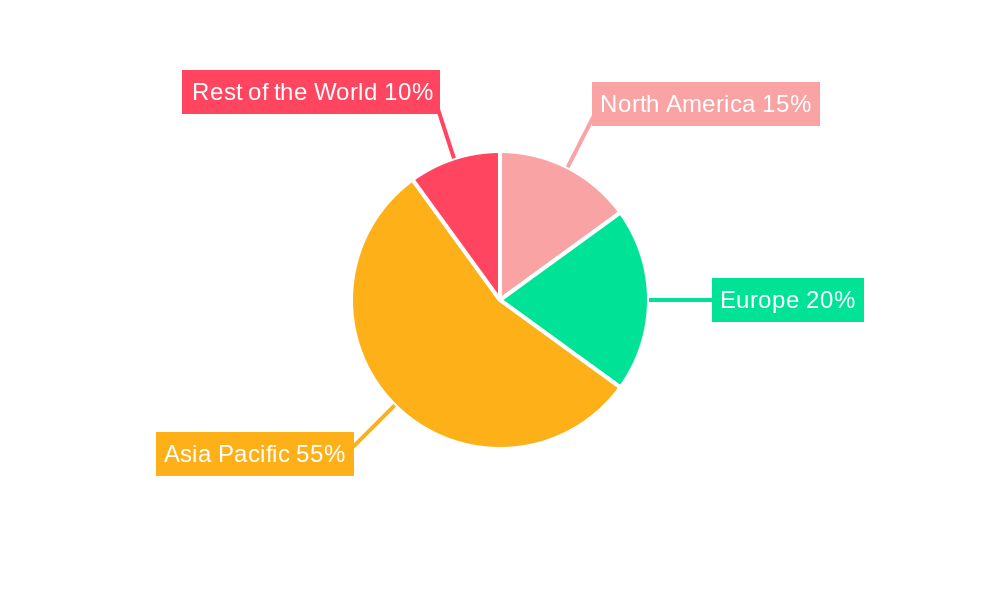
The global quadricycle and tricycle market, valued at $8.20 billion in 2025, is projected to experience robust growth, exhibiting a Compound Annual Growth Rate (CAGR) of 10.84% from 2025 to 2033. This expansion is driven by several key factors. Increasing urbanization in developing economies fuels demand for affordable and efficient last-mile transportation solutions, making quadricycles and tricycles attractive alternatives to cars and motorcycles. Furthermore, the rising popularity of e-commerce and delivery services necessitates reliable and maneuverable vehicles for efficient last-mile deliveries, further boosting market growth. Government initiatives promoting sustainable transportation, including subsidies and tax benefits for electric quadricycles and tricycles, are also significant contributors. The market segmentation reveals a strong preference for electric power sources, reflecting the global shift towards environmentally friendly transportation. The commercial segment is expected to dominate, driven by the aforementioned delivery services and fleet operations. While gasoline-powered vehicles retain a market presence, the transition towards electric models is accelerating rapidly. Geographical distribution shows significant growth potential in Asia Pacific, particularly India and China, due to their large populations and burgeoning economies. North America and Europe, while mature markets, will also contribute to market growth, propelled by the increasing adoption of electric vehicles and micro-mobility solutions.
The competitive landscape is characterized by a mix of established automotive players and specialized manufacturers. Established companies like Bajaj Auto Ltd and Mahindra and Mahindra leverage their manufacturing expertise and brand recognition to compete effectively. Smaller, specialized manufacturers focus on niche markets, offering innovative designs and features to cater to specific customer needs. The competitive intensity is expected to intensify as more players enter the market, driven by the significant growth opportunities. However, challenges remain, including infrastructure limitations for electric vehicle charging in some regions and the need for improved safety standards and regulatory frameworks to support the widespread adoption of quadricycles and tricycles. Continued innovation in battery technology, improved vehicle design, and supportive government policies will be crucial in unlocking the full potential of this dynamic market.
Quadricycle and Tricycle Industry Market Report: 2019-2033
This comprehensive report provides an in-depth analysis of the global Quadricycle and Tricycle industry, encompassing market dynamics, growth trends, regional landscapes, and key player strategies. The study period covers 2019-2033, with a base year of 2025 and a forecast period of 2025-2033. The report segments the market by application type (personal, commercial), vehicle type (quadricycle, tricycle), and power source type (electric, gasoline, solar). Projected market size is presented in Million units.
Quadricycle and Tricycle Industry Market Dynamics & Structure
This section analyzes the competitive landscape, technological advancements, regulatory influences, and market trends within the quadricycle and tricycle industry. The market is characterized by a mix of established players and emerging innovators, leading to a moderately fragmented structure. Market concentration is expected to evolve with technological disruptions and mergers & acquisitions (M&A). Technological innovation, particularly in electric powertrains and connected vehicle features, is a significant driver, although barriers to entry related to manufacturing expertise and regulatory compliance remain.
- Market Concentration: Moderately fragmented, with a few dominant players holding significant market share (approx. xx%).
- Technological Innovation: Focus on electric powertrains, improved safety features, and connectivity solutions.
- Regulatory Frameworks: Vary significantly across regions, impacting adoption rates and product design.
- Competitive Product Substitutes: Scooters, motorcycles, and small cars compete for the same customer segment.
- End-User Demographics: Primarily focused on last-mile delivery, personal transportation in urban areas, and rural markets with limited infrastructure.
- M&A Trends: A moderate number of M&A deals (xx deals in the past 5 years) focused on technological integration and market expansion.
Quadricycle and Tricycle Industry Growth Trends & Insights
The global quadricycle and tricycle market experienced substantial growth during the historical period (2019-2024). Driven by factors including increasing urbanization, rising fuel costs, and government initiatives promoting sustainable transportation, the market is poised for continued expansion. The adoption of electric powertrains is accelerating, pushing the overall market towards sustainability and lower running costs. Consumer preference is shifting towards more fuel-efficient and environmentally friendly vehicles, further driving market growth. We project a Compound Annual Growth Rate (CAGR) of xx% for the forecast period (2025-2033). Market penetration is expected to increase significantly, particularly in emerging markets. Technological disruptions, including advancements in battery technology and autonomous driving features, are reshaping the market dynamics.
Dominant Regions, Countries, or Segments in Quadricycle and Tricycle Industry
Asia, particularly India and Southeast Asia, is the dominant region for quadricycle and tricycle sales, driven by high population density, growing urbanization, and the strong presence of established manufacturers. Within application types, the commercial segment dominates, driven by the increasing demand for last-mile delivery services and goods transportation in urban and rural areas. Electric power source types are witnessing rapid growth, fueled by government incentives and increasing environmental awareness.
- Key Drivers for Asia: High population density, rising urbanization, robust government support for sustainable transportation, and a favorable cost structure for manufacturing.
- Commercial Segment Dominance: Fueled by booming e-commerce and the need for efficient, cost-effective last-mile delivery.
- Electric Power Source Growth: Driven by environmental concerns, government subsidies, and declining battery costs.
Quadricycle and Tricycle Industry Product Landscape
The market offers a diverse range of products, from basic, gasoline-powered models to sophisticated electric quadricycles with advanced features. Innovation focuses on improving fuel efficiency, enhancing safety features, and incorporating smart technologies. Unique selling propositions include compact design for maneuverability in congested areas, affordability, and increasing eco-friendliness through electrification. Performance metrics are improving with advancements in battery technology and motor efficiency.
Key Drivers, Barriers & Challenges in Quadricycle and Tricycle Industry
Key Drivers: Increasing urbanization, rising fuel prices, government regulations promoting sustainable transportation, and the growth of e-commerce and last-mile delivery services are key drivers.
Challenges: Stringent safety regulations, competition from established automotive manufacturers, and the need for improved charging infrastructure for electric vehicles present significant challenges. Supply chain disruptions also affect production and pricing.
Emerging Opportunities in Quadricycle and Tricycle Industry
Untapped markets in Africa and Latin America present significant growth opportunities. The development of specialized models for specific applications (e.g., agricultural use) will create new market segments. Integration of smart technologies such as telematics and connectivity will enhance product value and open new avenues for service offerings.
Growth Accelerators in the Quadricycle and Tricycle Industry Industry
Strategic partnerships between manufacturers and battery suppliers will drive innovation and reduce costs. Expansion into new markets through targeted marketing campaigns will unlock significant growth potential. Technological advancements, such as solid-state batteries and more efficient electric motors, will enhance the performance and appeal of these vehicles.
Key Players Shaping the Quadricycle and Tricycle Industry Market
- Bajaj Auto Ltd
- Electronio Wheels
- Groupe Renault
- Worksman Cycles
- Bellier Automobiles
- Mahindra and Mahindra
- Light Foot Cycle
- Automobiles CHATENET
- Estrima SRL
- Daimus
- Ligier Group
- Aixam-Mega
Notable Milestones in Quadricycle and Tricycle Industry Sector
- 2020: Introduction of several electric quadricycle models by major manufacturers.
- 2022: Significant investment in battery production facilities by key players.
- 2023: Several government initiatives launched to promote electric vehicle adoption in key markets.
In-Depth Quadricycle and Tricycle Industry Market Outlook
The quadricycle and tricycle market is projected to experience robust growth throughout the forecast period, driven by sustained urbanization, the rising demand for sustainable transportation solutions, and continued technological advancements. Strategic investments in R&D, strategic partnerships, and expansion into new markets will be crucial for companies to capitalize on this growth. The market will become increasingly competitive, with a focus on innovation and differentiation to secure market share.
Quadricycle and Tricycle Industry Segmentation
-
1. Power Source Type
- 1.1. Electric
- 1.2. Gasoline
- 1.3. Solar
-
2. Application Type
- 2.1. Personal
- 2.2. Commercial
-
3. Vehicle Type
- 3.1. Quadricycle
- 3.2. Tricycle
Quadricycle and Tricycle Industry Segmentation By Geography
-
1. North America
- 1.1. United States
- 1.2. Canada
- 1.3. Rest of North America
-
2. Europe
- 2.1. Germany
- 2.2. United Kingdom
- 2.3. France
- 2.4. Italy
- 2.5. Rest of Europe
-
3. Asia Pacific
- 3.1. China
- 3.2. Japan
- 3.3. India
- 3.4. South Korea
- 3.5. Rest of Asia Pacific
-
4. Rest of the World
- 4.1. Brazil
- 4.2. South Africa
- 4.3. United Arab Emirates
- 4.4. Other Countries
Quadricycle and Tricycle Industry REPORT HIGHLIGHTS
| Aspects | Details |
|---|---|
| Study Period | 2019-2033 |
| Base Year | 2024 |
| Estimated Year | 2025 |
| Forecast Period | 2025-2033 |
| Historical Period | 2019-2024 |
| Growth Rate | CAGR of 10.84% from 2019-2033 |
| Segmentation |
|
Table of Contents
- 1. Introduction
- 1.1. Research Scope
- 1.2. Market Segmentation
- 1.3. Research Methodology
- 1.4. Definitions and Assumptions
- 2. Executive Summary
- 2.1. Introduction
- 3. Market Dynamics
- 3.1. Introduction
- 3.2. Market Drivers
- 3.2.1. Integration With Telematics And Fleet Management Systems; Others
- 3.3. Market Restrains
- 3.3.1. The Initial Costs Associated With Purchasing And Installing ELD Systems is High; Others
- 3.4. Market Trends
- 3.4.1. Growing Adoption of Quadricycles Expected to Enhance Demand in the Market
- 4. Market Factor Analysis
- 4.1. Porters Five Forces
- 4.2. Supply/Value Chain
- 4.3. PESTEL analysis
- 4.4. Market Entropy
- 4.5. Patent/Trademark Analysis
- 5. Global Quadricycle and Tricycle Industry Analysis, Insights and Forecast, 2019-2031
- 5.1. Market Analysis, Insights and Forecast - by Power Source Type
- 5.1.1. Electric
- 5.1.2. Gasoline
- 5.1.3. Solar
- 5.2. Market Analysis, Insights and Forecast - by Application Type
- 5.2.1. Personal
- 5.2.2. Commercial
- 5.3. Market Analysis, Insights and Forecast - by Vehicle Type
- 5.3.1. Quadricycle
- 5.3.2. Tricycle
- 5.4. Market Analysis, Insights and Forecast - by Region
- 5.4.1. North America
- 5.4.2. Europe
- 5.4.3. Asia Pacific
- 5.4.4. Rest of the World
- 5.1. Market Analysis, Insights and Forecast - by Power Source Type
- 6. North America Quadricycle and Tricycle Industry Analysis, Insights and Forecast, 2019-2031
- 6.1. Market Analysis, Insights and Forecast - by Power Source Type
- 6.1.1. Electric
- 6.1.2. Gasoline
- 6.1.3. Solar
- 6.2. Market Analysis, Insights and Forecast - by Application Type
- 6.2.1. Personal
- 6.2.2. Commercial
- 6.3. Market Analysis, Insights and Forecast - by Vehicle Type
- 6.3.1. Quadricycle
- 6.3.2. Tricycle
- 6.1. Market Analysis, Insights and Forecast - by Power Source Type
- 7. Europe Quadricycle and Tricycle Industry Analysis, Insights and Forecast, 2019-2031
- 7.1. Market Analysis, Insights and Forecast - by Power Source Type
- 7.1.1. Electric
- 7.1.2. Gasoline
- 7.1.3. Solar
- 7.2. Market Analysis, Insights and Forecast - by Application Type
- 7.2.1. Personal
- 7.2.2. Commercial
- 7.3. Market Analysis, Insights and Forecast - by Vehicle Type
- 7.3.1. Quadricycle
- 7.3.2. Tricycle
- 7.1. Market Analysis, Insights and Forecast - by Power Source Type
- 8. Asia Pacific Quadricycle and Tricycle Industry Analysis, Insights and Forecast, 2019-2031
- 8.1. Market Analysis, Insights and Forecast - by Power Source Type
- 8.1.1. Electric
- 8.1.2. Gasoline
- 8.1.3. Solar
- 8.2. Market Analysis, Insights and Forecast - by Application Type
- 8.2.1. Personal
- 8.2.2. Commercial
- 8.3. Market Analysis, Insights and Forecast - by Vehicle Type
- 8.3.1. Quadricycle
- 8.3.2. Tricycle
- 8.1. Market Analysis, Insights and Forecast - by Power Source Type
- 9. Rest of the World Quadricycle and Tricycle Industry Analysis, Insights and Forecast, 2019-2031
- 9.1. Market Analysis, Insights and Forecast - by Power Source Type
- 9.1.1. Electric
- 9.1.2. Gasoline
- 9.1.3. Solar
- 9.2. Market Analysis, Insights and Forecast - by Application Type
- 9.2.1. Personal
- 9.2.2. Commercial
- 9.3. Market Analysis, Insights and Forecast - by Vehicle Type
- 9.3.1. Quadricycle
- 9.3.2. Tricycle
- 9.1. Market Analysis, Insights and Forecast - by Power Source Type
- 10. North America Quadricycle and Tricycle Industry Analysis, Insights and Forecast, 2019-2031
- 10.1. Market Analysis, Insights and Forecast - By Country/Sub-region
- 10.1.1 United States
- 10.1.2 Canada
- 10.1.3 Rest of North America
- 11. Europe Quadricycle and Tricycle Industry Analysis, Insights and Forecast, 2019-2031
- 11.1. Market Analysis, Insights and Forecast - By Country/Sub-region
- 11.1.1 Germany
- 11.1.2 United Kingdom
- 11.1.3 France
- 11.1.4 Italy
- 11.1.5 Rest of Europe
- 12. Asia Pacific Quadricycle and Tricycle Industry Analysis, Insights and Forecast, 2019-2031
- 12.1. Market Analysis, Insights and Forecast - By Country/Sub-region
- 12.1.1 China
- 12.1.2 Japan
- 12.1.3 India
- 12.1.4 South Korea
- 12.1.5 Rest of Asia Pacific
- 13. Rest of the World Quadricycle and Tricycle Industry Analysis, Insights and Forecast, 2019-2031
- 13.1. Market Analysis, Insights and Forecast - By Country/Sub-region
- 13.1.1 Brazil
- 13.1.2 South Africa
- 13.1.3 United Arab Emirates
- 13.1.4 Other Countries
- 14. Competitive Analysis
- 14.1. Global Market Share Analysis 2024
- 14.2. Company Profiles
- 14.2.1 Bajaj Auto Ltd
- 14.2.1.1. Overview
- 14.2.1.2. Products
- 14.2.1.3. SWOT Analysis
- 14.2.1.4. Recent Developments
- 14.2.1.5. Financials (Based on Availability)
- 14.2.2 Electronio Wheels
- 14.2.2.1. Overview
- 14.2.2.2. Products
- 14.2.2.3. SWOT Analysis
- 14.2.2.4. Recent Developments
- 14.2.2.5. Financials (Based on Availability)
- 14.2.3 Groupe Renaul
- 14.2.3.1. Overview
- 14.2.3.2. Products
- 14.2.3.3. SWOT Analysis
- 14.2.3.4. Recent Developments
- 14.2.3.5. Financials (Based on Availability)
- 14.2.4 Worksman Cycles
- 14.2.4.1. Overview
- 14.2.4.2. Products
- 14.2.4.3. SWOT Analysis
- 14.2.4.4. Recent Developments
- 14.2.4.5. Financials (Based on Availability)
- 14.2.5 Bellier Automobiles
- 14.2.5.1. Overview
- 14.2.5.2. Products
- 14.2.5.3. SWOT Analysis
- 14.2.5.4. Recent Developments
- 14.2.5.5. Financials (Based on Availability)
- 14.2.6 Mahindra and Mahindra
- 14.2.6.1. Overview
- 14.2.6.2. Products
- 14.2.6.3. SWOT Analysis
- 14.2.6.4. Recent Developments
- 14.2.6.5. Financials (Based on Availability)
- 14.2.7 Light Foot Cycle
- 14.2.7.1. Overview
- 14.2.7.2. Products
- 14.2.7.3. SWOT Analysis
- 14.2.7.4. Recent Developments
- 14.2.7.5. Financials (Based on Availability)
- 14.2.8 Automobiles CHATENET
- 14.2.8.1. Overview
- 14.2.8.2. Products
- 14.2.8.3. SWOT Analysis
- 14.2.8.4. Recent Developments
- 14.2.8.5. Financials (Based on Availability)
- 14.2.9 Estrima SRL
- 14.2.9.1. Overview
- 14.2.9.2. Products
- 14.2.9.3. SWOT Analysis
- 14.2.9.4. Recent Developments
- 14.2.9.5. Financials (Based on Availability)
- 14.2.10 Daimus
- 14.2.10.1. Overview
- 14.2.10.2. Products
- 14.2.10.3. SWOT Analysis
- 14.2.10.4. Recent Developments
- 14.2.10.5. Financials (Based on Availability)
- 14.2.11 Ligier Group
- 14.2.11.1. Overview
- 14.2.11.2. Products
- 14.2.11.3. SWOT Analysis
- 14.2.11.4. Recent Developments
- 14.2.11.5. Financials (Based on Availability)
- 14.2.12 Aixam-Mega
- 14.2.12.1. Overview
- 14.2.12.2. Products
- 14.2.12.3. SWOT Analysis
- 14.2.12.4. Recent Developments
- 14.2.12.5. Financials (Based on Availability)
- 14.2.1 Bajaj Auto Ltd
List of Figures
- Figure 1: Global Quadricycle and Tricycle Industry Revenue Breakdown (Million, %) by Region 2024 & 2032
- Figure 2: North America Quadricycle and Tricycle Industry Revenue (Million), by Country 2024 & 2032
- Figure 3: North America Quadricycle and Tricycle Industry Revenue Share (%), by Country 2024 & 2032
- Figure 4: Europe Quadricycle and Tricycle Industry Revenue (Million), by Country 2024 & 2032
- Figure 5: Europe Quadricycle and Tricycle Industry Revenue Share (%), by Country 2024 & 2032
- Figure 6: Asia Pacific Quadricycle and Tricycle Industry Revenue (Million), by Country 2024 & 2032
- Figure 7: Asia Pacific Quadricycle and Tricycle Industry Revenue Share (%), by Country 2024 & 2032
- Figure 8: Rest of the World Quadricycle and Tricycle Industry Revenue (Million), by Country 2024 & 2032
- Figure 9: Rest of the World Quadricycle and Tricycle Industry Revenue Share (%), by Country 2024 & 2032
- Figure 10: North America Quadricycle and Tricycle Industry Revenue (Million), by Power Source Type 2024 & 2032
- Figure 11: North America Quadricycle and Tricycle Industry Revenue Share (%), by Power Source Type 2024 & 2032
- Figure 12: North America Quadricycle and Tricycle Industry Revenue (Million), by Application Type 2024 & 2032
- Figure 13: North America Quadricycle and Tricycle Industry Revenue Share (%), by Application Type 2024 & 2032
- Figure 14: North America Quadricycle and Tricycle Industry Revenue (Million), by Vehicle Type 2024 & 2032
- Figure 15: North America Quadricycle and Tricycle Industry Revenue Share (%), by Vehicle Type 2024 & 2032
- Figure 16: North America Quadricycle and Tricycle Industry Revenue (Million), by Country 2024 & 2032
- Figure 17: North America Quadricycle and Tricycle Industry Revenue Share (%), by Country 2024 & 2032
- Figure 18: Europe Quadricycle and Tricycle Industry Revenue (Million), by Power Source Type 2024 & 2032
- Figure 19: Europe Quadricycle and Tricycle Industry Revenue Share (%), by Power Source Type 2024 & 2032
- Figure 20: Europe Quadricycle and Tricycle Industry Revenue (Million), by Application Type 2024 & 2032
- Figure 21: Europe Quadricycle and Tricycle Industry Revenue Share (%), by Application Type 2024 & 2032
- Figure 22: Europe Quadricycle and Tricycle Industry Revenue (Million), by Vehicle Type 2024 & 2032
- Figure 23: Europe Quadricycle and Tricycle Industry Revenue Share (%), by Vehicle Type 2024 & 2032
- Figure 24: Europe Quadricycle and Tricycle Industry Revenue (Million), by Country 2024 & 2032
- Figure 25: Europe Quadricycle and Tricycle Industry Revenue Share (%), by Country 2024 & 2032
- Figure 26: Asia Pacific Quadricycle and Tricycle Industry Revenue (Million), by Power Source Type 2024 & 2032
- Figure 27: Asia Pacific Quadricycle and Tricycle Industry Revenue Share (%), by Power Source Type 2024 & 2032
- Figure 28: Asia Pacific Quadricycle and Tricycle Industry Revenue (Million), by Application Type 2024 & 2032
- Figure 29: Asia Pacific Quadricycle and Tricycle Industry Revenue Share (%), by Application Type 2024 & 2032
- Figure 30: Asia Pacific Quadricycle and Tricycle Industry Revenue (Million), by Vehicle Type 2024 & 2032
- Figure 31: Asia Pacific Quadricycle and Tricycle Industry Revenue Share (%), by Vehicle Type 2024 & 2032
- Figure 32: Asia Pacific Quadricycle and Tricycle Industry Revenue (Million), by Country 2024 & 2032
- Figure 33: Asia Pacific Quadricycle and Tricycle Industry Revenue Share (%), by Country 2024 & 2032
- Figure 34: Rest of the World Quadricycle and Tricycle Industry Revenue (Million), by Power Source Type 2024 & 2032
- Figure 35: Rest of the World Quadricycle and Tricycle Industry Revenue Share (%), by Power Source Type 2024 & 2032
- Figure 36: Rest of the World Quadricycle and Tricycle Industry Revenue (Million), by Application Type 2024 & 2032
- Figure 37: Rest of the World Quadricycle and Tricycle Industry Revenue Share (%), by Application Type 2024 & 2032
- Figure 38: Rest of the World Quadricycle and Tricycle Industry Revenue (Million), by Vehicle Type 2024 & 2032
- Figure 39: Rest of the World Quadricycle and Tricycle Industry Revenue Share (%), by Vehicle Type 2024 & 2032
- Figure 40: Rest of the World Quadricycle and Tricycle Industry Revenue (Million), by Country 2024 & 2032
- Figure 41: Rest of the World Quadricycle and Tricycle Industry Revenue Share (%), by Country 2024 & 2032
List of Tables
- Table 1: Global Quadricycle and Tricycle Industry Revenue Million Forecast, by Region 2019 & 2032
- Table 2: Global Quadricycle and Tricycle Industry Revenue Million Forecast, by Power Source Type 2019 & 2032
- Table 3: Global Quadricycle and Tricycle Industry Revenue Million Forecast, by Application Type 2019 & 2032
- Table 4: Global Quadricycle and Tricycle Industry Revenue Million Forecast, by Vehicle Type 2019 & 2032
- Table 5: Global Quadricycle and Tricycle Industry Revenue Million Forecast, by Region 2019 & 2032
- Table 6: Global Quadricycle and Tricycle Industry Revenue Million Forecast, by Country 2019 & 2032
- Table 7: United States Quadricycle and Tricycle Industry Revenue (Million) Forecast, by Application 2019 & 2032
- Table 8: Canada Quadricycle and Tricycle Industry Revenue (Million) Forecast, by Application 2019 & 2032
- Table 9: Rest of North America Quadricycle and Tricycle Industry Revenue (Million) Forecast, by Application 2019 & 2032
- Table 10: Global Quadricycle and Tricycle Industry Revenue Million Forecast, by Country 2019 & 2032
- Table 11: Germany Quadricycle and Tricycle Industry Revenue (Million) Forecast, by Application 2019 & 2032
- Table 12: United Kingdom Quadricycle and Tricycle Industry Revenue (Million) Forecast, by Application 2019 & 2032
- Table 13: France Quadricycle and Tricycle Industry Revenue (Million) Forecast, by Application 2019 & 2032
- Table 14: Italy Quadricycle and Tricycle Industry Revenue (Million) Forecast, by Application 2019 & 2032
- Table 15: Rest of Europe Quadricycle and Tricycle Industry Revenue (Million) Forecast, by Application 2019 & 2032
- Table 16: Global Quadricycle and Tricycle Industry Revenue Million Forecast, by Country 2019 & 2032
- Table 17: China Quadricycle and Tricycle Industry Revenue (Million) Forecast, by Application 2019 & 2032
- Table 18: Japan Quadricycle and Tricycle Industry Revenue (Million) Forecast, by Application 2019 & 2032
- Table 19: India Quadricycle and Tricycle Industry Revenue (Million) Forecast, by Application 2019 & 2032
- Table 20: South Korea Quadricycle and Tricycle Industry Revenue (Million) Forecast, by Application 2019 & 2032
- Table 21: Rest of Asia Pacific Quadricycle and Tricycle Industry Revenue (Million) Forecast, by Application 2019 & 2032
- Table 22: Global Quadricycle and Tricycle Industry Revenue Million Forecast, by Country 2019 & 2032
- Table 23: Brazil Quadricycle and Tricycle Industry Revenue (Million) Forecast, by Application 2019 & 2032
- Table 24: South Africa Quadricycle and Tricycle Industry Revenue (Million) Forecast, by Application 2019 & 2032
- Table 25: United Arab Emirates Quadricycle and Tricycle Industry Revenue (Million) Forecast, by Application 2019 & 2032
- Table 26: Other Countries Quadricycle and Tricycle Industry Revenue (Million) Forecast, by Application 2019 & 2032
- Table 27: Global Quadricycle and Tricycle Industry Revenue Million Forecast, by Power Source Type 2019 & 2032
- Table 28: Global Quadricycle and Tricycle Industry Revenue Million Forecast, by Application Type 2019 & 2032
- Table 29: Global Quadricycle and Tricycle Industry Revenue Million Forecast, by Vehicle Type 2019 & 2032
- Table 30: Global Quadricycle and Tricycle Industry Revenue Million Forecast, by Country 2019 & 2032
- Table 31: United States Quadricycle and Tricycle Industry Revenue (Million) Forecast, by Application 2019 & 2032
- Table 32: Canada Quadricycle and Tricycle Industry Revenue (Million) Forecast, by Application 2019 & 2032
- Table 33: Rest of North America Quadricycle and Tricycle Industry Revenue (Million) Forecast, by Application 2019 & 2032
- Table 34: Global Quadricycle and Tricycle Industry Revenue Million Forecast, by Power Source Type 2019 & 2032
- Table 35: Global Quadricycle and Tricycle Industry Revenue Million Forecast, by Application Type 2019 & 2032
- Table 36: Global Quadricycle and Tricycle Industry Revenue Million Forecast, by Vehicle Type 2019 & 2032
- Table 37: Global Quadricycle and Tricycle Industry Revenue Million Forecast, by Country 2019 & 2032
- Table 38: Germany Quadricycle and Tricycle Industry Revenue (Million) Forecast, by Application 2019 & 2032
- Table 39: United Kingdom Quadricycle and Tricycle Industry Revenue (Million) Forecast, by Application 2019 & 2032
- Table 40: France Quadricycle and Tricycle Industry Revenue (Million) Forecast, by Application 2019 & 2032
- Table 41: Italy Quadricycle and Tricycle Industry Revenue (Million) Forecast, by Application 2019 & 2032
- Table 42: Rest of Europe Quadricycle and Tricycle Industry Revenue (Million) Forecast, by Application 2019 & 2032
- Table 43: Global Quadricycle and Tricycle Industry Revenue Million Forecast, by Power Source Type 2019 & 2032
- Table 44: Global Quadricycle and Tricycle Industry Revenue Million Forecast, by Application Type 2019 & 2032
- Table 45: Global Quadricycle and Tricycle Industry Revenue Million Forecast, by Vehicle Type 2019 & 2032
- Table 46: Global Quadricycle and Tricycle Industry Revenue Million Forecast, by Country 2019 & 2032
- Table 47: China Quadricycle and Tricycle Industry Revenue (Million) Forecast, by Application 2019 & 2032
- Table 48: Japan Quadricycle and Tricycle Industry Revenue (Million) Forecast, by Application 2019 & 2032
- Table 49: India Quadricycle and Tricycle Industry Revenue (Million) Forecast, by Application 2019 & 2032
- Table 50: South Korea Quadricycle and Tricycle Industry Revenue (Million) Forecast, by Application 2019 & 2032
- Table 51: Rest of Asia Pacific Quadricycle and Tricycle Industry Revenue (Million) Forecast, by Application 2019 & 2032
- Table 52: Global Quadricycle and Tricycle Industry Revenue Million Forecast, by Power Source Type 2019 & 2032
- Table 53: Global Quadricycle and Tricycle Industry Revenue Million Forecast, by Application Type 2019 & 2032
- Table 54: Global Quadricycle and Tricycle Industry Revenue Million Forecast, by Vehicle Type 2019 & 2032
- Table 55: Global Quadricycle and Tricycle Industry Revenue Million Forecast, by Country 2019 & 2032
- Table 56: Brazil Quadricycle and Tricycle Industry Revenue (Million) Forecast, by Application 2019 & 2032
- Table 57: South Africa Quadricycle and Tricycle Industry Revenue (Million) Forecast, by Application 2019 & 2032
- Table 58: United Arab Emirates Quadricycle and Tricycle Industry Revenue (Million) Forecast, by Application 2019 & 2032
- Table 59: Other Countries Quadricycle and Tricycle Industry Revenue (Million) Forecast, by Application 2019 & 2032
Frequently Asked Questions
1. What is the projected Compound Annual Growth Rate (CAGR) of the Quadricycle and Tricycle Industry?
The projected CAGR is approximately 10.84%.
2. Which companies are prominent players in the Quadricycle and Tricycle Industry?
Key companies in the market include Bajaj Auto Ltd, Electronio Wheels, Groupe Renaul, Worksman Cycles, Bellier Automobiles, Mahindra and Mahindra, Light Foot Cycle, Automobiles CHATENET, Estrima SRL, Daimus, Ligier Group, Aixam-Mega.
3. What are the main segments of the Quadricycle and Tricycle Industry?
The market segments include Power Source Type, Application Type, Vehicle Type.
4. Can you provide details about the market size?
The market size is estimated to be USD 8.20 Million as of 2022.
5. What are some drivers contributing to market growth?
Integration With Telematics And Fleet Management Systems; Others.
6. What are the notable trends driving market growth?
Growing Adoption of Quadricycles Expected to Enhance Demand in the Market.
7. Are there any restraints impacting market growth?
The Initial Costs Associated With Purchasing And Installing ELD Systems is High; Others.
8. Can you provide examples of recent developments in the market?
N/A
9. What pricing options are available for accessing the report?
Pricing options include single-user, multi-user, and enterprise licenses priced at USD 4750, USD 5250, and USD 8750 respectively.
10. Is the market size provided in terms of value or volume?
The market size is provided in terms of value, measured in Million.
11. Are there any specific market keywords associated with the report?
Yes, the market keyword associated with the report is "Quadricycle and Tricycle Industry," which aids in identifying and referencing the specific market segment covered.
12. How do I determine which pricing option suits my needs best?
The pricing options vary based on user requirements and access needs. Individual users may opt for single-user licenses, while businesses requiring broader access may choose multi-user or enterprise licenses for cost-effective access to the report.
13. Are there any additional resources or data provided in the Quadricycle and Tricycle Industry report?
While the report offers comprehensive insights, it's advisable to review the specific contents or supplementary materials provided to ascertain if additional resources or data are available.
14. How can I stay updated on further developments or reports in the Quadricycle and Tricycle Industry?
To stay informed about further developments, trends, and reports in the Quadricycle and Tricycle Industry, consider subscribing to industry newsletters, following relevant companies and organizations, or regularly checking reputable industry news sources and publications.
Methodology
Step 1 - Identification of Relevant Samples Size from Population Database


Step 2 - Approaches for Defining Global Market Size (Value, Volume* & Price*)

Note*: In applicable scenarios
Step 3 - Data Sources
Primary Research
- Web Analytics
- Survey Reports
- Research Institute
- Latest Research Reports
- Opinion Leaders
Secondary Research
- Annual Reports
- White Paper
- Latest Press Release
- Industry Association
- Paid Database
- Investor Presentations

Step 4 - Data Triangulation
Involves using different sources of information in order to increase the validity of a study
These sources are likely to be stakeholders in a program - participants, other researchers, program staff, other community members, and so on.
Then we put all data in single framework & apply various statistical tools to find out the dynamic on the market.
During the analysis stage, feedback from the stakeholder groups would be compared to determine areas of agreement as well as areas of divergence


