
Key Insights
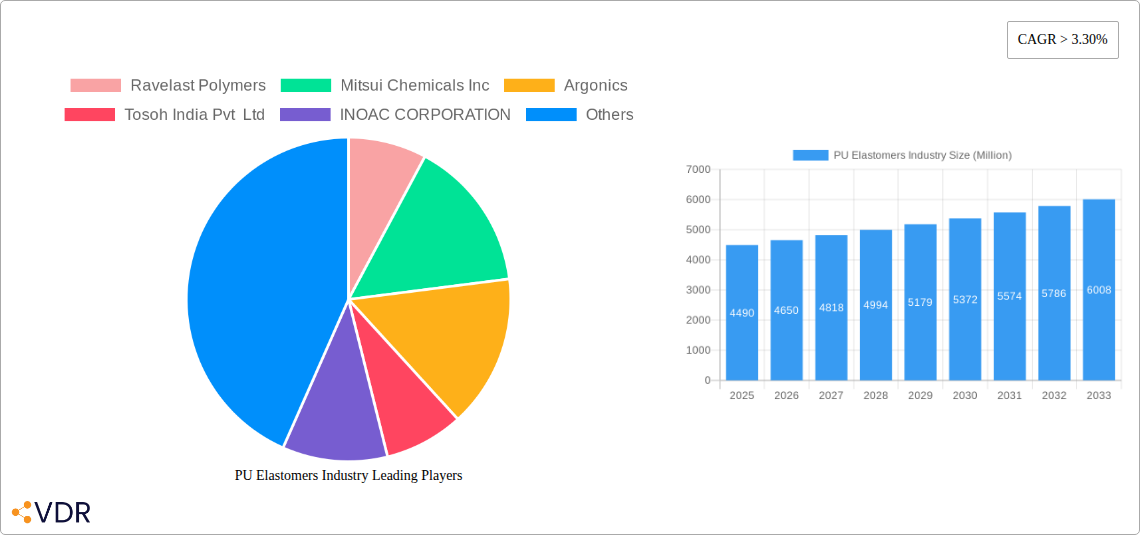
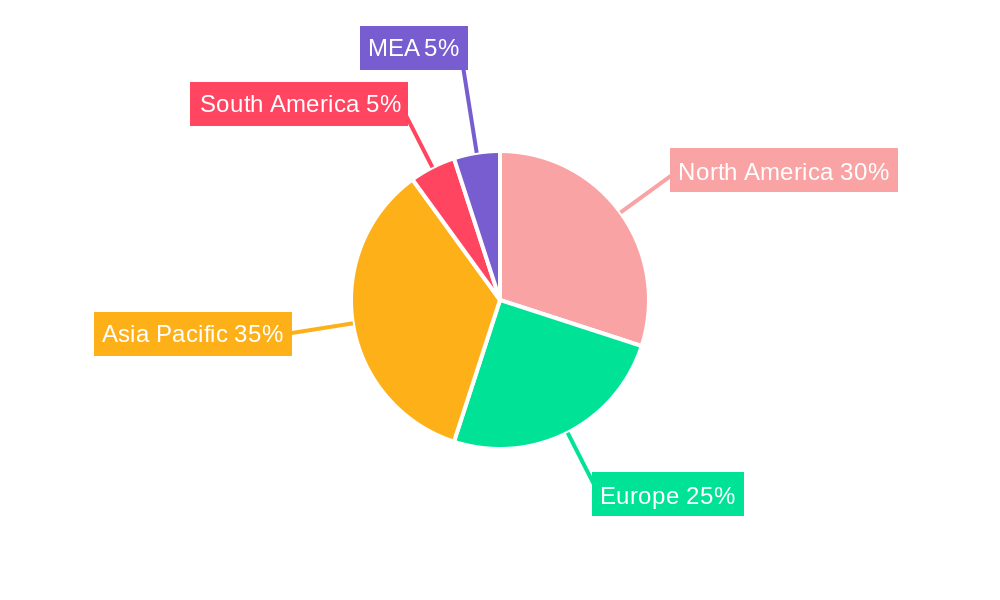
The global Polyurethane (PU) Elastomers market, valued at $4.49 billion in 2025, is projected to experience robust growth, driven by a Compound Annual Growth Rate (CAGR) exceeding 3.30% from 2025 to 2033. This expansion is fueled by increasing demand across diverse sectors. The automotive and transportation industries are major contributors, leveraging PU elastomers' superior durability, flexibility, and shock absorption in various components like seals, bumpers, and bushings. The footwear industry also significantly contributes, utilizing the material's comfort and resilience in shoe soles and midsoles. Growth within the industrial machinery sector is further propelled by the need for high-performance components in demanding applications. While the building and construction, mining equipment, and medical sectors represent smaller segments, their contributions are expected to increase steadily, driven by innovation and the development of specialized PU elastomers catering to unique material requirements. The thermoplastic segment currently holds a larger market share than thermosets, owing to its ease of processing and recyclability, although the thermoset segment is expected to see faster growth due to its superior performance characteristics in high-temperature and high-stress applications. Leading companies like Huntsman International LLC, Covestro AG, and Dow are at the forefront of innovation, driving market expansion through advancements in material properties and sustainable manufacturing processes. Competition is fierce, and companies are focusing on product differentiation, partnerships, and acquisitions to gain a competitive edge. Geographic distribution reveals significant market shares across North America, Europe, and Asia-Pacific, with China and the United States representing key regional markets.
The market's growth trajectory is, however, subject to certain restraints. Fluctuations in raw material prices, particularly isocyanates and polyols, can impact profitability. Furthermore, environmental concerns regarding the production and disposal of PU elastomers are prompting the development of more sustainable alternatives and recycling technologies. Addressing these challenges through sustainable manufacturing practices and lifecycle assessments will be crucial for long-term market success. The continuous research and development of new PU elastomer formulations with enhanced properties, such as improved abrasion resistance, temperature stability, and biodegradability, will be key to shaping the future of this dynamic market. Companies are also focusing on developing specialized PU elastomers tailored to specific niche applications, further fueling market growth and differentiation. The ongoing trend towards lightweighting in various industries also presents a significant opportunity for PU elastomers due to their excellent strength-to-weight ratio.
PU Elastomers Industry Market Report: 2019-2033
This comprehensive report provides an in-depth analysis of the PU Elastomers industry, encompassing market dynamics, growth trends, regional insights, product landscape, and key players. With a study period spanning 2019-2033, a base year of 2025, and a forecast period of 2025-2033, this report is an invaluable resource for industry professionals, investors, and strategic decision-makers. The report's analysis covers both parent and child markets, providing a granular understanding of the PU Elastomers landscape. Market values are presented in million units.
PU Elastomers Industry Market Dynamics & Structure
The PU Elastomers market is characterized by moderate concentration, with several major players holding significant market share. Technological innovation, particularly in material science and processing techniques, is a key driver, alongside evolving regulatory frameworks concerning environmental impact and safety. The industry faces competition from alternative materials, impacting market share dynamics. End-user demographics, particularly within the automotive and construction sectors, significantly influence demand. M&A activity plays a crucial role in shaping the competitive landscape. For instance, the recent sale of SK pucore highlights the industry's dynamic nature.
- Market Concentration: Moderately concentrated, with top 5 players holding approximately xx% market share in 2024.
- Technological Innovation: Focus on sustainable and high-performance materials, driving product differentiation.
- Regulatory Frameworks: Increasingly stringent environmental regulations influencing manufacturing processes.
- Competitive Substitutes: Competition from other elastomers and plastics impacting market growth.
- End-User Demographics: Growth driven by automotive, construction, and footwear sectors.
- M&A Trends: Recent deals signal consolidation and strategic repositioning within the industry. xx M&A deals recorded between 2019-2024, with a total value of xx million USD.
PU Elastomers Industry Growth Trends & Insights
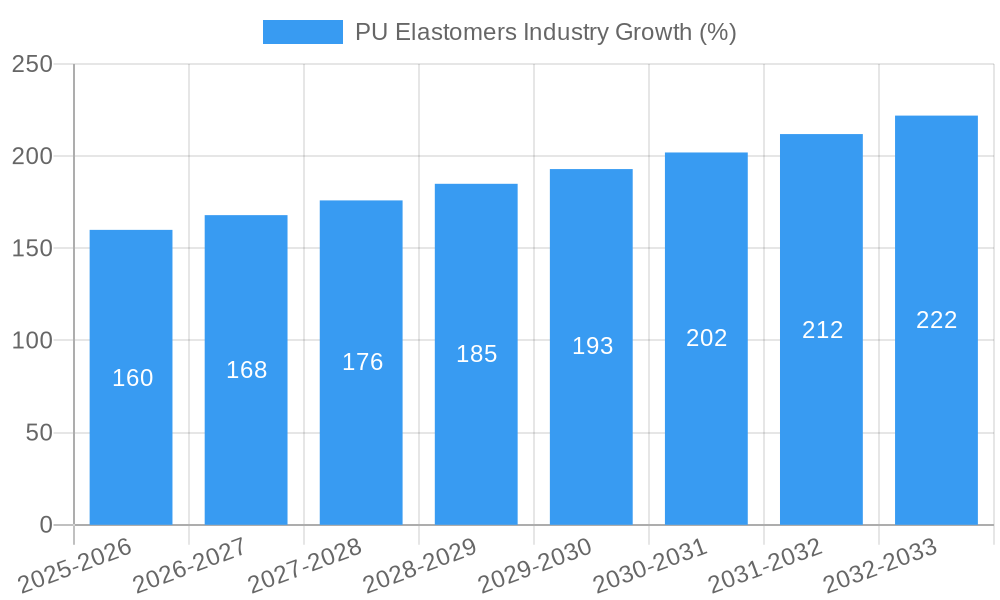
The PU Elastomers market exhibited a CAGR of xx% during the historical period (2019-2024), reaching a market size of xx million units in 2024. This growth is attributed to factors such as increasing demand from key end-use sectors, technological advancements leading to improved product performance, and favorable economic conditions in certain regions. The forecast period (2025-2033) projects continued growth, with a projected CAGR of xx%, driven by factors such as increasing adoption in emerging applications and expanding global infrastructure development. Market penetration in developing economies presents a significant growth opportunity. Technological disruptions, such as the development of bio-based PU elastomers, will further shape market dynamics. Consumer preference for sustainable and high-performance materials is influencing product development and market trends.
Dominant Regions, Countries, or Segments in PU Elastomers Industry
The Automotive & Transportation segment currently dominates the PU Elastomers market, holding approximately xx% of the market share in 2024, driven by strong demand for lightweight, durable, and versatile materials in vehicle manufacturing. Asia-Pacific is the leading region, accounting for xx% of the global market in 2024, primarily due to robust growth in the automotive and industrial sectors within countries like China and India. The Thermoplastic segment holds a larger market share compared to Thermoset, reflecting the increasing demand for recyclable and easily processable materials.
- Key Drivers for Automotive & Transportation: Rising vehicle production, increasing demand for lightweight vehicles, and stringent emission regulations.
- Key Drivers for Asia-Pacific: Rapid industrialization, rising disposable incomes, and favorable government policies.
- Key Drivers for Thermoplastic Segment: Ease of processing, recyclability, and cost-effectiveness.
PU Elastomers Industry Product Landscape
PU elastomers are witnessing significant product innovations, focusing on enhanced properties such as improved abrasion resistance, flexibility, and chemical resistance. New formulations are being developed to cater to specific application requirements, such as high-temperature resistance for automotive components or biocompatibility for medical devices. Technological advancements in manufacturing processes are leading to improved efficiency and reduced costs. Unique selling propositions include superior performance characteristics, tailored material properties, and sustainable production methods.
Key Drivers, Barriers & Challenges in PU Elastomers Industry
Key Drivers:
- Growing demand from automotive, construction, and footwear sectors.
- Advancements in material science leading to improved product performance.
- Increasing adoption of PU elastomers in emerging applications.
Key Challenges:
- Fluctuations in raw material prices impacting profitability.
- Stringent environmental regulations requiring process modifications.
- Intense competition from alternative materials. This is estimated to reduce market growth by xx% by 2033.
Emerging Opportunities in PU Elastomers Industry
- Expanding applications in renewable energy technologies (e.g., wind turbine components).
- Growing demand for bio-based and sustainable PU elastomers.
- Development of high-performance materials for specialized applications (e.g., aerospace).
Growth Accelerators in the PU Elastomers Industry Industry
Technological breakthroughs in material science are driving innovation, enabling the development of high-performance, sustainable, and cost-effective PU elastomers. Strategic partnerships between material suppliers and end-use manufacturers are streamlining supply chains and fostering product development. Expansion into untapped markets, particularly in developing economies, is creating significant growth opportunities.
Key Players Shaping the PU Elastomers Industry Market
- Ravelast Polymers
- Mitsui Chemicals Inc
- Argonics
- Tosoh India Pvt Ltd
- INOAC CORPORATION
- American Urethane Inc
- LANXESS
- Weaver Industries Inc
- Huntsman International LLC
- Wanhua
- Dow
- The Lubrizol Corporation
- Unicast Engineered Urethane Products
- Covestro AG
Notable Milestones in PU Elastomers Industry Sector
- October 2023: SKC sold its 100% shares of SK pucore to Glenwood Private Equity for USD 304.1 million, signaling industry consolidation and a shift in strategic focus.
- August 2023: Covestro AG commenced production at its new Shanghai plant, representing a significant investment in expanding production capacity.
- July 2023: Nordmann secured distribution rights for Era Polymers' polyurethane elastomers across several European countries, expanding market access for the Australian producer.
In-Depth PU Elastomers Industry Market Outlook
The PU Elastomers market is poised for continued growth, driven by technological advancements, expanding applications, and increasing demand from key end-use sectors. Strategic partnerships and investments in new production capacities will further fuel market expansion. Companies focused on developing sustainable and high-performance materials will be best positioned to capitalize on future growth opportunities. The market's potential for innovation and expansion across diverse applications promises a dynamic and expanding landscape in the coming years.
PU Elastomers Industry Segmentation
-
1. Type
- 1.1. Thermoplastic
- 1.2. Thermoset
-
2. Application
- 2.1. Footwear
- 2.2. Industrial Machinery
- 2.3. Automotive & Transportation
- 2.4. Others (
PU Elastomers Industry Segmentation By Geography
-
1. Asia Pacific
- 1.1. China
- 1.2. India
- 1.3. Japan
- 1.4. South Korea
- 1.5. Rest of Asia Pacific
-
2. North America
- 2.1. United States
- 2.2. Canada
- 2.3. Mexico
-
3. Europe
- 3.1. Germany
- 3.2. United Kingdom
- 3.3. France
- 3.4. Italy
- 3.5. Rest of Europe
-
4. South America
- 4.1. Brazil
- 4.2. Argentina
- 4.3. Rest of South America
-
5. Middle East and Africa
- 5.1. Saudi Arabia
- 5.2. South Africa
- 5.3. Rest of Middle East and Africa
PU Elastomers Industry REPORT HIGHLIGHTS
| Aspects | Details |
|---|---|
| Study Period | 2019-2033 |
| Base Year | 2024 |
| Estimated Year | 2025 |
| Forecast Period | 2025-2033 |
| Historical Period | 2019-2024 |
| Growth Rate | CAGR of > 3.30% from 2019-2033 |
| Segmentation |
|
Table of Contents
- 1. Introduction
- 1.1. Research Scope
- 1.2. Market Segmentation
- 1.3. Research Methodology
- 1.4. Definitions and Assumptions
- 2. Executive Summary
- 2.1. Introduction
- 3. Market Dynamics
- 3.1. Introduction
- 3.2. Market Drivers
- 3.2.1. Increasing Demand from Footwear Industry; Growing Application in Automotive and Consumer Goods Industries; Other Drivers
- 3.3. Market Restrains
- 3.3.1. Lower Durability of Polyurethane Elastomers; Environmental Concerns Caused by Polyurethane
- 3.4. Market Trends
- 3.4.1. Footwear Industry Representing the Fastest Growing Market
- 4. Market Factor Analysis
- 4.1. Porters Five Forces
- 4.2. Supply/Value Chain
- 4.3. PESTEL analysis
- 4.4. Market Entropy
- 4.5. Patent/Trademark Analysis
- 5. Global PU Elastomers Industry Analysis, Insights and Forecast, 2019-2031
- 5.1. Market Analysis, Insights and Forecast - by Type
- 5.1.1. Thermoplastic
- 5.1.2. Thermoset
- 5.2. Market Analysis, Insights and Forecast - by Application
- 5.2.1. Footwear
- 5.2.2. Industrial Machinery
- 5.2.3. Automotive & Transportation
- 5.2.4. Others (
- 5.3. Market Analysis, Insights and Forecast - by Region
- 5.3.1. Asia Pacific
- 5.3.2. North America
- 5.3.3. Europe
- 5.3.4. South America
- 5.3.5. Middle East and Africa
- 5.1. Market Analysis, Insights and Forecast - by Type
- 6. Asia Pacific PU Elastomers Industry Analysis, Insights and Forecast, 2019-2031
- 6.1. Market Analysis, Insights and Forecast - by Type
- 6.1.1. Thermoplastic
- 6.1.2. Thermoset
- 6.2. Market Analysis, Insights and Forecast - by Application
- 6.2.1. Footwear
- 6.2.2. Industrial Machinery
- 6.2.3. Automotive & Transportation
- 6.2.4. Others (
- 6.1. Market Analysis, Insights and Forecast - by Type
- 7. North America PU Elastomers Industry Analysis, Insights and Forecast, 2019-2031
- 7.1. Market Analysis, Insights and Forecast - by Type
- 7.1.1. Thermoplastic
- 7.1.2. Thermoset
- 7.2. Market Analysis, Insights and Forecast - by Application
- 7.2.1. Footwear
- 7.2.2. Industrial Machinery
- 7.2.3. Automotive & Transportation
- 7.2.4. Others (
- 7.1. Market Analysis, Insights and Forecast - by Type
- 8. Europe PU Elastomers Industry Analysis, Insights and Forecast, 2019-2031
- 8.1. Market Analysis, Insights and Forecast - by Type
- 8.1.1. Thermoplastic
- 8.1.2. Thermoset
- 8.2. Market Analysis, Insights and Forecast - by Application
- 8.2.1. Footwear
- 8.2.2. Industrial Machinery
- 8.2.3. Automotive & Transportation
- 8.2.4. Others (
- 8.1. Market Analysis, Insights and Forecast - by Type
- 9. South America PU Elastomers Industry Analysis, Insights and Forecast, 2019-2031
- 9.1. Market Analysis, Insights and Forecast - by Type
- 9.1.1. Thermoplastic
- 9.1.2. Thermoset
- 9.2. Market Analysis, Insights and Forecast - by Application
- 9.2.1. Footwear
- 9.2.2. Industrial Machinery
- 9.2.3. Automotive & Transportation
- 9.2.4. Others (
- 9.1. Market Analysis, Insights and Forecast - by Type
- 10. Middle East and Africa PU Elastomers Industry Analysis, Insights and Forecast, 2019-2031
- 10.1. Market Analysis, Insights and Forecast - by Type
- 10.1.1. Thermoplastic
- 10.1.2. Thermoset
- 10.2. Market Analysis, Insights and Forecast - by Application
- 10.2.1. Footwear
- 10.2.2. Industrial Machinery
- 10.2.3. Automotive & Transportation
- 10.2.4. Others (
- 10.1. Market Analysis, Insights and Forecast - by Type
- 11. North America PU Elastomers Industry Analysis, Insights and Forecast, 2019-2031
- 11.1. Market Analysis, Insights and Forecast - By Country/Sub-region
- 11.1.1 United States
- 11.1.2 Canada
- 11.1.3 Mexico
- 12. Europe PU Elastomers Industry Analysis, Insights and Forecast, 2019-2031
- 12.1. Market Analysis, Insights and Forecast - By Country/Sub-region
- 12.1.1 Germany
- 12.1.2 France
- 12.1.3 Italy
- 12.1.4 United Kingdom
- 12.1.5 Netherlands
- 12.1.6 Rest of Europe
- 13. Asia Pacific PU Elastomers Industry Analysis, Insights and Forecast, 2019-2031
- 13.1. Market Analysis, Insights and Forecast - By Country/Sub-region
- 13.1.1 China
- 13.1.2 Japan
- 13.1.3 India
- 13.1.4 South Korea
- 13.1.5 Taiwan
- 13.1.6 Australia
- 13.1.7 Rest of Asia-Pacific
- 14. South America PU Elastomers Industry Analysis, Insights and Forecast, 2019-2031
- 14.1. Market Analysis, Insights and Forecast - By Country/Sub-region
- 14.1.1 Brazil
- 14.1.2 Argentina
- 14.1.3 Rest of South America
- 15. MEA PU Elastomers Industry Analysis, Insights and Forecast, 2019-2031
- 15.1. Market Analysis, Insights and Forecast - By Country/Sub-region
- 15.1.1 Middle East
- 15.1.2 Africa
- 16. Competitive Analysis
- 16.1. Global Market Share Analysis 2024
- 16.2. Company Profiles
- 16.2.1 Ravelast Polymers
- 16.2.1.1. Overview
- 16.2.1.2. Products
- 16.2.1.3. SWOT Analysis
- 16.2.1.4. Recent Developments
- 16.2.1.5. Financials (Based on Availability)
- 16.2.2 Mitsui Chemicals Inc
- 16.2.2.1. Overview
- 16.2.2.2. Products
- 16.2.2.3. SWOT Analysis
- 16.2.2.4. Recent Developments
- 16.2.2.5. Financials (Based on Availability)
- 16.2.3 Argonics
- 16.2.3.1. Overview
- 16.2.3.2. Products
- 16.2.3.3. SWOT Analysis
- 16.2.3.4. Recent Developments
- 16.2.3.5. Financials (Based on Availability)
- 16.2.4 Tosoh India Pvt Ltd
- 16.2.4.1. Overview
- 16.2.4.2. Products
- 16.2.4.3. SWOT Analysis
- 16.2.4.4. Recent Developments
- 16.2.4.5. Financials (Based on Availability)
- 16.2.5 INOAC CORPORATION
- 16.2.5.1. Overview
- 16.2.5.2. Products
- 16.2.5.3. SWOT Analysis
- 16.2.5.4. Recent Developments
- 16.2.5.5. Financials (Based on Availability)
- 16.2.6 American Urethane Inc
- 16.2.6.1. Overview
- 16.2.6.2. Products
- 16.2.6.3. SWOT Analysis
- 16.2.6.4. Recent Developments
- 16.2.6.5. Financials (Based on Availability)
- 16.2.7 LANXESS
- 16.2.7.1. Overview
- 16.2.7.2. Products
- 16.2.7.3. SWOT Analysis
- 16.2.7.4. Recent Developments
- 16.2.7.5. Financials (Based on Availability)
- 16.2.8 Weaver Industries Inc
- 16.2.8.1. Overview
- 16.2.8.2. Products
- 16.2.8.3. SWOT Analysis
- 16.2.8.4. Recent Developments
- 16.2.8.5. Financials (Based on Availability)
- 16.2.9 Huntsman International LLC
- 16.2.9.1. Overview
- 16.2.9.2. Products
- 16.2.9.3. SWOT Analysis
- 16.2.9.4. Recent Developments
- 16.2.9.5. Financials (Based on Availability)
- 16.2.10 Wanhua
- 16.2.10.1. Overview
- 16.2.10.2. Products
- 16.2.10.3. SWOT Analysis
- 16.2.10.4. Recent Developments
- 16.2.10.5. Financials (Based on Availability)
- 16.2.11 Dow
- 16.2.11.1. Overview
- 16.2.11.2. Products
- 16.2.11.3. SWOT Analysis
- 16.2.11.4. Recent Developments
- 16.2.11.5. Financials (Based on Availability)
- 16.2.12 The Lubrizol Corporation
- 16.2.12.1. Overview
- 16.2.12.2. Products
- 16.2.12.3. SWOT Analysis
- 16.2.12.4. Recent Developments
- 16.2.12.5. Financials (Based on Availability)
- 16.2.13 Unicast Engineered Urethane Products
- 16.2.13.1. Overview
- 16.2.13.2. Products
- 16.2.13.3. SWOT Analysis
- 16.2.13.4. Recent Developments
- 16.2.13.5. Financials (Based on Availability)
- 16.2.14 Covestro AG
- 16.2.14.1. Overview
- 16.2.14.2. Products
- 16.2.14.3. SWOT Analysis
- 16.2.14.4. Recent Developments
- 16.2.14.5. Financials (Based on Availability)
- 16.2.1 Ravelast Polymers
List of Figures
- Figure 1: Global PU Elastomers Industry Revenue Breakdown (Million, %) by Region 2024 & 2032
- Figure 2: Global PU Elastomers Industry Volume Breakdown (K Tons, %) by Region 2024 & 2032
- Figure 3: North America PU Elastomers Industry Revenue (Million), by Country 2024 & 2032
- Figure 4: North America PU Elastomers Industry Volume (K Tons), by Country 2024 & 2032
- Figure 5: North America PU Elastomers Industry Revenue Share (%), by Country 2024 & 2032
- Figure 6: North America PU Elastomers Industry Volume Share (%), by Country 2024 & 2032
- Figure 7: Europe PU Elastomers Industry Revenue (Million), by Country 2024 & 2032
- Figure 8: Europe PU Elastomers Industry Volume (K Tons), by Country 2024 & 2032
- Figure 9: Europe PU Elastomers Industry Revenue Share (%), by Country 2024 & 2032
- Figure 10: Europe PU Elastomers Industry Volume Share (%), by Country 2024 & 2032
- Figure 11: Asia Pacific PU Elastomers Industry Revenue (Million), by Country 2024 & 2032
- Figure 12: Asia Pacific PU Elastomers Industry Volume (K Tons), by Country 2024 & 2032
- Figure 13: Asia Pacific PU Elastomers Industry Revenue Share (%), by Country 2024 & 2032
- Figure 14: Asia Pacific PU Elastomers Industry Volume Share (%), by Country 2024 & 2032
- Figure 15: South America PU Elastomers Industry Revenue (Million), by Country 2024 & 2032
- Figure 16: South America PU Elastomers Industry Volume (K Tons), by Country 2024 & 2032
- Figure 17: South America PU Elastomers Industry Revenue Share (%), by Country 2024 & 2032
- Figure 18: South America PU Elastomers Industry Volume Share (%), by Country 2024 & 2032
- Figure 19: MEA PU Elastomers Industry Revenue (Million), by Country 2024 & 2032
- Figure 20: MEA PU Elastomers Industry Volume (K Tons), by Country 2024 & 2032
- Figure 21: MEA PU Elastomers Industry Revenue Share (%), by Country 2024 & 2032
- Figure 22: MEA PU Elastomers Industry Volume Share (%), by Country 2024 & 2032
- Figure 23: Asia Pacific PU Elastomers Industry Revenue (Million), by Type 2024 & 2032
- Figure 24: Asia Pacific PU Elastomers Industry Volume (K Tons), by Type 2024 & 2032
- Figure 25: Asia Pacific PU Elastomers Industry Revenue Share (%), by Type 2024 & 2032
- Figure 26: Asia Pacific PU Elastomers Industry Volume Share (%), by Type 2024 & 2032
- Figure 27: Asia Pacific PU Elastomers Industry Revenue (Million), by Application 2024 & 2032
- Figure 28: Asia Pacific PU Elastomers Industry Volume (K Tons), by Application 2024 & 2032
- Figure 29: Asia Pacific PU Elastomers Industry Revenue Share (%), by Application 2024 & 2032
- Figure 30: Asia Pacific PU Elastomers Industry Volume Share (%), by Application 2024 & 2032
- Figure 31: Asia Pacific PU Elastomers Industry Revenue (Million), by Country 2024 & 2032
- Figure 32: Asia Pacific PU Elastomers Industry Volume (K Tons), by Country 2024 & 2032
- Figure 33: Asia Pacific PU Elastomers Industry Revenue Share (%), by Country 2024 & 2032
- Figure 34: Asia Pacific PU Elastomers Industry Volume Share (%), by Country 2024 & 2032
- Figure 35: North America PU Elastomers Industry Revenue (Million), by Type 2024 & 2032
- Figure 36: North America PU Elastomers Industry Volume (K Tons), by Type 2024 & 2032
- Figure 37: North America PU Elastomers Industry Revenue Share (%), by Type 2024 & 2032
- Figure 38: North America PU Elastomers Industry Volume Share (%), by Type 2024 & 2032
- Figure 39: North America PU Elastomers Industry Revenue (Million), by Application 2024 & 2032
- Figure 40: North America PU Elastomers Industry Volume (K Tons), by Application 2024 & 2032
- Figure 41: North America PU Elastomers Industry Revenue Share (%), by Application 2024 & 2032
- Figure 42: North America PU Elastomers Industry Volume Share (%), by Application 2024 & 2032
- Figure 43: North America PU Elastomers Industry Revenue (Million), by Country 2024 & 2032
- Figure 44: North America PU Elastomers Industry Volume (K Tons), by Country 2024 & 2032
- Figure 45: North America PU Elastomers Industry Revenue Share (%), by Country 2024 & 2032
- Figure 46: North America PU Elastomers Industry Volume Share (%), by Country 2024 & 2032
- Figure 47: Europe PU Elastomers Industry Revenue (Million), by Type 2024 & 2032
- Figure 48: Europe PU Elastomers Industry Volume (K Tons), by Type 2024 & 2032
- Figure 49: Europe PU Elastomers Industry Revenue Share (%), by Type 2024 & 2032
- Figure 50: Europe PU Elastomers Industry Volume Share (%), by Type 2024 & 2032
- Figure 51: Europe PU Elastomers Industry Revenue (Million), by Application 2024 & 2032
- Figure 52: Europe PU Elastomers Industry Volume (K Tons), by Application 2024 & 2032
- Figure 53: Europe PU Elastomers Industry Revenue Share (%), by Application 2024 & 2032
- Figure 54: Europe PU Elastomers Industry Volume Share (%), by Application 2024 & 2032
- Figure 55: Europe PU Elastomers Industry Revenue (Million), by Country 2024 & 2032
- Figure 56: Europe PU Elastomers Industry Volume (K Tons), by Country 2024 & 2032
- Figure 57: Europe PU Elastomers Industry Revenue Share (%), by Country 2024 & 2032
- Figure 58: Europe PU Elastomers Industry Volume Share (%), by Country 2024 & 2032
- Figure 59: South America PU Elastomers Industry Revenue (Million), by Type 2024 & 2032
- Figure 60: South America PU Elastomers Industry Volume (K Tons), by Type 2024 & 2032
- Figure 61: South America PU Elastomers Industry Revenue Share (%), by Type 2024 & 2032
- Figure 62: South America PU Elastomers Industry Volume Share (%), by Type 2024 & 2032
- Figure 63: South America PU Elastomers Industry Revenue (Million), by Application 2024 & 2032
- Figure 64: South America PU Elastomers Industry Volume (K Tons), by Application 2024 & 2032
- Figure 65: South America PU Elastomers Industry Revenue Share (%), by Application 2024 & 2032
- Figure 66: South America PU Elastomers Industry Volume Share (%), by Application 2024 & 2032
- Figure 67: South America PU Elastomers Industry Revenue (Million), by Country 2024 & 2032
- Figure 68: South America PU Elastomers Industry Volume (K Tons), by Country 2024 & 2032
- Figure 69: South America PU Elastomers Industry Revenue Share (%), by Country 2024 & 2032
- Figure 70: South America PU Elastomers Industry Volume Share (%), by Country 2024 & 2032
- Figure 71: Middle East and Africa PU Elastomers Industry Revenue (Million), by Type 2024 & 2032
- Figure 72: Middle East and Africa PU Elastomers Industry Volume (K Tons), by Type 2024 & 2032
- Figure 73: Middle East and Africa PU Elastomers Industry Revenue Share (%), by Type 2024 & 2032
- Figure 74: Middle East and Africa PU Elastomers Industry Volume Share (%), by Type 2024 & 2032
- Figure 75: Middle East and Africa PU Elastomers Industry Revenue (Million), by Application 2024 & 2032
- Figure 76: Middle East and Africa PU Elastomers Industry Volume (K Tons), by Application 2024 & 2032
- Figure 77: Middle East and Africa PU Elastomers Industry Revenue Share (%), by Application 2024 & 2032
- Figure 78: Middle East and Africa PU Elastomers Industry Volume Share (%), by Application 2024 & 2032
- Figure 79: Middle East and Africa PU Elastomers Industry Revenue (Million), by Country 2024 & 2032
- Figure 80: Middle East and Africa PU Elastomers Industry Volume (K Tons), by Country 2024 & 2032
- Figure 81: Middle East and Africa PU Elastomers Industry Revenue Share (%), by Country 2024 & 2032
- Figure 82: Middle East and Africa PU Elastomers Industry Volume Share (%), by Country 2024 & 2032
List of Tables
- Table 1: Global PU Elastomers Industry Revenue Million Forecast, by Region 2019 & 2032
- Table 2: Global PU Elastomers Industry Volume K Tons Forecast, by Region 2019 & 2032
- Table 3: Global PU Elastomers Industry Revenue Million Forecast, by Type 2019 & 2032
- Table 4: Global PU Elastomers Industry Volume K Tons Forecast, by Type 2019 & 2032
- Table 5: Global PU Elastomers Industry Revenue Million Forecast, by Application 2019 & 2032
- Table 6: Global PU Elastomers Industry Volume K Tons Forecast, by Application 2019 & 2032
- Table 7: Global PU Elastomers Industry Revenue Million Forecast, by Region 2019 & 2032
- Table 8: Global PU Elastomers Industry Volume K Tons Forecast, by Region 2019 & 2032
- Table 9: Global PU Elastomers Industry Revenue Million Forecast, by Country 2019 & 2032
- Table 10: Global PU Elastomers Industry Volume K Tons Forecast, by Country 2019 & 2032
- Table 11: United States PU Elastomers Industry Revenue (Million) Forecast, by Application 2019 & 2032
- Table 12: United States PU Elastomers Industry Volume (K Tons) Forecast, by Application 2019 & 2032
- Table 13: Canada PU Elastomers Industry Revenue (Million) Forecast, by Application 2019 & 2032
- Table 14: Canada PU Elastomers Industry Volume (K Tons) Forecast, by Application 2019 & 2032
- Table 15: Mexico PU Elastomers Industry Revenue (Million) Forecast, by Application 2019 & 2032
- Table 16: Mexico PU Elastomers Industry Volume (K Tons) Forecast, by Application 2019 & 2032
- Table 17: Global PU Elastomers Industry Revenue Million Forecast, by Country 2019 & 2032
- Table 18: Global PU Elastomers Industry Volume K Tons Forecast, by Country 2019 & 2032
- Table 19: Germany PU Elastomers Industry Revenue (Million) Forecast, by Application 2019 & 2032
- Table 20: Germany PU Elastomers Industry Volume (K Tons) Forecast, by Application 2019 & 2032
- Table 21: France PU Elastomers Industry Revenue (Million) Forecast, by Application 2019 & 2032
- Table 22: France PU Elastomers Industry Volume (K Tons) Forecast, by Application 2019 & 2032
- Table 23: Italy PU Elastomers Industry Revenue (Million) Forecast, by Application 2019 & 2032
- Table 24: Italy PU Elastomers Industry Volume (K Tons) Forecast, by Application 2019 & 2032
- Table 25: United Kingdom PU Elastomers Industry Revenue (Million) Forecast, by Application 2019 & 2032
- Table 26: United Kingdom PU Elastomers Industry Volume (K Tons) Forecast, by Application 2019 & 2032
- Table 27: Netherlands PU Elastomers Industry Revenue (Million) Forecast, by Application 2019 & 2032
- Table 28: Netherlands PU Elastomers Industry Volume (K Tons) Forecast, by Application 2019 & 2032
- Table 29: Rest of Europe PU Elastomers Industry Revenue (Million) Forecast, by Application 2019 & 2032
- Table 30: Rest of Europe PU Elastomers Industry Volume (K Tons) Forecast, by Application 2019 & 2032
- Table 31: Global PU Elastomers Industry Revenue Million Forecast, by Country 2019 & 2032
- Table 32: Global PU Elastomers Industry Volume K Tons Forecast, by Country 2019 & 2032
- Table 33: China PU Elastomers Industry Revenue (Million) Forecast, by Application 2019 & 2032
- Table 34: China PU Elastomers Industry Volume (K Tons) Forecast, by Application 2019 & 2032
- Table 35: Japan PU Elastomers Industry Revenue (Million) Forecast, by Application 2019 & 2032
- Table 36: Japan PU Elastomers Industry Volume (K Tons) Forecast, by Application 2019 & 2032
- Table 37: India PU Elastomers Industry Revenue (Million) Forecast, by Application 2019 & 2032
- Table 38: India PU Elastomers Industry Volume (K Tons) Forecast, by Application 2019 & 2032
- Table 39: South Korea PU Elastomers Industry Revenue (Million) Forecast, by Application 2019 & 2032
- Table 40: South Korea PU Elastomers Industry Volume (K Tons) Forecast, by Application 2019 & 2032
- Table 41: Taiwan PU Elastomers Industry Revenue (Million) Forecast, by Application 2019 & 2032
- Table 42: Taiwan PU Elastomers Industry Volume (K Tons) Forecast, by Application 2019 & 2032
- Table 43: Australia PU Elastomers Industry Revenue (Million) Forecast, by Application 2019 & 2032
- Table 44: Australia PU Elastomers Industry Volume (K Tons) Forecast, by Application 2019 & 2032
- Table 45: Rest of Asia-Pacific PU Elastomers Industry Revenue (Million) Forecast, by Application 2019 & 2032
- Table 46: Rest of Asia-Pacific PU Elastomers Industry Volume (K Tons) Forecast, by Application 2019 & 2032
- Table 47: Global PU Elastomers Industry Revenue Million Forecast, by Country 2019 & 2032
- Table 48: Global PU Elastomers Industry Volume K Tons Forecast, by Country 2019 & 2032
- Table 49: Brazil PU Elastomers Industry Revenue (Million) Forecast, by Application 2019 & 2032
- Table 50: Brazil PU Elastomers Industry Volume (K Tons) Forecast, by Application 2019 & 2032
- Table 51: Argentina PU Elastomers Industry Revenue (Million) Forecast, by Application 2019 & 2032
- Table 52: Argentina PU Elastomers Industry Volume (K Tons) Forecast, by Application 2019 & 2032
- Table 53: Rest of South America PU Elastomers Industry Revenue (Million) Forecast, by Application 2019 & 2032
- Table 54: Rest of South America PU Elastomers Industry Volume (K Tons) Forecast, by Application 2019 & 2032
- Table 55: Global PU Elastomers Industry Revenue Million Forecast, by Country 2019 & 2032
- Table 56: Global PU Elastomers Industry Volume K Tons Forecast, by Country 2019 & 2032
- Table 57: Middle East PU Elastomers Industry Revenue (Million) Forecast, by Application 2019 & 2032
- Table 58: Middle East PU Elastomers Industry Volume (K Tons) Forecast, by Application 2019 & 2032
- Table 59: Africa PU Elastomers Industry Revenue (Million) Forecast, by Application 2019 & 2032
- Table 60: Africa PU Elastomers Industry Volume (K Tons) Forecast, by Application 2019 & 2032
- Table 61: Global PU Elastomers Industry Revenue Million Forecast, by Type 2019 & 2032
- Table 62: Global PU Elastomers Industry Volume K Tons Forecast, by Type 2019 & 2032
- Table 63: Global PU Elastomers Industry Revenue Million Forecast, by Application 2019 & 2032
- Table 64: Global PU Elastomers Industry Volume K Tons Forecast, by Application 2019 & 2032
- Table 65: Global PU Elastomers Industry Revenue Million Forecast, by Country 2019 & 2032
- Table 66: Global PU Elastomers Industry Volume K Tons Forecast, by Country 2019 & 2032
- Table 67: China PU Elastomers Industry Revenue (Million) Forecast, by Application 2019 & 2032
- Table 68: China PU Elastomers Industry Volume (K Tons) Forecast, by Application 2019 & 2032
- Table 69: India PU Elastomers Industry Revenue (Million) Forecast, by Application 2019 & 2032
- Table 70: India PU Elastomers Industry Volume (K Tons) Forecast, by Application 2019 & 2032
- Table 71: Japan PU Elastomers Industry Revenue (Million) Forecast, by Application 2019 & 2032
- Table 72: Japan PU Elastomers Industry Volume (K Tons) Forecast, by Application 2019 & 2032
- Table 73: South Korea PU Elastomers Industry Revenue (Million) Forecast, by Application 2019 & 2032
- Table 74: South Korea PU Elastomers Industry Volume (K Tons) Forecast, by Application 2019 & 2032
- Table 75: Rest of Asia Pacific PU Elastomers Industry Revenue (Million) Forecast, by Application 2019 & 2032
- Table 76: Rest of Asia Pacific PU Elastomers Industry Volume (K Tons) Forecast, by Application 2019 & 2032
- Table 77: Global PU Elastomers Industry Revenue Million Forecast, by Type 2019 & 2032
- Table 78: Global PU Elastomers Industry Volume K Tons Forecast, by Type 2019 & 2032
- Table 79: Global PU Elastomers Industry Revenue Million Forecast, by Application 2019 & 2032
- Table 80: Global PU Elastomers Industry Volume K Tons Forecast, by Application 2019 & 2032
- Table 81: Global PU Elastomers Industry Revenue Million Forecast, by Country 2019 & 2032
- Table 82: Global PU Elastomers Industry Volume K Tons Forecast, by Country 2019 & 2032
- Table 83: United States PU Elastomers Industry Revenue (Million) Forecast, by Application 2019 & 2032
- Table 84: United States PU Elastomers Industry Volume (K Tons) Forecast, by Application 2019 & 2032
- Table 85: Canada PU Elastomers Industry Revenue (Million) Forecast, by Application 2019 & 2032
- Table 86: Canada PU Elastomers Industry Volume (K Tons) Forecast, by Application 2019 & 2032
- Table 87: Mexico PU Elastomers Industry Revenue (Million) Forecast, by Application 2019 & 2032
- Table 88: Mexico PU Elastomers Industry Volume (K Tons) Forecast, by Application 2019 & 2032
- Table 89: Global PU Elastomers Industry Revenue Million Forecast, by Type 2019 & 2032
- Table 90: Global PU Elastomers Industry Volume K Tons Forecast, by Type 2019 & 2032
- Table 91: Global PU Elastomers Industry Revenue Million Forecast, by Application 2019 & 2032
- Table 92: Global PU Elastomers Industry Volume K Tons Forecast, by Application 2019 & 2032
- Table 93: Global PU Elastomers Industry Revenue Million Forecast, by Country 2019 & 2032
- Table 94: Global PU Elastomers Industry Volume K Tons Forecast, by Country 2019 & 2032
- Table 95: Germany PU Elastomers Industry Revenue (Million) Forecast, by Application 2019 & 2032
- Table 96: Germany PU Elastomers Industry Volume (K Tons) Forecast, by Application 2019 & 2032
- Table 97: United Kingdom PU Elastomers Industry Revenue (Million) Forecast, by Application 2019 & 2032
- Table 98: United Kingdom PU Elastomers Industry Volume (K Tons) Forecast, by Application 2019 & 2032
- Table 99: France PU Elastomers Industry Revenue (Million) Forecast, by Application 2019 & 2032
- Table 100: France PU Elastomers Industry Volume (K Tons) Forecast, by Application 2019 & 2032
- Table 101: Italy PU Elastomers Industry Revenue (Million) Forecast, by Application 2019 & 2032
- Table 102: Italy PU Elastomers Industry Volume (K Tons) Forecast, by Application 2019 & 2032
- Table 103: Rest of Europe PU Elastomers Industry Revenue (Million) Forecast, by Application 2019 & 2032
- Table 104: Rest of Europe PU Elastomers Industry Volume (K Tons) Forecast, by Application 2019 & 2032
- Table 105: Global PU Elastomers Industry Revenue Million Forecast, by Type 2019 & 2032
- Table 106: Global PU Elastomers Industry Volume K Tons Forecast, by Type 2019 & 2032
- Table 107: Global PU Elastomers Industry Revenue Million Forecast, by Application 2019 & 2032
- Table 108: Global PU Elastomers Industry Volume K Tons Forecast, by Application 2019 & 2032
- Table 109: Global PU Elastomers Industry Revenue Million Forecast, by Country 2019 & 2032
- Table 110: Global PU Elastomers Industry Volume K Tons Forecast, by Country 2019 & 2032
- Table 111: Brazil PU Elastomers Industry Revenue (Million) Forecast, by Application 2019 & 2032
- Table 112: Brazil PU Elastomers Industry Volume (K Tons) Forecast, by Application 2019 & 2032
- Table 113: Argentina PU Elastomers Industry Revenue (Million) Forecast, by Application 2019 & 2032
- Table 114: Argentina PU Elastomers Industry Volume (K Tons) Forecast, by Application 2019 & 2032
- Table 115: Rest of South America PU Elastomers Industry Revenue (Million) Forecast, by Application 2019 & 2032
- Table 116: Rest of South America PU Elastomers Industry Volume (K Tons) Forecast, by Application 2019 & 2032
- Table 117: Global PU Elastomers Industry Revenue Million Forecast, by Type 2019 & 2032
- Table 118: Global PU Elastomers Industry Volume K Tons Forecast, by Type 2019 & 2032
- Table 119: Global PU Elastomers Industry Revenue Million Forecast, by Application 2019 & 2032
- Table 120: Global PU Elastomers Industry Volume K Tons Forecast, by Application 2019 & 2032
- Table 121: Global PU Elastomers Industry Revenue Million Forecast, by Country 2019 & 2032
- Table 122: Global PU Elastomers Industry Volume K Tons Forecast, by Country 2019 & 2032
- Table 123: Saudi Arabia PU Elastomers Industry Revenue (Million) Forecast, by Application 2019 & 2032
- Table 124: Saudi Arabia PU Elastomers Industry Volume (K Tons) Forecast, by Application 2019 & 2032
- Table 125: South Africa PU Elastomers Industry Revenue (Million) Forecast, by Application 2019 & 2032
- Table 126: South Africa PU Elastomers Industry Volume (K Tons) Forecast, by Application 2019 & 2032
- Table 127: Rest of Middle East and Africa PU Elastomers Industry Revenue (Million) Forecast, by Application 2019 & 2032
- Table 128: Rest of Middle East and Africa PU Elastomers Industry Volume (K Tons) Forecast, by Application 2019 & 2032
Frequently Asked Questions
1. What is the projected Compound Annual Growth Rate (CAGR) of the PU Elastomers Industry?
The projected CAGR is approximately > 3.30%.
2. Which companies are prominent players in the PU Elastomers Industry?
Key companies in the market include Ravelast Polymers, Mitsui Chemicals Inc, Argonics, Tosoh India Pvt Ltd, INOAC CORPORATION, American Urethane Inc, LANXESS, Weaver Industries Inc , Huntsman International LLC, Wanhua, Dow, The Lubrizol Corporation, Unicast Engineered Urethane Products, Covestro AG.
3. What are the main segments of the PU Elastomers Industry?
The market segments include Type, Application.
4. Can you provide details about the market size?
The market size is estimated to be USD 4.49 Million as of 2022.
5. What are some drivers contributing to market growth?
Increasing Demand from Footwear Industry; Growing Application in Automotive and Consumer Goods Industries; Other Drivers.
6. What are the notable trends driving market growth?
Footwear Industry Representing the Fastest Growing Market.
7. Are there any restraints impacting market growth?
Lower Durability of Polyurethane Elastomers; Environmental Concerns Caused by Polyurethane.
8. Can you provide examples of recent developments in the market?
October 2023: SKC sold its 100% shares of SK pucore, a polyurethane manufacturer, to Glenwood Private Equity, a Seoul-based private equity firm. SKC (petrochemical subsidiary) sold to a private equity firm at the price of KRW 410.3 billion (USD 304.1 million) in a bid to streamline its portfolio with a focus on semiconductor and EV battery materials, which will drive the PU elastomers market.
9. What pricing options are available for accessing the report?
Pricing options include single-user, multi-user, and enterprise licenses priced at USD 4750, USD 5250, and USD 8750 respectively.
10. Is the market size provided in terms of value or volume?
The market size is provided in terms of value, measured in Million and volume, measured in K Tons.
11. Are there any specific market keywords associated with the report?
Yes, the market keyword associated with the report is "PU Elastomers Industry," which aids in identifying and referencing the specific market segment covered.
12. How do I determine which pricing option suits my needs best?
The pricing options vary based on user requirements and access needs. Individual users may opt for single-user licenses, while businesses requiring broader access may choose multi-user or enterprise licenses for cost-effective access to the report.
13. Are there any additional resources or data provided in the PU Elastomers Industry report?
While the report offers comprehensive insights, it's advisable to review the specific contents or supplementary materials provided to ascertain if additional resources or data are available.
14. How can I stay updated on further developments or reports in the PU Elastomers Industry?
To stay informed about further developments, trends, and reports in the PU Elastomers Industry, consider subscribing to industry newsletters, following relevant companies and organizations, or regularly checking reputable industry news sources and publications.
Methodology
Step 1 - Identification of Relevant Samples Size from Population Database


Step 2 - Approaches for Defining Global Market Size (Value, Volume* & Price*)

Note*: In applicable scenarios
Step 3 - Data Sources
Primary Research
- Web Analytics
- Survey Reports
- Research Institute
- Latest Research Reports
- Opinion Leaders
Secondary Research
- Annual Reports
- White Paper
- Latest Press Release
- Industry Association
- Paid Database
- Investor Presentations

Step 4 - Data Triangulation
Involves using different sources of information in order to increase the validity of a study
These sources are likely to be stakeholders in a program - participants, other researchers, program staff, other community members, and so on.
Then we put all data in single framework & apply various statistical tools to find out the dynamic on the market.
During the analysis stage, feedback from the stakeholder groups would be compared to determine areas of agreement as well as areas of divergence


