
Key Insights
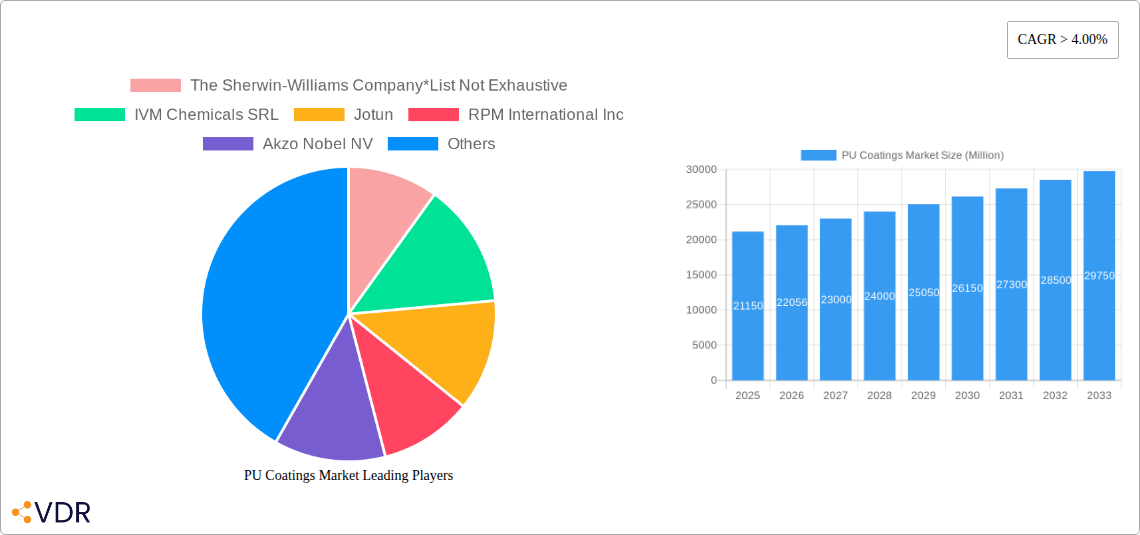
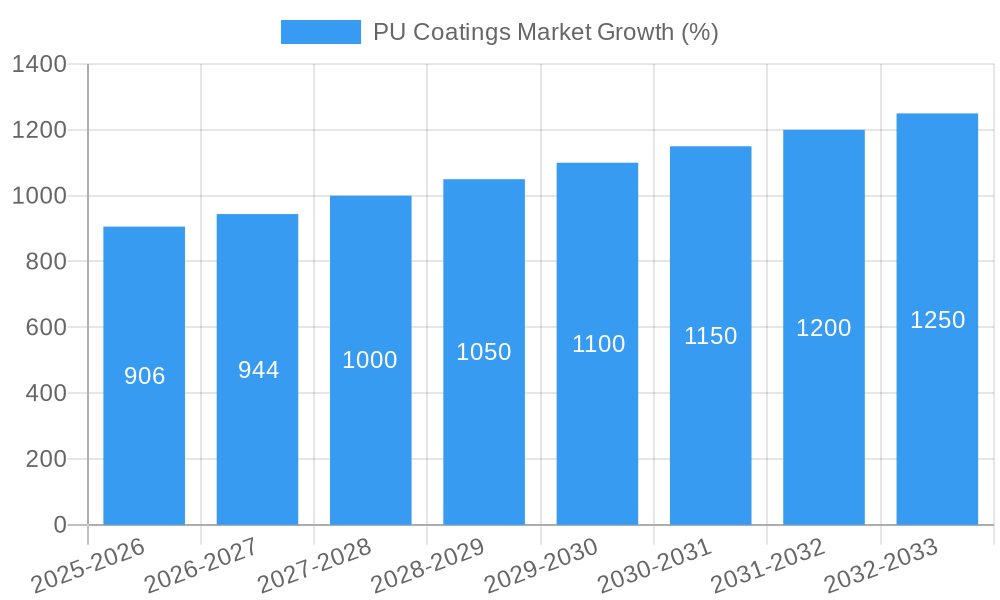
The polyurethane (PU) coatings market, valued at $21.15 billion in 2025, is projected to experience robust growth, exhibiting a Compound Annual Growth Rate (CAGR) exceeding 4.00% from 2025 to 2033. This expansion is driven by several key factors. The automotive industry's increasing demand for high-performance, durable coatings is a major contributor. Furthermore, the construction sector's adoption of PU coatings for improved waterproofing and corrosion resistance is fueling market growth. The rising popularity of sustainable and eco-friendly water-borne PU coatings is another significant trend, aligning with global environmental regulations and consumer preferences. Technological advancements in radiation-cured PU coatings, offering faster curing times and enhanced properties, further propel market expansion. Growth is geographically diverse, with Asia Pacific, particularly China and India, demonstrating significant potential due to rapid industrialization and infrastructure development. However, market growth faces certain restraints, including fluctuating raw material prices and potential health and environmental concerns associated with certain PU coating formulations. Addressing these challenges through innovation and sustainable practices will be crucial for sustained market expansion.
The market segmentation reveals substantial opportunities across diverse end-user industries. The automotive segment currently holds a leading position, followed by construction and electrical & electronics. Technological segmentation showcases the growing dominance of water-borne PU coatings due to their environmentally friendly nature, gradually eclipsing solvent-borne options. The competitive landscape is marked by both established global players such as Sherwin-Williams, Akzo Nobel, and BASF, and regional players catering to specific market needs. Strategic alliances, acquisitions, and continuous product innovation are shaping the competitive dynamics. Future growth will likely be influenced by factors such as government regulations promoting sustainable materials, technological advancements in coating application methods, and the increasing focus on performance-enhancing attributes such as enhanced durability, corrosion resistance, and UV protection. The market's continued expansion hinges on addressing environmental concerns and adapting to evolving industry standards.
PU Coatings Market: A Comprehensive Market Analysis (2019-2033)
This comprehensive report provides an in-depth analysis of the PU Coatings market, offering valuable insights for industry professionals, investors, and strategic decision-makers. The study covers the period from 2019 to 2033, with a focus on the forecast period of 2025-2033 and a base year of 2025. The market is segmented by end-user industry (Automotive, Transportation, Construction, Electrical & Electronics, Wood & Furniture, Aerospace, Industrial, Textile, Others) and technology (Powder, Solvent-borne, Water-borne, Radiation Cured). The total market size is estimated at xx Million in 2025 and projected to reach xx Million by 2033.
PU Coatings Market Dynamics & Structure
This section analyzes the competitive landscape, technological advancements, regulatory influences, and market trends impacting the PU Coatings market. The market is characterized by a moderately concentrated structure with key players holding significant market share. However, the emergence of new technologies and smaller players is increasing competition.
- Market Concentration: The top 10 players account for approximately xx% of the global market share in 2025.
- Technological Innovation: Continuous innovation in polyurethane chemistry drives the development of high-performance coatings with enhanced properties like durability, flexibility, and sustainability. However, high R&D costs and intellectual property protection pose significant innovation barriers.
- Regulatory Framework: Stringent environmental regulations regarding VOC emissions and chemical safety are shaping the market, driving the adoption of water-borne and radiation-cured PU coatings.
- Competitive Product Substitutes: Alternative coating technologies, such as epoxy and acrylic coatings, compete with PU coatings in certain applications.
- M&A Trends: Consolidation through mergers and acquisitions is a prominent trend, as evidenced by recent deals like SKC's sale of SK pucore. The volume of M&A deals in the past five years is estimated at xx.
- End-User Demographics: The construction and automotive industries are the primary drivers of PU coating demand, reflecting growth in infrastructure development and vehicle production.
PU Coatings Market Growth Trends & Insights
The PU Coatings market is experiencing robust growth, driven by increasing demand from various end-use sectors. The market is expected to exhibit a CAGR of xx% during the forecast period (2025-2033). This growth is fueled by several factors, including rising infrastructure spending, growth in the automotive industry, and the increasing adoption of sustainable and high-performance coatings. Market penetration in emerging economies is also contributing significantly to the overall market expansion. Technological advancements, particularly in water-borne and radiation-cured technologies, are further propelling market growth. Shifting consumer preferences towards aesthetically pleasing and durable finishes also contribute to higher adoption rates. Detailed analysis reveals strong correlation between economic growth and PU coating consumption, with developing nations showing exceptional growth potential.
Dominant Regions, Countries, or Segments in PU Coatings Market
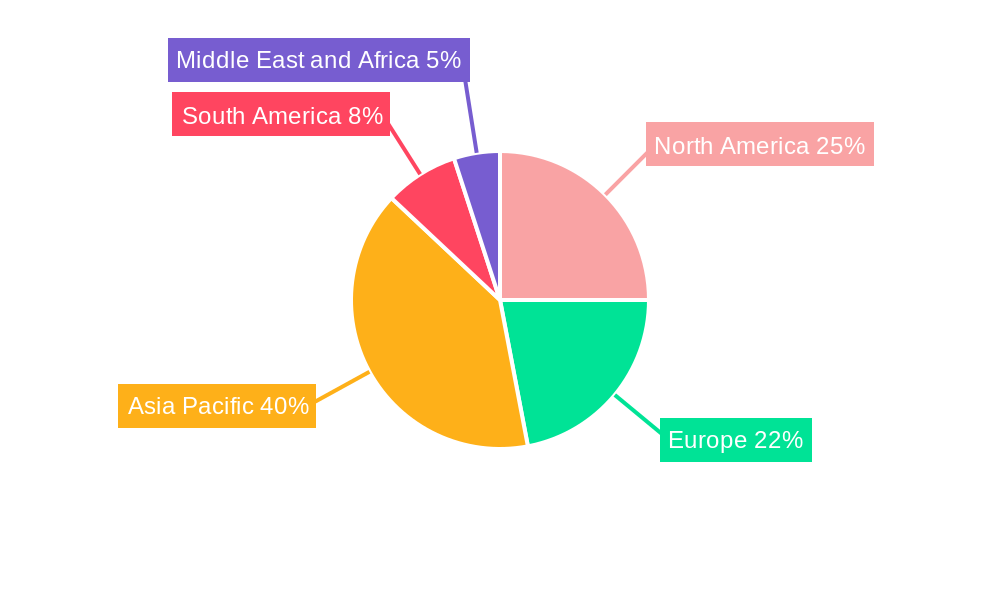
The Asia-Pacific region holds the largest market share in the PU Coatings market, followed by North America and Europe. China and India are key growth drivers in the Asia-Pacific region due to rapid urbanization, industrialization, and infrastructure development.
Leading Segments:
- End-User Industry: The Automotive segment dominates, driven by stringent vehicle emission regulations promoting lightweight vehicles, thus increasing demand for PU coatings. The construction segment is also witnessing considerable growth due to extensive infrastructure projects globally.
- Technology: Water-borne PU coatings are gaining traction due to their environmental friendliness and compliance with regulatory norms. However, solvent-borne coatings still hold a significant market share owing to their superior performance properties.
Key Drivers:
- Favorable Economic Policies: Government initiatives promoting infrastructure development and industrial growth significantly impact market expansion.
- Robust Infrastructure Spending: Investment in construction and transportation infrastructure directly correlates with PU coatings demand.
PU Coatings Market Product Landscape
PU coatings are available in various formulations tailored to specific applications, offering diverse properties like flexibility, abrasion resistance, and chemical resistance. Recent innovations focus on improving durability, reducing VOC emissions, and enhancing aesthetics. Unique selling propositions include superior performance characteristics, ease of application, and cost-effectiveness, compared to alternative coating solutions.
Key Drivers, Barriers & Challenges in PU Coatings Market
Key Drivers:
- Growing demand from construction, automotive, and furniture industries.
- Increasing adoption of eco-friendly water-borne PU coatings.
- Technological advancements leading to improved coating performance.
Key Challenges:
- Fluctuations in raw material prices impacting profitability.
- Stringent environmental regulations necessitating compliance costs.
- Intense competition from substitute coating materials. The market is experiencing a price war in some segments, negatively impacting profit margins by roughly xx%.
Emerging Opportunities in PU Coatings Market
Untapped markets in developing economies present significant growth potential. The increasing demand for specialized coatings in high-growth sectors like renewable energy and electronics offers substantial opportunities. Innovations in self-healing and anti-microbial coatings cater to emerging consumer preferences for high-performance and sustainable products.
Growth Accelerators in the PU Coatings Market Industry
Strategic partnerships and collaborations are driving market growth by fostering innovation and expanding market reach. Technological advancements, including the development of high-performance, environmentally friendly coatings, are key catalysts. Expansion into new geographical markets, particularly in developing economies, presents further growth potential.
Key Players Shaping the PU Coatings Market Market
- The Sherwin-Williams Company
- IVM Chemicals SRL
- Jotun
- RPM International Inc
- Akzo Nobel NV
- PPG Industries Inc
- BASF SE
- Axalta Coating Systems
- Asian Paints
- Polycoat Products
Notable Milestones in PU Coatings Market Sector
- October 2023: SKC sold its 100% shares of SK pucore to Glenwood Private Equity for USD 304.1 million, signifying industry consolidation and strategic portfolio adjustments.
- August 2023: Covestro launched a new polyurethane elastomer systems production plant in Shanghai, representing a substantial investment (double-digit million Euros) and expanding production capacity.
In-Depth PU Coatings Market Market Outlook
The PU Coatings market is poised for continued growth driven by technological advancements, increasing demand from key end-use sectors, and expansion into emerging markets. Strategic investments in R&D, sustainable manufacturing practices, and strategic partnerships will be crucial for success in this dynamic market. Companies focusing on innovative product development and catering to the growing demand for high-performance, eco-friendly coatings are expected to capture significant market share in the coming years.
PU Coatings Market Segmentation
-
1. Technology
- 1.1. Powder
- 1.2. Solvent-borne
- 1.3. Water-borne
- 1.4. Radiation Cured
-
2. End-user Industry
- 2.1. Automotive
- 2.2. Transportation
- 2.3. Construction
- 2.4. Electrical and Electronics
- 2.5. Wood and Furniture
- 2.6. Others E
PU Coatings Market Segmentation By Geography
-
1. Asia Pacific
- 1.1. China
- 1.2. India
- 1.3. Japan
- 1.4. South Korea
- 1.5. Rest of Asia Pacific
-
2. North America
- 2.1. United States
- 2.2. Canada
- 2.3. Mexico
-
3. Europe
- 3.1. Germany
- 3.2. United Kingdom
- 3.3. Italy
- 3.4. France
- 3.5. Rest of Europe
-
4. South America
- 4.1. Brazil
- 4.2. Argentina
- 4.3. Rest of South America
-
5. Middle East and Africa
- 5.1. Saudi Arabia
- 5.2. South Africa
- 5.3. Rest of Middle East and Africa
PU Coatings Market REPORT HIGHLIGHTS
| Aspects | Details |
|---|---|
| Study Period | 2019-2033 |
| Base Year | 2024 |
| Estimated Year | 2025 |
| Forecast Period | 2025-2033 |
| Historical Period | 2019-2024 |
| Growth Rate | CAGR of > 4.00% from 2019-2033 |
| Segmentation |
|
Table of Contents
- 1. Introduction
- 1.1. Research Scope
- 1.2. Market Segmentation
- 1.3. Research Methodology
- 1.4. Definitions and Assumptions
- 2. Executive Summary
- 2.1. Introduction
- 3. Market Dynamics
- 3.1. Introduction
- 3.2. Market Drivers
- 3.2.1. Growing Demand from the Construction Industry; Increase in Demand from the Automotive Industry; Growing Demand from the Transportation Industry
- 3.3. Market Restrains
- 3.3.1. Volatile Raw Material Prices; Other Restraints
- 3.4. Market Trends
- 3.4.1. Automotive Industry to Dominate the Market
- 4. Market Factor Analysis
- 4.1. Porters Five Forces
- 4.2. Supply/Value Chain
- 4.3. PESTEL analysis
- 4.4. Market Entropy
- 4.5. Patent/Trademark Analysis
- 5. Global PU Coatings Market Analysis, Insights and Forecast, 2019-2031
- 5.1. Market Analysis, Insights and Forecast - by Technology
- 5.1.1. Powder
- 5.1.2. Solvent-borne
- 5.1.3. Water-borne
- 5.1.4. Radiation Cured
- 5.2. Market Analysis, Insights and Forecast - by End-user Industry
- 5.2.1. Automotive
- 5.2.2. Transportation
- 5.2.3. Construction
- 5.2.4. Electrical and Electronics
- 5.2.5. Wood and Furniture
- 5.2.6. Others E
- 5.3. Market Analysis, Insights and Forecast - by Region
- 5.3.1. Asia Pacific
- 5.3.2. North America
- 5.3.3. Europe
- 5.3.4. South America
- 5.3.5. Middle East and Africa
- 5.1. Market Analysis, Insights and Forecast - by Technology
- 6. Asia Pacific PU Coatings Market Analysis, Insights and Forecast, 2019-2031
- 6.1. Market Analysis, Insights and Forecast - by Technology
- 6.1.1. Powder
- 6.1.2. Solvent-borne
- 6.1.3. Water-borne
- 6.1.4. Radiation Cured
- 6.2. Market Analysis, Insights and Forecast - by End-user Industry
- 6.2.1. Automotive
- 6.2.2. Transportation
- 6.2.3. Construction
- 6.2.4. Electrical and Electronics
- 6.2.5. Wood and Furniture
- 6.2.6. Others E
- 6.1. Market Analysis, Insights and Forecast - by Technology
- 7. North America PU Coatings Market Analysis, Insights and Forecast, 2019-2031
- 7.1. Market Analysis, Insights and Forecast - by Technology
- 7.1.1. Powder
- 7.1.2. Solvent-borne
- 7.1.3. Water-borne
- 7.1.4. Radiation Cured
- 7.2. Market Analysis, Insights and Forecast - by End-user Industry
- 7.2.1. Automotive
- 7.2.2. Transportation
- 7.2.3. Construction
- 7.2.4. Electrical and Electronics
- 7.2.5. Wood and Furniture
- 7.2.6. Others E
- 7.1. Market Analysis, Insights and Forecast - by Technology
- 8. Europe PU Coatings Market Analysis, Insights and Forecast, 2019-2031
- 8.1. Market Analysis, Insights and Forecast - by Technology
- 8.1.1. Powder
- 8.1.2. Solvent-borne
- 8.1.3. Water-borne
- 8.1.4. Radiation Cured
- 8.2. Market Analysis, Insights and Forecast - by End-user Industry
- 8.2.1. Automotive
- 8.2.2. Transportation
- 8.2.3. Construction
- 8.2.4. Electrical and Electronics
- 8.2.5. Wood and Furniture
- 8.2.6. Others E
- 8.1. Market Analysis, Insights and Forecast - by Technology
- 9. South America PU Coatings Market Analysis, Insights and Forecast, 2019-2031
- 9.1. Market Analysis, Insights and Forecast - by Technology
- 9.1.1. Powder
- 9.1.2. Solvent-borne
- 9.1.3. Water-borne
- 9.1.4. Radiation Cured
- 9.2. Market Analysis, Insights and Forecast - by End-user Industry
- 9.2.1. Automotive
- 9.2.2. Transportation
- 9.2.3. Construction
- 9.2.4. Electrical and Electronics
- 9.2.5. Wood and Furniture
- 9.2.6. Others E
- 9.1. Market Analysis, Insights and Forecast - by Technology
- 10. Middle East and Africa PU Coatings Market Analysis, Insights and Forecast, 2019-2031
- 10.1. Market Analysis, Insights and Forecast - by Technology
- 10.1.1. Powder
- 10.1.2. Solvent-borne
- 10.1.3. Water-borne
- 10.1.4. Radiation Cured
- 10.2. Market Analysis, Insights and Forecast - by End-user Industry
- 10.2.1. Automotive
- 10.2.2. Transportation
- 10.2.3. Construction
- 10.2.4. Electrical and Electronics
- 10.2.5. Wood and Furniture
- 10.2.6. Others E
- 10.1. Market Analysis, Insights and Forecast - by Technology
- 11. Asia Pacific PU Coatings Market Analysis, Insights and Forecast, 2019-2031
- 11.1. Market Analysis, Insights and Forecast - By Country/Sub-region
- 11.1.1 China
- 11.1.2 India
- 11.1.3 Japan
- 11.1.4 South Korea
- 11.1.5 Rest of Asia Pacific
- 12. North America PU Coatings Market Analysis, Insights and Forecast, 2019-2031
- 12.1. Market Analysis, Insights and Forecast - By Country/Sub-region
- 12.1.1 United States
- 12.1.2 Canada
- 12.1.3 Mexico
- 13. Europe PU Coatings Market Analysis, Insights and Forecast, 2019-2031
- 13.1. Market Analysis, Insights and Forecast - By Country/Sub-region
- 13.1.1 Germany
- 13.1.2 United Kingdom
- 13.1.3 Italy
- 13.1.4 France
- 13.1.5 Rest of Europe
- 14. South America PU Coatings Market Analysis, Insights and Forecast, 2019-2031
- 14.1. Market Analysis, Insights and Forecast - By Country/Sub-region
- 14.1.1 Brazil
- 14.1.2 Argentina
- 14.1.3 Rest of South America
- 15. Middle East and Africa PU Coatings Market Analysis, Insights and Forecast, 2019-2031
- 15.1. Market Analysis, Insights and Forecast - By Country/Sub-region
- 15.1.1 Saudi Arabia
- 15.1.2 South Africa
- 15.1.3 Rest of Middle East and Africa
- 16. Competitive Analysis
- 16.1. Global Market Share Analysis 2024
- 16.2. Company Profiles
- 16.2.1 The Sherwin-Williams Company*List Not Exhaustive
- 16.2.1.1. Overview
- 16.2.1.2. Products
- 16.2.1.3. SWOT Analysis
- 16.2.1.4. Recent Developments
- 16.2.1.5. Financials (Based on Availability)
- 16.2.2 IVM Chemicals SRL
- 16.2.2.1. Overview
- 16.2.2.2. Products
- 16.2.2.3. SWOT Analysis
- 16.2.2.4. Recent Developments
- 16.2.2.5. Financials (Based on Availability)
- 16.2.3 Jotun
- 16.2.3.1. Overview
- 16.2.3.2. Products
- 16.2.3.3. SWOT Analysis
- 16.2.3.4. Recent Developments
- 16.2.3.5. Financials (Based on Availability)
- 16.2.4 RPM International Inc
- 16.2.4.1. Overview
- 16.2.4.2. Products
- 16.2.4.3. SWOT Analysis
- 16.2.4.4. Recent Developments
- 16.2.4.5. Financials (Based on Availability)
- 16.2.5 Akzo Nobel NV
- 16.2.5.1. Overview
- 16.2.5.2. Products
- 16.2.5.3. SWOT Analysis
- 16.2.5.4. Recent Developments
- 16.2.5.5. Financials (Based on Availability)
- 16.2.6 PPG Industries Inc
- 16.2.6.1. Overview
- 16.2.6.2. Products
- 16.2.6.3. SWOT Analysis
- 16.2.6.4. Recent Developments
- 16.2.6.5. Financials (Based on Availability)
- 16.2.7 BASF SE
- 16.2.7.1. Overview
- 16.2.7.2. Products
- 16.2.7.3. SWOT Analysis
- 16.2.7.4. Recent Developments
- 16.2.7.5. Financials (Based on Availability)
- 16.2.8 Axalta Coating Systems
- 16.2.8.1. Overview
- 16.2.8.2. Products
- 16.2.8.3. SWOT Analysis
- 16.2.8.4. Recent Developments
- 16.2.8.5. Financials (Based on Availability)
- 16.2.9 Asian Paints
- 16.2.9.1. Overview
- 16.2.9.2. Products
- 16.2.9.3. SWOT Analysis
- 16.2.9.4. Recent Developments
- 16.2.9.5. Financials (Based on Availability)
- 16.2.10 Polycoat Products
- 16.2.10.1. Overview
- 16.2.10.2. Products
- 16.2.10.3. SWOT Analysis
- 16.2.10.4. Recent Developments
- 16.2.10.5. Financials (Based on Availability)
- 16.2.1 The Sherwin-Williams Company*List Not Exhaustive
List of Figures
- Figure 1: Global PU Coatings Market Revenue Breakdown (Million, %) by Region 2024 & 2032
- Figure 2: Global PU Coatings Market Volume Breakdown (liter , %) by Region 2024 & 2032
- Figure 3: Asia Pacific PU Coatings Market Revenue (Million), by Country 2024 & 2032
- Figure 4: Asia Pacific PU Coatings Market Volume (liter ), by Country 2024 & 2032
- Figure 5: Asia Pacific PU Coatings Market Revenue Share (%), by Country 2024 & 2032
- Figure 6: Asia Pacific PU Coatings Market Volume Share (%), by Country 2024 & 2032
- Figure 7: North America PU Coatings Market Revenue (Million), by Country 2024 & 2032
- Figure 8: North America PU Coatings Market Volume (liter ), by Country 2024 & 2032
- Figure 9: North America PU Coatings Market Revenue Share (%), by Country 2024 & 2032
- Figure 10: North America PU Coatings Market Volume Share (%), by Country 2024 & 2032
- Figure 11: Europe PU Coatings Market Revenue (Million), by Country 2024 & 2032
- Figure 12: Europe PU Coatings Market Volume (liter ), by Country 2024 & 2032
- Figure 13: Europe PU Coatings Market Revenue Share (%), by Country 2024 & 2032
- Figure 14: Europe PU Coatings Market Volume Share (%), by Country 2024 & 2032
- Figure 15: South America PU Coatings Market Revenue (Million), by Country 2024 & 2032
- Figure 16: South America PU Coatings Market Volume (liter ), by Country 2024 & 2032
- Figure 17: South America PU Coatings Market Revenue Share (%), by Country 2024 & 2032
- Figure 18: South America PU Coatings Market Volume Share (%), by Country 2024 & 2032
- Figure 19: Middle East and Africa PU Coatings Market Revenue (Million), by Country 2024 & 2032
- Figure 20: Middle East and Africa PU Coatings Market Volume (liter ), by Country 2024 & 2032
- Figure 21: Middle East and Africa PU Coatings Market Revenue Share (%), by Country 2024 & 2032
- Figure 22: Middle East and Africa PU Coatings Market Volume Share (%), by Country 2024 & 2032
- Figure 23: Asia Pacific PU Coatings Market Revenue (Million), by Technology 2024 & 2032
- Figure 24: Asia Pacific PU Coatings Market Volume (liter ), by Technology 2024 & 2032
- Figure 25: Asia Pacific PU Coatings Market Revenue Share (%), by Technology 2024 & 2032
- Figure 26: Asia Pacific PU Coatings Market Volume Share (%), by Technology 2024 & 2032
- Figure 27: Asia Pacific PU Coatings Market Revenue (Million), by End-user Industry 2024 & 2032
- Figure 28: Asia Pacific PU Coatings Market Volume (liter ), by End-user Industry 2024 & 2032
- Figure 29: Asia Pacific PU Coatings Market Revenue Share (%), by End-user Industry 2024 & 2032
- Figure 30: Asia Pacific PU Coatings Market Volume Share (%), by End-user Industry 2024 & 2032
- Figure 31: Asia Pacific PU Coatings Market Revenue (Million), by Country 2024 & 2032
- Figure 32: Asia Pacific PU Coatings Market Volume (liter ), by Country 2024 & 2032
- Figure 33: Asia Pacific PU Coatings Market Revenue Share (%), by Country 2024 & 2032
- Figure 34: Asia Pacific PU Coatings Market Volume Share (%), by Country 2024 & 2032
- Figure 35: North America PU Coatings Market Revenue (Million), by Technology 2024 & 2032
- Figure 36: North America PU Coatings Market Volume (liter ), by Technology 2024 & 2032
- Figure 37: North America PU Coatings Market Revenue Share (%), by Technology 2024 & 2032
- Figure 38: North America PU Coatings Market Volume Share (%), by Technology 2024 & 2032
- Figure 39: North America PU Coatings Market Revenue (Million), by End-user Industry 2024 & 2032
- Figure 40: North America PU Coatings Market Volume (liter ), by End-user Industry 2024 & 2032
- Figure 41: North America PU Coatings Market Revenue Share (%), by End-user Industry 2024 & 2032
- Figure 42: North America PU Coatings Market Volume Share (%), by End-user Industry 2024 & 2032
- Figure 43: North America PU Coatings Market Revenue (Million), by Country 2024 & 2032
- Figure 44: North America PU Coatings Market Volume (liter ), by Country 2024 & 2032
- Figure 45: North America PU Coatings Market Revenue Share (%), by Country 2024 & 2032
- Figure 46: North America PU Coatings Market Volume Share (%), by Country 2024 & 2032
- Figure 47: Europe PU Coatings Market Revenue (Million), by Technology 2024 & 2032
- Figure 48: Europe PU Coatings Market Volume (liter ), by Technology 2024 & 2032
- Figure 49: Europe PU Coatings Market Revenue Share (%), by Technology 2024 & 2032
- Figure 50: Europe PU Coatings Market Volume Share (%), by Technology 2024 & 2032
- Figure 51: Europe PU Coatings Market Revenue (Million), by End-user Industry 2024 & 2032
- Figure 52: Europe PU Coatings Market Volume (liter ), by End-user Industry 2024 & 2032
- Figure 53: Europe PU Coatings Market Revenue Share (%), by End-user Industry 2024 & 2032
- Figure 54: Europe PU Coatings Market Volume Share (%), by End-user Industry 2024 & 2032
- Figure 55: Europe PU Coatings Market Revenue (Million), by Country 2024 & 2032
- Figure 56: Europe PU Coatings Market Volume (liter ), by Country 2024 & 2032
- Figure 57: Europe PU Coatings Market Revenue Share (%), by Country 2024 & 2032
- Figure 58: Europe PU Coatings Market Volume Share (%), by Country 2024 & 2032
- Figure 59: South America PU Coatings Market Revenue (Million), by Technology 2024 & 2032
- Figure 60: South America PU Coatings Market Volume (liter ), by Technology 2024 & 2032
- Figure 61: South America PU Coatings Market Revenue Share (%), by Technology 2024 & 2032
- Figure 62: South America PU Coatings Market Volume Share (%), by Technology 2024 & 2032
- Figure 63: South America PU Coatings Market Revenue (Million), by End-user Industry 2024 & 2032
- Figure 64: South America PU Coatings Market Volume (liter ), by End-user Industry 2024 & 2032
- Figure 65: South America PU Coatings Market Revenue Share (%), by End-user Industry 2024 & 2032
- Figure 66: South America PU Coatings Market Volume Share (%), by End-user Industry 2024 & 2032
- Figure 67: South America PU Coatings Market Revenue (Million), by Country 2024 & 2032
- Figure 68: South America PU Coatings Market Volume (liter ), by Country 2024 & 2032
- Figure 69: South America PU Coatings Market Revenue Share (%), by Country 2024 & 2032
- Figure 70: South America PU Coatings Market Volume Share (%), by Country 2024 & 2032
- Figure 71: Middle East and Africa PU Coatings Market Revenue (Million), by Technology 2024 & 2032
- Figure 72: Middle East and Africa PU Coatings Market Volume (liter ), by Technology 2024 & 2032
- Figure 73: Middle East and Africa PU Coatings Market Revenue Share (%), by Technology 2024 & 2032
- Figure 74: Middle East and Africa PU Coatings Market Volume Share (%), by Technology 2024 & 2032
- Figure 75: Middle East and Africa PU Coatings Market Revenue (Million), by End-user Industry 2024 & 2032
- Figure 76: Middle East and Africa PU Coatings Market Volume (liter ), by End-user Industry 2024 & 2032
- Figure 77: Middle East and Africa PU Coatings Market Revenue Share (%), by End-user Industry 2024 & 2032
- Figure 78: Middle East and Africa PU Coatings Market Volume Share (%), by End-user Industry 2024 & 2032
- Figure 79: Middle East and Africa PU Coatings Market Revenue (Million), by Country 2024 & 2032
- Figure 80: Middle East and Africa PU Coatings Market Volume (liter ), by Country 2024 & 2032
- Figure 81: Middle East and Africa PU Coatings Market Revenue Share (%), by Country 2024 & 2032
- Figure 82: Middle East and Africa PU Coatings Market Volume Share (%), by Country 2024 & 2032
List of Tables
- Table 1: Global PU Coatings Market Revenue Million Forecast, by Region 2019 & 2032
- Table 2: Global PU Coatings Market Volume liter Forecast, by Region 2019 & 2032
- Table 3: Global PU Coatings Market Revenue Million Forecast, by Technology 2019 & 2032
- Table 4: Global PU Coatings Market Volume liter Forecast, by Technology 2019 & 2032
- Table 5: Global PU Coatings Market Revenue Million Forecast, by End-user Industry 2019 & 2032
- Table 6: Global PU Coatings Market Volume liter Forecast, by End-user Industry 2019 & 2032
- Table 7: Global PU Coatings Market Revenue Million Forecast, by Region 2019 & 2032
- Table 8: Global PU Coatings Market Volume liter Forecast, by Region 2019 & 2032
- Table 9: Global PU Coatings Market Revenue Million Forecast, by Country 2019 & 2032
- Table 10: Global PU Coatings Market Volume liter Forecast, by Country 2019 & 2032
- Table 11: China PU Coatings Market Revenue (Million) Forecast, by Application 2019 & 2032
- Table 12: China PU Coatings Market Volume (liter ) Forecast, by Application 2019 & 2032
- Table 13: India PU Coatings Market Revenue (Million) Forecast, by Application 2019 & 2032
- Table 14: India PU Coatings Market Volume (liter ) Forecast, by Application 2019 & 2032
- Table 15: Japan PU Coatings Market Revenue (Million) Forecast, by Application 2019 & 2032
- Table 16: Japan PU Coatings Market Volume (liter ) Forecast, by Application 2019 & 2032
- Table 17: South Korea PU Coatings Market Revenue (Million) Forecast, by Application 2019 & 2032
- Table 18: South Korea PU Coatings Market Volume (liter ) Forecast, by Application 2019 & 2032
- Table 19: Rest of Asia Pacific PU Coatings Market Revenue (Million) Forecast, by Application 2019 & 2032
- Table 20: Rest of Asia Pacific PU Coatings Market Volume (liter ) Forecast, by Application 2019 & 2032
- Table 21: Global PU Coatings Market Revenue Million Forecast, by Country 2019 & 2032
- Table 22: Global PU Coatings Market Volume liter Forecast, by Country 2019 & 2032
- Table 23: United States PU Coatings Market Revenue (Million) Forecast, by Application 2019 & 2032
- Table 24: United States PU Coatings Market Volume (liter ) Forecast, by Application 2019 & 2032
- Table 25: Canada PU Coatings Market Revenue (Million) Forecast, by Application 2019 & 2032
- Table 26: Canada PU Coatings Market Volume (liter ) Forecast, by Application 2019 & 2032
- Table 27: Mexico PU Coatings Market Revenue (Million) Forecast, by Application 2019 & 2032
- Table 28: Mexico PU Coatings Market Volume (liter ) Forecast, by Application 2019 & 2032
- Table 29: Global PU Coatings Market Revenue Million Forecast, by Country 2019 & 2032
- Table 30: Global PU Coatings Market Volume liter Forecast, by Country 2019 & 2032
- Table 31: Germany PU Coatings Market Revenue (Million) Forecast, by Application 2019 & 2032
- Table 32: Germany PU Coatings Market Volume (liter ) Forecast, by Application 2019 & 2032
- Table 33: United Kingdom PU Coatings Market Revenue (Million) Forecast, by Application 2019 & 2032
- Table 34: United Kingdom PU Coatings Market Volume (liter ) Forecast, by Application 2019 & 2032
- Table 35: Italy PU Coatings Market Revenue (Million) Forecast, by Application 2019 & 2032
- Table 36: Italy PU Coatings Market Volume (liter ) Forecast, by Application 2019 & 2032
- Table 37: France PU Coatings Market Revenue (Million) Forecast, by Application 2019 & 2032
- Table 38: France PU Coatings Market Volume (liter ) Forecast, by Application 2019 & 2032
- Table 39: Rest of Europe PU Coatings Market Revenue (Million) Forecast, by Application 2019 & 2032
- Table 40: Rest of Europe PU Coatings Market Volume (liter ) Forecast, by Application 2019 & 2032
- Table 41: Global PU Coatings Market Revenue Million Forecast, by Country 2019 & 2032
- Table 42: Global PU Coatings Market Volume liter Forecast, by Country 2019 & 2032
- Table 43: Brazil PU Coatings Market Revenue (Million) Forecast, by Application 2019 & 2032
- Table 44: Brazil PU Coatings Market Volume (liter ) Forecast, by Application 2019 & 2032
- Table 45: Argentina PU Coatings Market Revenue (Million) Forecast, by Application 2019 & 2032
- Table 46: Argentina PU Coatings Market Volume (liter ) Forecast, by Application 2019 & 2032
- Table 47: Rest of South America PU Coatings Market Revenue (Million) Forecast, by Application 2019 & 2032
- Table 48: Rest of South America PU Coatings Market Volume (liter ) Forecast, by Application 2019 & 2032
- Table 49: Global PU Coatings Market Revenue Million Forecast, by Country 2019 & 2032
- Table 50: Global PU Coatings Market Volume liter Forecast, by Country 2019 & 2032
- Table 51: Saudi Arabia PU Coatings Market Revenue (Million) Forecast, by Application 2019 & 2032
- Table 52: Saudi Arabia PU Coatings Market Volume (liter ) Forecast, by Application 2019 & 2032
- Table 53: South Africa PU Coatings Market Revenue (Million) Forecast, by Application 2019 & 2032
- Table 54: South Africa PU Coatings Market Volume (liter ) Forecast, by Application 2019 & 2032
- Table 55: Rest of Middle East and Africa PU Coatings Market Revenue (Million) Forecast, by Application 2019 & 2032
- Table 56: Rest of Middle East and Africa PU Coatings Market Volume (liter ) Forecast, by Application 2019 & 2032
- Table 57: Global PU Coatings Market Revenue Million Forecast, by Technology 2019 & 2032
- Table 58: Global PU Coatings Market Volume liter Forecast, by Technology 2019 & 2032
- Table 59: Global PU Coatings Market Revenue Million Forecast, by End-user Industry 2019 & 2032
- Table 60: Global PU Coatings Market Volume liter Forecast, by End-user Industry 2019 & 2032
- Table 61: Global PU Coatings Market Revenue Million Forecast, by Country 2019 & 2032
- Table 62: Global PU Coatings Market Volume liter Forecast, by Country 2019 & 2032
- Table 63: China PU Coatings Market Revenue (Million) Forecast, by Application 2019 & 2032
- Table 64: China PU Coatings Market Volume (liter ) Forecast, by Application 2019 & 2032
- Table 65: India PU Coatings Market Revenue (Million) Forecast, by Application 2019 & 2032
- Table 66: India PU Coatings Market Volume (liter ) Forecast, by Application 2019 & 2032
- Table 67: Japan PU Coatings Market Revenue (Million) Forecast, by Application 2019 & 2032
- Table 68: Japan PU Coatings Market Volume (liter ) Forecast, by Application 2019 & 2032
- Table 69: South Korea PU Coatings Market Revenue (Million) Forecast, by Application 2019 & 2032
- Table 70: South Korea PU Coatings Market Volume (liter ) Forecast, by Application 2019 & 2032
- Table 71: Rest of Asia Pacific PU Coatings Market Revenue (Million) Forecast, by Application 2019 & 2032
- Table 72: Rest of Asia Pacific PU Coatings Market Volume (liter ) Forecast, by Application 2019 & 2032
- Table 73: Global PU Coatings Market Revenue Million Forecast, by Technology 2019 & 2032
- Table 74: Global PU Coatings Market Volume liter Forecast, by Technology 2019 & 2032
- Table 75: Global PU Coatings Market Revenue Million Forecast, by End-user Industry 2019 & 2032
- Table 76: Global PU Coatings Market Volume liter Forecast, by End-user Industry 2019 & 2032
- Table 77: Global PU Coatings Market Revenue Million Forecast, by Country 2019 & 2032
- Table 78: Global PU Coatings Market Volume liter Forecast, by Country 2019 & 2032
- Table 79: United States PU Coatings Market Revenue (Million) Forecast, by Application 2019 & 2032
- Table 80: United States PU Coatings Market Volume (liter ) Forecast, by Application 2019 & 2032
- Table 81: Canada PU Coatings Market Revenue (Million) Forecast, by Application 2019 & 2032
- Table 82: Canada PU Coatings Market Volume (liter ) Forecast, by Application 2019 & 2032
- Table 83: Mexico PU Coatings Market Revenue (Million) Forecast, by Application 2019 & 2032
- Table 84: Mexico PU Coatings Market Volume (liter ) Forecast, by Application 2019 & 2032
- Table 85: Global PU Coatings Market Revenue Million Forecast, by Technology 2019 & 2032
- Table 86: Global PU Coatings Market Volume liter Forecast, by Technology 2019 & 2032
- Table 87: Global PU Coatings Market Revenue Million Forecast, by End-user Industry 2019 & 2032
- Table 88: Global PU Coatings Market Volume liter Forecast, by End-user Industry 2019 & 2032
- Table 89: Global PU Coatings Market Revenue Million Forecast, by Country 2019 & 2032
- Table 90: Global PU Coatings Market Volume liter Forecast, by Country 2019 & 2032
- Table 91: Germany PU Coatings Market Revenue (Million) Forecast, by Application 2019 & 2032
- Table 92: Germany PU Coatings Market Volume (liter ) Forecast, by Application 2019 & 2032
- Table 93: United Kingdom PU Coatings Market Revenue (Million) Forecast, by Application 2019 & 2032
- Table 94: United Kingdom PU Coatings Market Volume (liter ) Forecast, by Application 2019 & 2032
- Table 95: Italy PU Coatings Market Revenue (Million) Forecast, by Application 2019 & 2032
- Table 96: Italy PU Coatings Market Volume (liter ) Forecast, by Application 2019 & 2032
- Table 97: France PU Coatings Market Revenue (Million) Forecast, by Application 2019 & 2032
- Table 98: France PU Coatings Market Volume (liter ) Forecast, by Application 2019 & 2032
- Table 99: Rest of Europe PU Coatings Market Revenue (Million) Forecast, by Application 2019 & 2032
- Table 100: Rest of Europe PU Coatings Market Volume (liter ) Forecast, by Application 2019 & 2032
- Table 101: Global PU Coatings Market Revenue Million Forecast, by Technology 2019 & 2032
- Table 102: Global PU Coatings Market Volume liter Forecast, by Technology 2019 & 2032
- Table 103: Global PU Coatings Market Revenue Million Forecast, by End-user Industry 2019 & 2032
- Table 104: Global PU Coatings Market Volume liter Forecast, by End-user Industry 2019 & 2032
- Table 105: Global PU Coatings Market Revenue Million Forecast, by Country 2019 & 2032
- Table 106: Global PU Coatings Market Volume liter Forecast, by Country 2019 & 2032
- Table 107: Brazil PU Coatings Market Revenue (Million) Forecast, by Application 2019 & 2032
- Table 108: Brazil PU Coatings Market Volume (liter ) Forecast, by Application 2019 & 2032
- Table 109: Argentina PU Coatings Market Revenue (Million) Forecast, by Application 2019 & 2032
- Table 110: Argentina PU Coatings Market Volume (liter ) Forecast, by Application 2019 & 2032
- Table 111: Rest of South America PU Coatings Market Revenue (Million) Forecast, by Application 2019 & 2032
- Table 112: Rest of South America PU Coatings Market Volume (liter ) Forecast, by Application 2019 & 2032
- Table 113: Global PU Coatings Market Revenue Million Forecast, by Technology 2019 & 2032
- Table 114: Global PU Coatings Market Volume liter Forecast, by Technology 2019 & 2032
- Table 115: Global PU Coatings Market Revenue Million Forecast, by End-user Industry 2019 & 2032
- Table 116: Global PU Coatings Market Volume liter Forecast, by End-user Industry 2019 & 2032
- Table 117: Global PU Coatings Market Revenue Million Forecast, by Country 2019 & 2032
- Table 118: Global PU Coatings Market Volume liter Forecast, by Country 2019 & 2032
- Table 119: Saudi Arabia PU Coatings Market Revenue (Million) Forecast, by Application 2019 & 2032
- Table 120: Saudi Arabia PU Coatings Market Volume (liter ) Forecast, by Application 2019 & 2032
- Table 121: South Africa PU Coatings Market Revenue (Million) Forecast, by Application 2019 & 2032
- Table 122: South Africa PU Coatings Market Volume (liter ) Forecast, by Application 2019 & 2032
- Table 123: Rest of Middle East and Africa PU Coatings Market Revenue (Million) Forecast, by Application 2019 & 2032
- Table 124: Rest of Middle East and Africa PU Coatings Market Volume (liter ) Forecast, by Application 2019 & 2032
Frequently Asked Questions
1. What is the projected Compound Annual Growth Rate (CAGR) of the PU Coatings Market?
The projected CAGR is approximately > 4.00%.
2. Which companies are prominent players in the PU Coatings Market?
Key companies in the market include The Sherwin-Williams Company*List Not Exhaustive, IVM Chemicals SRL, Jotun, RPM International Inc, Akzo Nobel NV, PPG Industries Inc, BASF SE, Axalta Coating Systems, Asian Paints, Polycoat Products.
3. What are the main segments of the PU Coatings Market?
The market segments include Technology, End-user Industry.
4. Can you provide details about the market size?
The market size is estimated to be USD 21.15 Million as of 2022.
5. What are some drivers contributing to market growth?
Growing Demand from the Construction Industry; Increase in Demand from the Automotive Industry; Growing Demand from the Transportation Industry.
6. What are the notable trends driving market growth?
Automotive Industry to Dominate the Market.
7. Are there any restraints impacting market growth?
Volatile Raw Material Prices; Other Restraints.
8. Can you provide examples of recent developments in the market?
October 2023: SKC sold its 100% shares of SK pucore, a polyurethane manufacturer, to Glenwood Private Equity, a Seoul-based private equity firm. SKC (petrochemical subsidiary) sold to a private equity firm at the price of KRW 410.3 billion (USD 304.1 million) in a bid to streamline its portfolio with a focus on semiconductor and EV battery materials.
9. What pricing options are available for accessing the report?
Pricing options include single-user, multi-user, and enterprise licenses priced at USD 4750, USD 5250, and USD 8750 respectively.
10. Is the market size provided in terms of value or volume?
The market size is provided in terms of value, measured in Million and volume, measured in liter .
11. Are there any specific market keywords associated with the report?
Yes, the market keyword associated with the report is "PU Coatings Market," which aids in identifying and referencing the specific market segment covered.
12. How do I determine which pricing option suits my needs best?
The pricing options vary based on user requirements and access needs. Individual users may opt for single-user licenses, while businesses requiring broader access may choose multi-user or enterprise licenses for cost-effective access to the report.
13. Are there any additional resources or data provided in the PU Coatings Market report?
While the report offers comprehensive insights, it's advisable to review the specific contents or supplementary materials provided to ascertain if additional resources or data are available.
14. How can I stay updated on further developments or reports in the PU Coatings Market?
To stay informed about further developments, trends, and reports in the PU Coatings Market, consider subscribing to industry newsletters, following relevant companies and organizations, or regularly checking reputable industry news sources and publications.
Methodology
Step 1 - Identification of Relevant Samples Size from Population Database


Step 2 - Approaches for Defining Global Market Size (Value, Volume* & Price*)

Note*: In applicable scenarios
Step 3 - Data Sources
Primary Research
- Web Analytics
- Survey Reports
- Research Institute
- Latest Research Reports
- Opinion Leaders
Secondary Research
- Annual Reports
- White Paper
- Latest Press Release
- Industry Association
- Paid Database
- Investor Presentations

Step 4 - Data Triangulation
Involves using different sources of information in order to increase the validity of a study
These sources are likely to be stakeholders in a program - participants, other researchers, program staff, other community members, and so on.
Then we put all data in single framework & apply various statistical tools to find out the dynamic on the market.
During the analysis stage, feedback from the stakeholder groups would be compared to determine areas of agreement as well as areas of divergence


