
Key Insights
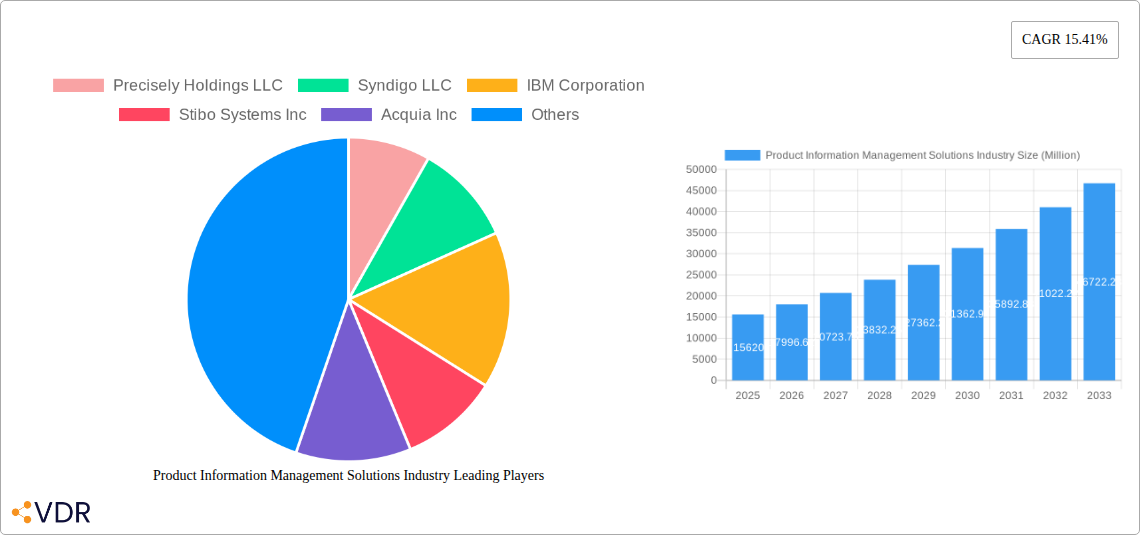
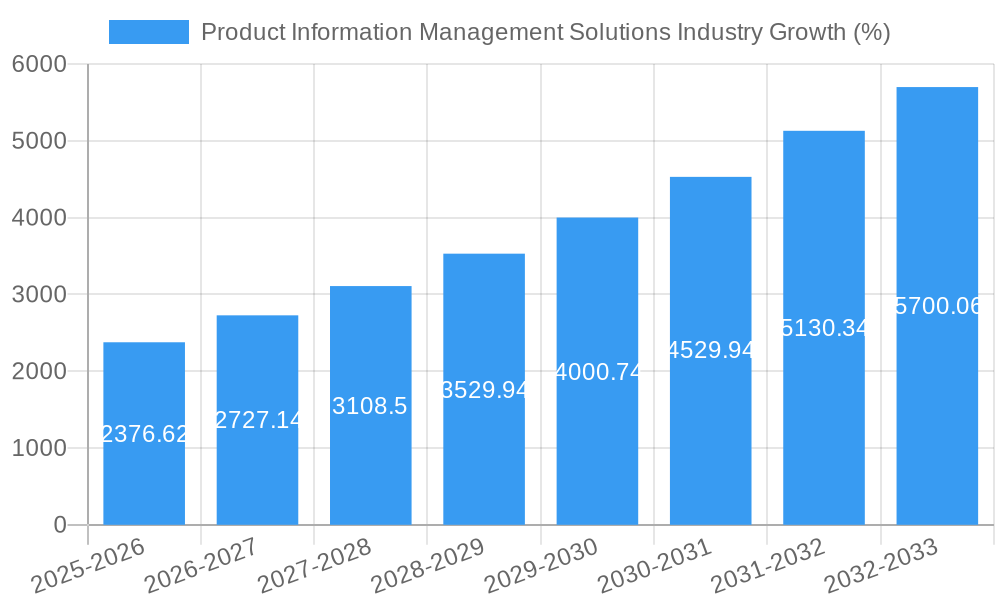
The Product Information Management (PIM) solutions market is experiencing robust growth, projected to reach $15.62 billion in 2025 and maintain a Compound Annual Growth Rate (CAGR) of 15.41% from 2025 to 2033. This expansion is fueled by several key drivers. The increasing need for businesses to manage vast amounts of product data efficiently across multiple channels (e-commerce, marketplaces, catalogs) is paramount. Furthermore, the rising demand for enhanced customer experiences, driven by personalized product information and accurate, consistent data across all touchpoints, is significantly boosting market adoption. Globalization and the expansion of e-commerce into new markets are also contributing factors, requiring sophisticated PIM solutions to manage diverse product information in multiple languages and formats. The shift towards cloud-based deployments offers scalability and cost-effectiveness, further accelerating market growth. Leading companies like Precisely Holdings, Syndigo, IBM, and others are capitalizing on these trends, offering a range of PIM solutions catering to diverse industry needs, including BFSI, media and entertainment, retail, and healthcare. Competition is intensifying with continuous innovation in areas such as AI-powered data enrichment and improved integration capabilities.
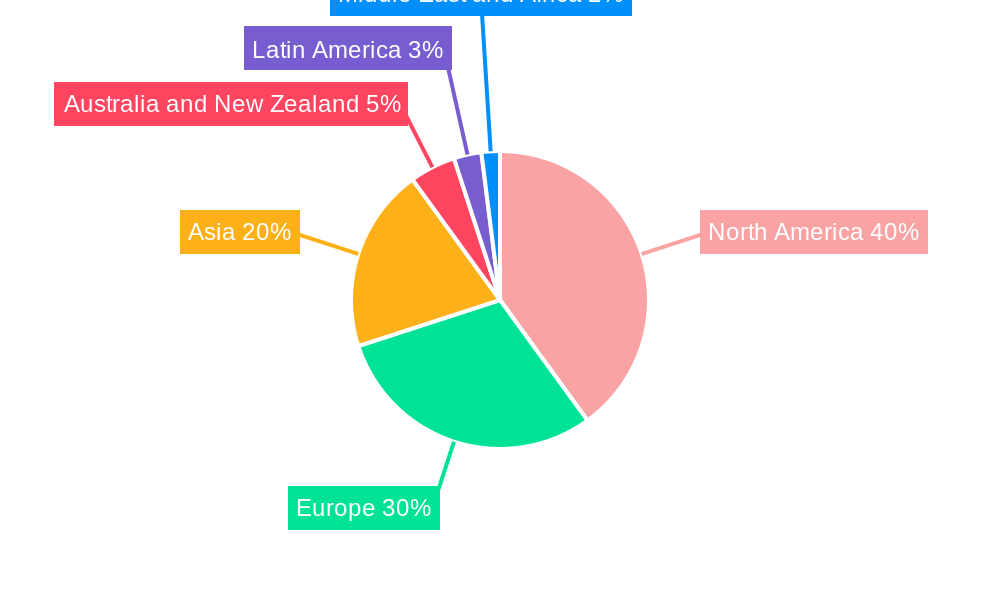
The market segmentation reveals a strong preference for cloud-based PIM solutions, reflecting the industry's ongoing digital transformation. Service offerings are also gaining traction, indicating a growing need for expert support and implementation services alongside the core PIM software. While North America currently holds a significant market share, the Asia-Pacific region is expected to witness rapid growth in the coming years, driven by increasing e-commerce penetration and digital adoption in emerging economies. However, factors such as the high initial investment costs associated with implementing PIM solutions and the complexity of data integration across different systems could potentially restrain market growth to some extent. Nevertheless, the long-term outlook for the PIM solutions market remains positive, driven by continuous technological advancements and the ever-increasing demand for efficient product information management across all industries.
Product Information Management (PIM) Solutions Market Report: 2019-2033
This comprehensive report provides a detailed analysis of the Product Information Management (PIM) Solutions market, encompassing market dynamics, growth trends, regional dominance, product landscape, key players, and future outlook. The study period covers 2019-2033, with 2025 as the base year and a forecast period of 2025-2033. The report segments the market by deployment (cloud, on-premise), offering (solution, services), and end-user industry (BFSI, Media & Entertainment, Retail, Energy & Utilities, Healthcare, IT & Telecommunications, Transportation & Logistics, Other). The market size is valued in millions of units.
Product Information Management Solutions Industry Market Dynamics & Structure
The Product Information Management (PIM) solutions market is characterized by a moderately concentrated landscape with several major players and numerous niche providers. Market concentration is influenced by factors such as technological innovation, regulatory compliance, and the emergence of substitute solutions like Master Data Management (MDM) systems. The market is driven by the increasing need for accurate, consistent, and enriched product information across diverse sales channels – a critical requirement for businesses seeking to enhance customer experience and optimize operations.
- Market Concentration: The top 5 players hold approximately xx% of the market share in 2025, indicating moderate consolidation.
- Technological Innovation: Continuous advancements in AI, machine learning, and cloud computing are driving the development of sophisticated PIM solutions with enhanced capabilities in data enrichment, syndication, and analytics.
- Regulatory Frameworks: Compliance requirements related to data privacy (e.g., GDPR) and product labeling are pushing businesses towards robust PIM solutions to ensure data accuracy and regulatory adherence.
- Competitive Substitutes: Master Data Management (MDM) and Enterprise Resource Planning (ERP) systems offer some overlapping functionalities, presenting a degree of competition.
- End-User Demographics: The market is driven by a diverse range of end-users, with significant growth expected from e-commerce businesses, large enterprises, and companies with complex product catalogs.
- M&A Trends: The market has witnessed xx M&A deals in the historical period (2019-2024), reflecting consolidation and strategic expansion efforts among key players.
Product Information Management Solutions Industry Growth Trends & Insights
The global Product Information Management (PIM) solutions market is experiencing robust growth, driven by the increasing demand for efficient product information management across diverse channels and industries. The market size is projected to reach xx million units by 2033, exhibiting a CAGR of xx% during the forecast period (2025-2033). This growth is fueled by factors such as the rise of e-commerce, globalization, and the increasing complexity of product catalogs. The adoption rate of cloud-based PIM solutions is significantly higher compared to on-premise solutions, reflecting the advantages of scalability, cost-effectiveness, and ease of access. Technological disruptions, such as the integration of AI and machine learning capabilities into PIM platforms, are further accelerating market growth. Consumer behavior shifts towards personalized experiences and omnichannel engagement are also driving the adoption of PIM solutions.
Dominant Regions, Countries, or Segments in Product Information Management Solutions Industry
North America currently holds the largest market share, driven by high technological adoption rates, strong e-commerce penetration, and the presence of major PIM solution providers. However, the Asia-Pacific region is expected to witness the highest growth rate during the forecast period, fueled by increasing e-commerce adoption and economic expansion across several key markets.
- By Deployment: The cloud segment dominates the market, driven by its scalability, cost-effectiveness, and accessibility.
- By Offering: The solution segment holds a larger market share compared to services, reflecting the high demand for comprehensive PIM platforms.
- By End-user Industry: The Retail and BFSI sectors are the primary drivers of market growth due to their large product catalogs and need for accurate product information across multiple sales channels.
Product Information Management Solutions Industry Product Landscape
The PIM solutions market offers a range of products with varying functionalities and features. Leading providers offer cloud-based, on-premise, and hybrid deployment options, catering to diverse business needs and IT infrastructures. Key product innovations include AI-powered data enrichment, automated workflows, and advanced analytics capabilities. These advancements enhance data accuracy, improve operational efficiency, and drive better decision-making. The unique selling propositions often revolve around ease of use, scalability, integration capabilities, and robust data governance features.
Key Drivers, Barriers & Challenges in Product Information Management Solutions Industry
Key Drivers:
- The rise of e-commerce and omnichannel commerce is significantly driving the demand for effective PIM solutions.
- The need for accurate and consistent product information across all sales channels is paramount.
- Growing regulatory compliance requirements are pushing businesses to implement robust PIM solutions.
Key Challenges & Restraints:
- High initial investment costs and ongoing maintenance expenses can be a barrier for smaller businesses.
- Integration with existing enterprise systems can be complex and time-consuming.
- The need for specialized expertise to implement and manage PIM solutions poses a challenge for some organizations. The competitive landscape impacts market growth through pricing pressure and feature differentiation struggles, impacting smaller players.
Emerging Opportunities in Product Information Management Solutions Industry
- Expanding into untapped markets in developing economies.
- Integrating PIM solutions with emerging technologies like AR/VR and IoT.
- Development of PIM solutions tailored to specific industry needs (e.g., healthcare, manufacturing).
Growth Accelerators in the Product Information Management Solutions Industry
Technological breakthroughs in AI, machine learning, and cloud computing are key drivers of growth. Strategic partnerships between PIM providers and other technology vendors will expand market reach and enhance product capabilities. Market expansion strategies targeting underpenetrated segments and geographical regions will further stimulate growth.
Key Players Shaping the Product Information Management Solutions Industry Market
- Precisely Holdings LLC
- Syndigo LLC
- IBM Corporation
- Stibo Systems Inc
- Acquia Inc
- Pimcore GMBH
- Salsify Inc
- Akeneo SAS
- InRiver AB
- Informatica LLC
- Plytix Limited
- SAP SE
- Insight Software
Notable Milestones in Product Information Management Solutions Industry Sector
- March 2024: Akeneo launched the Akeneo PIM App for Salesforce on Salesforce AppExchange, enhancing product information management capabilities within the Salesforce ecosystem.
- February 2024: Salsify released Salsify PXM Advance, a new platform version improving product experience management operations.
In-Depth Product Information Management Solutions Industry Market Outlook
The PIM solutions market is poised for continued growth, driven by technological advancements and expanding adoption across diverse industries. Strategic opportunities lie in developing specialized PIM solutions, enhancing integration capabilities, and leveraging AI/ML to improve data quality and automation. The market will likely see increased consolidation as companies seek to expand their market share and offer comprehensive solutions.
Product Information Management Solutions Industry Segmentation
-
1. Deployment
- 1.1. Cloud
- 1.2. On-premise
-
2. Offering
- 2.1. Solution
- 2.2. Services
-
3. End-user Industry
- 3.1. BFSI
- 3.2. Media and Entertainment
- 3.3. Retail
- 3.4. Energy and Utilities
- 3.5. Healthcare
- 3.6. IT and Telecommunications
- 3.7. Transportation and Logistics
- 3.8. Other End-user Industries
Product Information Management Solutions Industry Segmentation By Geography
- 1. North America
- 2. Europe
- 3. Asia
- 4. Australia and New Zealand
- 5. Latin America
- 6. Middle East and Africa
Product Information Management Solutions Industry REPORT HIGHLIGHTS
| Aspects | Details |
|---|---|
| Study Period | 2019-2033 |
| Base Year | 2024 |
| Estimated Year | 2025 |
| Forecast Period | 2025-2033 |
| Historical Period | 2019-2024 |
| Growth Rate | CAGR of 15.41% from 2019-2033 |
| Segmentation |
|
Table of Contents
- 1. Introduction
- 1.1. Research Scope
- 1.2. Market Segmentation
- 1.3. Research Methodology
- 1.4. Definitions and Assumptions
- 2. Executive Summary
- 2.1. Introduction
- 3. Market Dynamics
- 3.1. Introduction
- 3.2. Market Drivers
- 3.2.1. Growing Demand for Better Customer Service; Growing Demand for Centralized Data Management Tools
- 3.3. Market Restrains
- 3.3.1. Increasing Data Breaching Cases
- 3.4. Market Trends
- 3.4.1. Retail Sector to Witness Growth
- 4. Market Factor Analysis
- 4.1. Porters Five Forces
- 4.2. Supply/Value Chain
- 4.3. PESTEL analysis
- 4.4. Market Entropy
- 4.5. Patent/Trademark Analysis
- 5. Global Product Information Management Solutions Industry Analysis, Insights and Forecast, 2019-2031
- 5.1. Market Analysis, Insights and Forecast - by Deployment
- 5.1.1. Cloud
- 5.1.2. On-premise
- 5.2. Market Analysis, Insights and Forecast - by Offering
- 5.2.1. Solution
- 5.2.2. Services
- 5.3. Market Analysis, Insights and Forecast - by End-user Industry
- 5.3.1. BFSI
- 5.3.2. Media and Entertainment
- 5.3.3. Retail
- 5.3.4. Energy and Utilities
- 5.3.5. Healthcare
- 5.3.6. IT and Telecommunications
- 5.3.7. Transportation and Logistics
- 5.3.8. Other End-user Industries
- 5.4. Market Analysis, Insights and Forecast - by Region
- 5.4.1. North America
- 5.4.2. Europe
- 5.4.3. Asia
- 5.4.4. Australia and New Zealand
- 5.4.5. Latin America
- 5.4.6. Middle East and Africa
- 5.1. Market Analysis, Insights and Forecast - by Deployment
- 6. North America Product Information Management Solutions Industry Analysis, Insights and Forecast, 2019-2031
- 6.1. Market Analysis, Insights and Forecast - by Deployment
- 6.1.1. Cloud
- 6.1.2. On-premise
- 6.2. Market Analysis, Insights and Forecast - by Offering
- 6.2.1. Solution
- 6.2.2. Services
- 6.3. Market Analysis, Insights and Forecast - by End-user Industry
- 6.3.1. BFSI
- 6.3.2. Media and Entertainment
- 6.3.3. Retail
- 6.3.4. Energy and Utilities
- 6.3.5. Healthcare
- 6.3.6. IT and Telecommunications
- 6.3.7. Transportation and Logistics
- 6.3.8. Other End-user Industries
- 6.1. Market Analysis, Insights and Forecast - by Deployment
- 7. Europe Product Information Management Solutions Industry Analysis, Insights and Forecast, 2019-2031
- 7.1. Market Analysis, Insights and Forecast - by Deployment
- 7.1.1. Cloud
- 7.1.2. On-premise
- 7.2. Market Analysis, Insights and Forecast - by Offering
- 7.2.1. Solution
- 7.2.2. Services
- 7.3. Market Analysis, Insights and Forecast - by End-user Industry
- 7.3.1. BFSI
- 7.3.2. Media and Entertainment
- 7.3.3. Retail
- 7.3.4. Energy and Utilities
- 7.3.5. Healthcare
- 7.3.6. IT and Telecommunications
- 7.3.7. Transportation and Logistics
- 7.3.8. Other End-user Industries
- 7.1. Market Analysis, Insights and Forecast - by Deployment
- 8. Asia Product Information Management Solutions Industry Analysis, Insights and Forecast, 2019-2031
- 8.1. Market Analysis, Insights and Forecast - by Deployment
- 8.1.1. Cloud
- 8.1.2. On-premise
- 8.2. Market Analysis, Insights and Forecast - by Offering
- 8.2.1. Solution
- 8.2.2. Services
- 8.3. Market Analysis, Insights and Forecast - by End-user Industry
- 8.3.1. BFSI
- 8.3.2. Media and Entertainment
- 8.3.3. Retail
- 8.3.4. Energy and Utilities
- 8.3.5. Healthcare
- 8.3.6. IT and Telecommunications
- 8.3.7. Transportation and Logistics
- 8.3.8. Other End-user Industries
- 8.1. Market Analysis, Insights and Forecast - by Deployment
- 9. Australia and New Zealand Product Information Management Solutions Industry Analysis, Insights and Forecast, 2019-2031
- 9.1. Market Analysis, Insights and Forecast - by Deployment
- 9.1.1. Cloud
- 9.1.2. On-premise
- 9.2. Market Analysis, Insights and Forecast - by Offering
- 9.2.1. Solution
- 9.2.2. Services
- 9.3. Market Analysis, Insights and Forecast - by End-user Industry
- 9.3.1. BFSI
- 9.3.2. Media and Entertainment
- 9.3.3. Retail
- 9.3.4. Energy and Utilities
- 9.3.5. Healthcare
- 9.3.6. IT and Telecommunications
- 9.3.7. Transportation and Logistics
- 9.3.8. Other End-user Industries
- 9.1. Market Analysis, Insights and Forecast - by Deployment
- 10. Latin America Product Information Management Solutions Industry Analysis, Insights and Forecast, 2019-2031
- 10.1. Market Analysis, Insights and Forecast - by Deployment
- 10.1.1. Cloud
- 10.1.2. On-premise
- 10.2. Market Analysis, Insights and Forecast - by Offering
- 10.2.1. Solution
- 10.2.2. Services
- 10.3. Market Analysis, Insights and Forecast - by End-user Industry
- 10.3.1. BFSI
- 10.3.2. Media and Entertainment
- 10.3.3. Retail
- 10.3.4. Energy and Utilities
- 10.3.5. Healthcare
- 10.3.6. IT and Telecommunications
- 10.3.7. Transportation and Logistics
- 10.3.8. Other End-user Industries
- 10.1. Market Analysis, Insights and Forecast - by Deployment
- 11. Middle East and Africa Product Information Management Solutions Industry Analysis, Insights and Forecast, 2019-2031
- 11.1. Market Analysis, Insights and Forecast - by Deployment
- 11.1.1. Cloud
- 11.1.2. On-premise
- 11.2. Market Analysis, Insights and Forecast - by Offering
- 11.2.1. Solution
- 11.2.2. Services
- 11.3. Market Analysis, Insights and Forecast - by End-user Industry
- 11.3.1. BFSI
- 11.3.2. Media and Entertainment
- 11.3.3. Retail
- 11.3.4. Energy and Utilities
- 11.3.5. Healthcare
- 11.3.6. IT and Telecommunications
- 11.3.7. Transportation and Logistics
- 11.3.8. Other End-user Industries
- 11.1. Market Analysis, Insights and Forecast - by Deployment
- 12. North America Product Information Management Solutions Industry Analysis, Insights and Forecast, 2019-2031
- 12.1. Market Analysis, Insights and Forecast - By Country/Sub-region
- 12.1.1.
- 13. Europe Product Information Management Solutions Industry Analysis, Insights and Forecast, 2019-2031
- 13.1. Market Analysis, Insights and Forecast - By Country/Sub-region
- 13.1.1.
- 14. Asia Product Information Management Solutions Industry Analysis, Insights and Forecast, 2019-2031
- 14.1. Market Analysis, Insights and Forecast - By Country/Sub-region
- 14.1.1.
- 15. Australia and New Zealand Product Information Management Solutions Industry Analysis, Insights and Forecast, 2019-2031
- 15.1. Market Analysis, Insights and Forecast - By Country/Sub-region
- 15.1.1.
- 16. Latin America Product Information Management Solutions Industry Analysis, Insights and Forecast, 2019-2031
- 16.1. Market Analysis, Insights and Forecast - By Country/Sub-region
- 16.1.1.
- 17. Middle East and Africa Product Information Management Solutions Industry Analysis, Insights and Forecast, 2019-2031
- 17.1. Market Analysis, Insights and Forecast - By Country/Sub-region
- 17.1.1.
- 18. Competitive Analysis
- 18.1. Global Market Share Analysis 2024
- 18.2. Company Profiles
- 18.2.1 Precisely Holdings LLC
- 18.2.1.1. Overview
- 18.2.1.2. Products
- 18.2.1.3. SWOT Analysis
- 18.2.1.4. Recent Developments
- 18.2.1.5. Financials (Based on Availability)
- 18.2.2 Syndigo LLC
- 18.2.2.1. Overview
- 18.2.2.2. Products
- 18.2.2.3. SWOT Analysis
- 18.2.2.4. Recent Developments
- 18.2.2.5. Financials (Based on Availability)
- 18.2.3 IBM Corporation
- 18.2.3.1. Overview
- 18.2.3.2. Products
- 18.2.3.3. SWOT Analysis
- 18.2.3.4. Recent Developments
- 18.2.3.5. Financials (Based on Availability)
- 18.2.4 Stibo Systems Inc
- 18.2.4.1. Overview
- 18.2.4.2. Products
- 18.2.4.3. SWOT Analysis
- 18.2.4.4. Recent Developments
- 18.2.4.5. Financials (Based on Availability)
- 18.2.5 Acquia Inc
- 18.2.5.1. Overview
- 18.2.5.2. Products
- 18.2.5.3. SWOT Analysis
- 18.2.5.4. Recent Developments
- 18.2.5.5. Financials (Based on Availability)
- 18.2.6 Pimcore GMBH
- 18.2.6.1. Overview
- 18.2.6.2. Products
- 18.2.6.3. SWOT Analysis
- 18.2.6.4. Recent Developments
- 18.2.6.5. Financials (Based on Availability)
- 18.2.7 Salsify Inc
- 18.2.7.1. Overview
- 18.2.7.2. Products
- 18.2.7.3. SWOT Analysis
- 18.2.7.4. Recent Developments
- 18.2.7.5. Financials (Based on Availability)
- 18.2.8 Akeneo SAS
- 18.2.8.1. Overview
- 18.2.8.2. Products
- 18.2.8.3. SWOT Analysis
- 18.2.8.4. Recent Developments
- 18.2.8.5. Financials (Based on Availability)
- 18.2.9 InRiver AB
- 18.2.9.1. Overview
- 18.2.9.2. Products
- 18.2.9.3. SWOT Analysis
- 18.2.9.4. Recent Developments
- 18.2.9.5. Financials (Based on Availability)
- 18.2.10 Informatica LLC
- 18.2.10.1. Overview
- 18.2.10.2. Products
- 18.2.10.3. SWOT Analysis
- 18.2.10.4. Recent Developments
- 18.2.10.5. Financials (Based on Availability)
- 18.2.11 Plytix Limited
- 18.2.11.1. Overview
- 18.2.11.2. Products
- 18.2.11.3. SWOT Analysis
- 18.2.11.4. Recent Developments
- 18.2.11.5. Financials (Based on Availability)
- 18.2.12 SAP SE
- 18.2.12.1. Overview
- 18.2.12.2. Products
- 18.2.12.3. SWOT Analysis
- 18.2.12.4. Recent Developments
- 18.2.12.5. Financials (Based on Availability)
- 18.2.13 Insight Software
- 18.2.13.1. Overview
- 18.2.13.2. Products
- 18.2.13.3. SWOT Analysis
- 18.2.13.4. Recent Developments
- 18.2.13.5. Financials (Based on Availability)
- 18.2.1 Precisely Holdings LLC
List of Figures
- Figure 1: Global Product Information Management Solutions Industry Revenue Breakdown (Million, %) by Region 2024 & 2032
- Figure 2: North America Product Information Management Solutions Industry Revenue (Million), by Country 2024 & 2032
- Figure 3: North America Product Information Management Solutions Industry Revenue Share (%), by Country 2024 & 2032
- Figure 4: Europe Product Information Management Solutions Industry Revenue (Million), by Country 2024 & 2032
- Figure 5: Europe Product Information Management Solutions Industry Revenue Share (%), by Country 2024 & 2032
- Figure 6: Asia Product Information Management Solutions Industry Revenue (Million), by Country 2024 & 2032
- Figure 7: Asia Product Information Management Solutions Industry Revenue Share (%), by Country 2024 & 2032
- Figure 8: Australia and New Zealand Product Information Management Solutions Industry Revenue (Million), by Country 2024 & 2032
- Figure 9: Australia and New Zealand Product Information Management Solutions Industry Revenue Share (%), by Country 2024 & 2032
- Figure 10: Latin America Product Information Management Solutions Industry Revenue (Million), by Country 2024 & 2032
- Figure 11: Latin America Product Information Management Solutions Industry Revenue Share (%), by Country 2024 & 2032
- Figure 12: Middle East and Africa Product Information Management Solutions Industry Revenue (Million), by Country 2024 & 2032
- Figure 13: Middle East and Africa Product Information Management Solutions Industry Revenue Share (%), by Country 2024 & 2032
- Figure 14: North America Product Information Management Solutions Industry Revenue (Million), by Deployment 2024 & 2032
- Figure 15: North America Product Information Management Solutions Industry Revenue Share (%), by Deployment 2024 & 2032
- Figure 16: North America Product Information Management Solutions Industry Revenue (Million), by Offering 2024 & 2032
- Figure 17: North America Product Information Management Solutions Industry Revenue Share (%), by Offering 2024 & 2032
- Figure 18: North America Product Information Management Solutions Industry Revenue (Million), by End-user Industry 2024 & 2032
- Figure 19: North America Product Information Management Solutions Industry Revenue Share (%), by End-user Industry 2024 & 2032
- Figure 20: North America Product Information Management Solutions Industry Revenue (Million), by Country 2024 & 2032
- Figure 21: North America Product Information Management Solutions Industry Revenue Share (%), by Country 2024 & 2032
- Figure 22: Europe Product Information Management Solutions Industry Revenue (Million), by Deployment 2024 & 2032
- Figure 23: Europe Product Information Management Solutions Industry Revenue Share (%), by Deployment 2024 & 2032
- Figure 24: Europe Product Information Management Solutions Industry Revenue (Million), by Offering 2024 & 2032
- Figure 25: Europe Product Information Management Solutions Industry Revenue Share (%), by Offering 2024 & 2032
- Figure 26: Europe Product Information Management Solutions Industry Revenue (Million), by End-user Industry 2024 & 2032
- Figure 27: Europe Product Information Management Solutions Industry Revenue Share (%), by End-user Industry 2024 & 2032
- Figure 28: Europe Product Information Management Solutions Industry Revenue (Million), by Country 2024 & 2032
- Figure 29: Europe Product Information Management Solutions Industry Revenue Share (%), by Country 2024 & 2032
- Figure 30: Asia Product Information Management Solutions Industry Revenue (Million), by Deployment 2024 & 2032
- Figure 31: Asia Product Information Management Solutions Industry Revenue Share (%), by Deployment 2024 & 2032
- Figure 32: Asia Product Information Management Solutions Industry Revenue (Million), by Offering 2024 & 2032
- Figure 33: Asia Product Information Management Solutions Industry Revenue Share (%), by Offering 2024 & 2032
- Figure 34: Asia Product Information Management Solutions Industry Revenue (Million), by End-user Industry 2024 & 2032
- Figure 35: Asia Product Information Management Solutions Industry Revenue Share (%), by End-user Industry 2024 & 2032
- Figure 36: Asia Product Information Management Solutions Industry Revenue (Million), by Country 2024 & 2032
- Figure 37: Asia Product Information Management Solutions Industry Revenue Share (%), by Country 2024 & 2032
- Figure 38: Australia and New Zealand Product Information Management Solutions Industry Revenue (Million), by Deployment 2024 & 2032
- Figure 39: Australia and New Zealand Product Information Management Solutions Industry Revenue Share (%), by Deployment 2024 & 2032
- Figure 40: Australia and New Zealand Product Information Management Solutions Industry Revenue (Million), by Offering 2024 & 2032
- Figure 41: Australia and New Zealand Product Information Management Solutions Industry Revenue Share (%), by Offering 2024 & 2032
- Figure 42: Australia and New Zealand Product Information Management Solutions Industry Revenue (Million), by End-user Industry 2024 & 2032
- Figure 43: Australia and New Zealand Product Information Management Solutions Industry Revenue Share (%), by End-user Industry 2024 & 2032
- Figure 44: Australia and New Zealand Product Information Management Solutions Industry Revenue (Million), by Country 2024 & 2032
- Figure 45: Australia and New Zealand Product Information Management Solutions Industry Revenue Share (%), by Country 2024 & 2032
- Figure 46: Latin America Product Information Management Solutions Industry Revenue (Million), by Deployment 2024 & 2032
- Figure 47: Latin America Product Information Management Solutions Industry Revenue Share (%), by Deployment 2024 & 2032
- Figure 48: Latin America Product Information Management Solutions Industry Revenue (Million), by Offering 2024 & 2032
- Figure 49: Latin America Product Information Management Solutions Industry Revenue Share (%), by Offering 2024 & 2032
- Figure 50: Latin America Product Information Management Solutions Industry Revenue (Million), by End-user Industry 2024 & 2032
- Figure 51: Latin America Product Information Management Solutions Industry Revenue Share (%), by End-user Industry 2024 & 2032
- Figure 52: Latin America Product Information Management Solutions Industry Revenue (Million), by Country 2024 & 2032
- Figure 53: Latin America Product Information Management Solutions Industry Revenue Share (%), by Country 2024 & 2032
- Figure 54: Middle East and Africa Product Information Management Solutions Industry Revenue (Million), by Deployment 2024 & 2032
- Figure 55: Middle East and Africa Product Information Management Solutions Industry Revenue Share (%), by Deployment 2024 & 2032
- Figure 56: Middle East and Africa Product Information Management Solutions Industry Revenue (Million), by Offering 2024 & 2032
- Figure 57: Middle East and Africa Product Information Management Solutions Industry Revenue Share (%), by Offering 2024 & 2032
- Figure 58: Middle East and Africa Product Information Management Solutions Industry Revenue (Million), by End-user Industry 2024 & 2032
- Figure 59: Middle East and Africa Product Information Management Solutions Industry Revenue Share (%), by End-user Industry 2024 & 2032
- Figure 60: Middle East and Africa Product Information Management Solutions Industry Revenue (Million), by Country 2024 & 2032
- Figure 61: Middle East and Africa Product Information Management Solutions Industry Revenue Share (%), by Country 2024 & 2032
List of Tables
- Table 1: Global Product Information Management Solutions Industry Revenue Million Forecast, by Region 2019 & 2032
- Table 2: Global Product Information Management Solutions Industry Revenue Million Forecast, by Deployment 2019 & 2032
- Table 3: Global Product Information Management Solutions Industry Revenue Million Forecast, by Offering 2019 & 2032
- Table 4: Global Product Information Management Solutions Industry Revenue Million Forecast, by End-user Industry 2019 & 2032
- Table 5: Global Product Information Management Solutions Industry Revenue Million Forecast, by Region 2019 & 2032
- Table 6: Global Product Information Management Solutions Industry Revenue Million Forecast, by Country 2019 & 2032
- Table 7: Product Information Management Solutions Industry Revenue (Million) Forecast, by Application 2019 & 2032
- Table 8: Global Product Information Management Solutions Industry Revenue Million Forecast, by Country 2019 & 2032
- Table 9: Product Information Management Solutions Industry Revenue (Million) Forecast, by Application 2019 & 2032
- Table 10: Global Product Information Management Solutions Industry Revenue Million Forecast, by Country 2019 & 2032
- Table 11: Product Information Management Solutions Industry Revenue (Million) Forecast, by Application 2019 & 2032
- Table 12: Global Product Information Management Solutions Industry Revenue Million Forecast, by Country 2019 & 2032
- Table 13: Product Information Management Solutions Industry Revenue (Million) Forecast, by Application 2019 & 2032
- Table 14: Global Product Information Management Solutions Industry Revenue Million Forecast, by Country 2019 & 2032
- Table 15: Product Information Management Solutions Industry Revenue (Million) Forecast, by Application 2019 & 2032
- Table 16: Global Product Information Management Solutions Industry Revenue Million Forecast, by Country 2019 & 2032
- Table 17: Product Information Management Solutions Industry Revenue (Million) Forecast, by Application 2019 & 2032
- Table 18: Global Product Information Management Solutions Industry Revenue Million Forecast, by Deployment 2019 & 2032
- Table 19: Global Product Information Management Solutions Industry Revenue Million Forecast, by Offering 2019 & 2032
- Table 20: Global Product Information Management Solutions Industry Revenue Million Forecast, by End-user Industry 2019 & 2032
- Table 21: Global Product Information Management Solutions Industry Revenue Million Forecast, by Country 2019 & 2032
- Table 22: Global Product Information Management Solutions Industry Revenue Million Forecast, by Deployment 2019 & 2032
- Table 23: Global Product Information Management Solutions Industry Revenue Million Forecast, by Offering 2019 & 2032
- Table 24: Global Product Information Management Solutions Industry Revenue Million Forecast, by End-user Industry 2019 & 2032
- Table 25: Global Product Information Management Solutions Industry Revenue Million Forecast, by Country 2019 & 2032
- Table 26: Global Product Information Management Solutions Industry Revenue Million Forecast, by Deployment 2019 & 2032
- Table 27: Global Product Information Management Solutions Industry Revenue Million Forecast, by Offering 2019 & 2032
- Table 28: Global Product Information Management Solutions Industry Revenue Million Forecast, by End-user Industry 2019 & 2032
- Table 29: Global Product Information Management Solutions Industry Revenue Million Forecast, by Country 2019 & 2032
- Table 30: Global Product Information Management Solutions Industry Revenue Million Forecast, by Deployment 2019 & 2032
- Table 31: Global Product Information Management Solutions Industry Revenue Million Forecast, by Offering 2019 & 2032
- Table 32: Global Product Information Management Solutions Industry Revenue Million Forecast, by End-user Industry 2019 & 2032
- Table 33: Global Product Information Management Solutions Industry Revenue Million Forecast, by Country 2019 & 2032
- Table 34: Global Product Information Management Solutions Industry Revenue Million Forecast, by Deployment 2019 & 2032
- Table 35: Global Product Information Management Solutions Industry Revenue Million Forecast, by Offering 2019 & 2032
- Table 36: Global Product Information Management Solutions Industry Revenue Million Forecast, by End-user Industry 2019 & 2032
- Table 37: Global Product Information Management Solutions Industry Revenue Million Forecast, by Country 2019 & 2032
- Table 38: Global Product Information Management Solutions Industry Revenue Million Forecast, by Deployment 2019 & 2032
- Table 39: Global Product Information Management Solutions Industry Revenue Million Forecast, by Offering 2019 & 2032
- Table 40: Global Product Information Management Solutions Industry Revenue Million Forecast, by End-user Industry 2019 & 2032
- Table 41: Global Product Information Management Solutions Industry Revenue Million Forecast, by Country 2019 & 2032
Frequently Asked Questions
1. What is the projected Compound Annual Growth Rate (CAGR) of the Product Information Management Solutions Industry?
The projected CAGR is approximately 15.41%.
2. Which companies are prominent players in the Product Information Management Solutions Industry?
Key companies in the market include Precisely Holdings LLC, Syndigo LLC, IBM Corporation, Stibo Systems Inc, Acquia Inc, Pimcore GMBH, Salsify Inc, Akeneo SAS, InRiver AB, Informatica LLC, Plytix Limited, SAP SE, Insight Software.
3. What are the main segments of the Product Information Management Solutions Industry?
The market segments include Deployment, Offering, End-user Industry.
4. Can you provide details about the market size?
The market size is estimated to be USD 15.62 Million as of 2022.
5. What are some drivers contributing to market growth?
Growing Demand for Better Customer Service; Growing Demand for Centralized Data Management Tools.
6. What are the notable trends driving market growth?
Retail Sector to Witness Growth.
7. Are there any restraints impacting market growth?
Increasing Data Breaching Cases.
8. Can you provide examples of recent developments in the market?
March 2024 - Akeneo announced it had launched the Akeneo PIM App for Salesforce on Salesforce AppExchange, an enterprise marketplace for partner apps and experts. The Akeneo App for Salesforce empowers customers to leverage complete, compelling, and consistent product information to unlock the full potential of Salesforce. Akeneo’s Product Cloud enables businesses to ingest, normalize, enrich, and centralize product information through enterprise-grade data modeling, governance, and workflows.
9. What pricing options are available for accessing the report?
Pricing options include single-user, multi-user, and enterprise licenses priced at USD 4750, USD 5250, and USD 8750 respectively.
10. Is the market size provided in terms of value or volume?
The market size is provided in terms of value, measured in Million.
11. Are there any specific market keywords associated with the report?
Yes, the market keyword associated with the report is "Product Information Management Solutions Industry," which aids in identifying and referencing the specific market segment covered.
12. How do I determine which pricing option suits my needs best?
The pricing options vary based on user requirements and access needs. Individual users may opt for single-user licenses, while businesses requiring broader access may choose multi-user or enterprise licenses for cost-effective access to the report.
13. Are there any additional resources or data provided in the Product Information Management Solutions Industry report?
While the report offers comprehensive insights, it's advisable to review the specific contents or supplementary materials provided to ascertain if additional resources or data are available.
14. How can I stay updated on further developments or reports in the Product Information Management Solutions Industry?
To stay informed about further developments, trends, and reports in the Product Information Management Solutions Industry, consider subscribing to industry newsletters, following relevant companies and organizations, or regularly checking reputable industry news sources and publications.
Methodology
Step 1 - Identification of Relevant Samples Size from Population Database


Step 2 - Approaches for Defining Global Market Size (Value, Volume* & Price*)

Note*: In applicable scenarios
Step 3 - Data Sources
Primary Research
- Web Analytics
- Survey Reports
- Research Institute
- Latest Research Reports
- Opinion Leaders
Secondary Research
- Annual Reports
- White Paper
- Latest Press Release
- Industry Association
- Paid Database
- Investor Presentations

Step 4 - Data Triangulation
Involves using different sources of information in order to increase the validity of a study
These sources are likely to be stakeholders in a program - participants, other researchers, program staff, other community members, and so on.
Then we put all data in single framework & apply various statistical tools to find out the dynamic on the market.
During the analysis stage, feedback from the stakeholder groups would be compared to determine areas of agreement as well as areas of divergence


