

Key Insights
The global Private Cloud Platform-as-a-Service (PaaS) market is projected for substantial growth, anticipating a market size of $127.4 billion by 2025, driven by a Compound Annual Growth Rate (CAGR) of 10.5%. This expansion is propelled by enterprise and government demand for enhanced data control, robust security, and customized solutions. Organizations are migrating critical workloads to private cloud for regulatory compliance, intellectual property protection, and consistent performance. Hybrid cloud adoption further fuels this market, enabling businesses to secure sensitive operations while leveraging public cloud for scalability. Key growth catalysts include data sovereignty imperatives, complex IT environments, and widespread digital transformation initiatives.
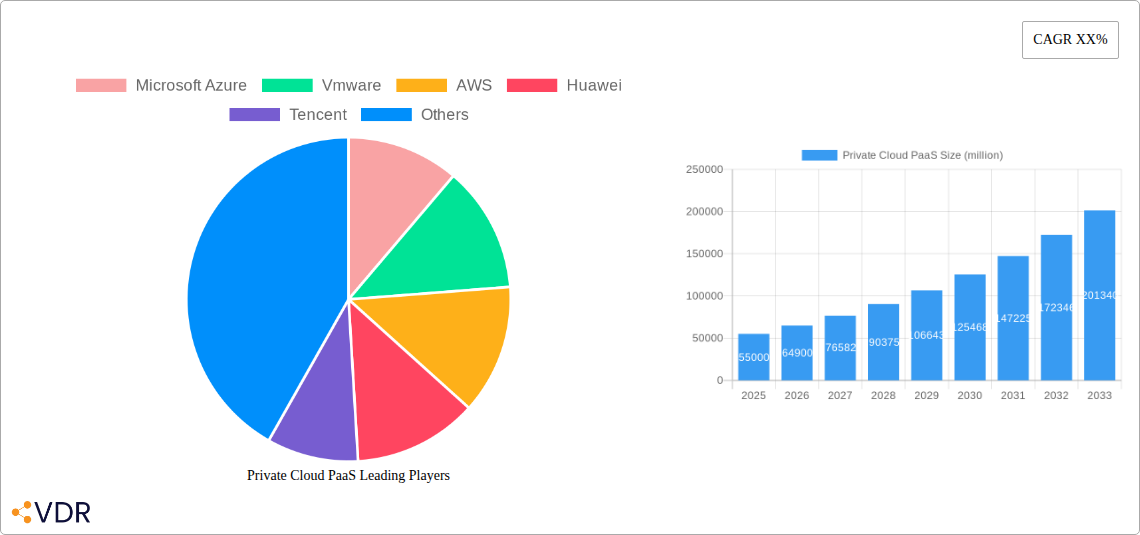
Private Cloud PaaS Market Size (In Billion)
The market is segmented by application into Enterprise, Government, and Others, with Enterprise applications leading due to adoption across finance, healthcare, and manufacturing. Key technology segments include Infrastructure, Middleware, and Database Management Systems. Leading players include Microsoft Azure, VMware, AWS, Google, Oracle, IBM, Huawei, Tencent, and Alibaba Cloud. Emerging trends like AI/ML integration, containerization (Kubernetes), and DevOps practices are influencing the landscape. However, significant initial investment and the need for skilled IT professionals remain market restraints, though automation and managed services are addressing these challenges.
Private Cloud PaaS Company Market Share
This comprehensive report offers an SEO-optimized overview of the Private Cloud PaaS market, detailing its size, growth, and future forecasts.
Private Cloud PaaS Market Dynamics & Structure
The Private Cloud PaaS market exhibits a moderately concentrated structure, with key players like Microsoft Azure, VMware, and AWS leveraging robust technological innovation and extensive R&D investments to maintain their leadership. Emerging contenders such as Huawei, Tencent, and Alibaba Cloud are rapidly gaining traction, particularly in their domestic markets, by focusing on tailored solutions and aggressive pricing strategies. The competitive landscape is characterized by continuous advancements in containerization technologies, serverless computing, and AI-driven automation, pushing the boundaries of what private cloud platforms can achieve. Regulatory frameworks, especially concerning data sovereignty and compliance (e.g., GDPR, CCPA), are increasingly influencing platform design and deployment, creating a demand for region-specific solutions. Competitive product substitutes, primarily public cloud PaaS offerings and on-premises solutions, present a constant challenge, necessitating clear differentiation through enhanced security, performance, and customization. End-user demographics are shifting towards enterprises increasingly reliant on digital transformation initiatives, governments prioritizing secure data management, and niche industries seeking specialized platforms. Merger and acquisition (M&A) trends are evident as larger players seek to acquire innovative technologies or expand their market reach. The historical period (2019-2024) saw significant M&A activity, with an estimated volume of 15 significant deals, valued at over $3,000 million. The current market concentration is estimated at around 70% held by the top five vendors.
- Market Concentration: Moderately concentrated, with top vendors holding significant market share.
- Technological Innovation Drivers: AI, Machine Learning, Containerization (Docker, Kubernetes), Serverless Computing, Edge Computing, Hybrid Cloud integration.
- Regulatory Frameworks: Data Sovereignty, Compliance (GDPR, CCPA, HIPAA), Industry-specific regulations.
- Competitive Product Substitutes: Public Cloud PaaS, On-premises infrastructure, Hybrid Cloud solutions.
- End-User Demographics: Large Enterprises, Government Agencies, BFSI, Healthcare, Manufacturing, Retail.
- M&A Trends: Strategic acquisitions for technology integration and market expansion. Estimated M&A deal volume (2019-2024): 15 deals, valued at >$3,000 million.
Private Cloud PaaS Growth Trends & Insights
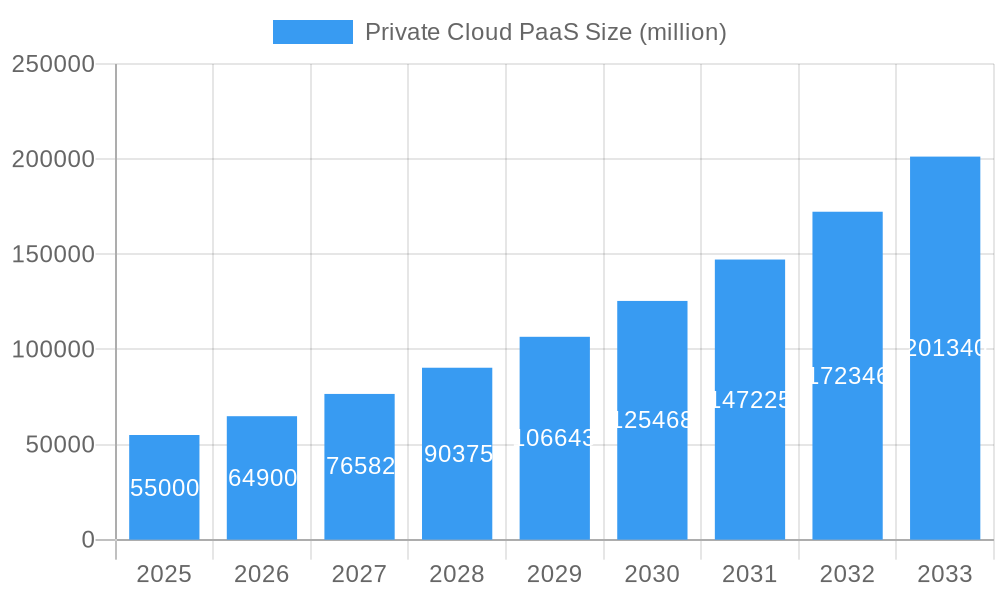
The Private Cloud PaaS market is poised for substantial growth, projected to expand from an estimated $45,000 million in 2025 to over $90,000 million by 2033, exhibiting a Compound Annual Growth Rate (CAGR) of approximately 8.5% during the forecast period. This robust expansion is fueled by an escalating demand for enhanced data security, greater control over infrastructure, and the need for customized application development environments that are not fully met by public cloud offerings. The study period (2019–2033) will witness a paradigm shift in enterprise IT strategies, with private cloud PaaS emerging as a cornerstone for digital transformation. Adoption rates are accelerating as businesses recognize the agility, scalability, and cost-efficiency benefits that private cloud PaaS provides, particularly for sensitive data and mission-critical applications. Technological disruptions, including advancements in multi-cloud management, Kubernetes orchestration, and AI-powered operational insights, are continuously redefining the capabilities and attractiveness of private cloud PaaS solutions. Consumer behavior is also evolving; organizations are increasingly seeking integrated solutions that simplify complex IT operations, reduce management overhead, and enable faster time-to-market for innovative applications. The base year 2025 marks a pivotal point, with an estimated market penetration of 25% across target industries. The transition from legacy infrastructure to private cloud PaaS is a key driver, with enterprises migrating workloads to gain the benefits of managed services without compromising on security and compliance. The focus is shifting from mere cost savings to strategic advantages like improved developer productivity, enhanced operational resilience, and the ability to foster innovation in a secure and controlled environment. The integration of DevOps practices and CI/CD pipelines is further streamlining application development and deployment within private cloud PaaS, leading to higher adoption and satisfaction rates. The growing complexity of regulatory landscapes across different geographies also necessitates flexible and compliant private cloud PaaS solutions, acting as a significant growth catalyst. This trend is particularly pronounced in sectors like finance, healthcare, and government, where strict data governance is paramount. The ability of private cloud PaaS to offer a dedicated, secure, and customizable environment for developing, deploying, and managing applications is its core value proposition, resonating strongly with businesses prioritizing these aspects.
Dominant Regions, Countries, or Segments in Private Cloud PaaS
The Enterprise segment, under the Application classification, is the dominant force driving growth within the Private Cloud PaaS market. Enterprises globally are undertaking significant digital transformation initiatives, necessitating secure, scalable, and flexible platforms for their core business operations. The need for greater control over sensitive data, stringent compliance requirements, and the desire for customized application development environments are key factors propelling the adoption of Private Cloud PaaS within this segment. As of 2025, the Enterprise segment is estimated to hold a substantial market share of approximately 65%, with projected growth to reach over 70% by 2033. Key drivers for this dominance include the increasing adoption of cloud-native architectures, the imperative to modernize legacy applications, and the demand for enhanced developer productivity. The BFSI (Banking, Financial Services, and Insurance) and Healthcare industries, both falling under the Enterprise umbrella, are particularly significant contributors due to their high sensitivity to data security and regulatory compliance.
Within the Types of Private Cloud PaaS, Infrastructure and Middleware services are currently leading, accounting for an estimated 30% and 25% of the market share respectively in 2025. However, Development Tools are experiencing a rapid growth trajectory, driven by the adoption of DevOps practices and the increasing need for streamlined application development lifecycles. This segment is projected to grow at a CAGR of 9.2% from 2025 to 2033. The convergence of Infrastructure as a Service (IaaS) and Platform as a Service (PaaS) capabilities within private cloud environments is also a key factor, offering enterprises a comprehensive solution for their IT needs.
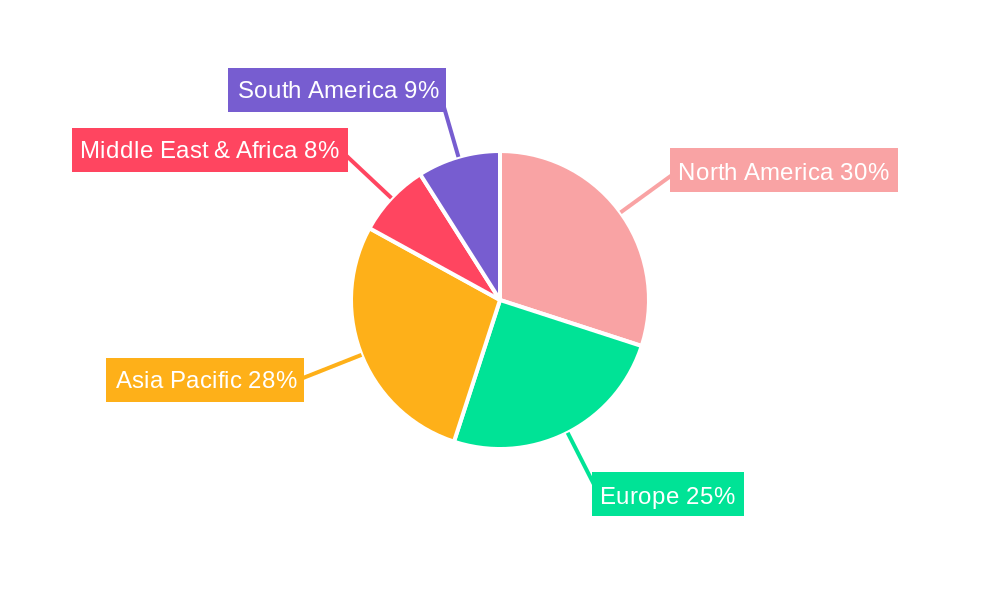
Geographically, North America and Asia-Pacific are the leading regions. North America, with its mature IT infrastructure and strong presence of technology giants like Microsoft Azure, VMware, and AWS, is a significant market. Asia-Pacific, fueled by rapid economic growth and increasing digital adoption in countries like China (with players like Huawei, Tencent, Alibaba Cloud, Kingsoft Cloud) and other emerging economies, is exhibiting the fastest growth rate. Economic policies supporting technological innovation, government initiatives promoting digital infrastructure, and substantial investments in R&D are key factors driving this regional dominance. The market share for North America is estimated at 35% in 2025, while Asia-Pacific is projected to grow from 28% in 2025 to over 35% by 2033.
- Dominant Application Segment: Enterprise (65% market share in 2025, growing to >70% by 2033).
- Key Drivers: Digital transformation, data security needs, regulatory compliance, application modernization.
- Sub-segments: BFSI, Healthcare, Government.
- Dominant PaaS Types (Currently): Infrastructure (30% market share in 2025), Middleware (25% market share in 2025).
- Emerging Growth Driver: Development Tools (projected CAGR of 9.2% from 2025-2033).
- Leading Regions:
- North America (35% market share in 2025).
- Key Players: Microsoft Azure, VMware, AWS.
- Asia-Pacific (28% market share in 2025, growing to >35% by 2033).
- Key Players: Huawei, Tencent, Alibaba Cloud, Kingsoft Cloud.
- North America (35% market share in 2025).
- Key Drivers for Regional Dominance: Economic policies, government support for digital infrastructure, R&D investment, technological adoption rates.
Private Cloud PaaS Product Landscape
The Private Cloud PaaS product landscape is characterized by continuous innovation, focusing on delivering robust, secure, and highly customizable application development and deployment environments. Key product innovations include advanced container orchestration with Kubernetes at its core, enhanced serverless computing capabilities, and integrated AI/ML services for intelligent automation and analytics. Leading vendors like Microsoft Azure, VMware, and AWS are enhancing their offerings with features like unified multi-cloud management, improved security posture management, and seamless integration with hybrid cloud environments. Oracle and IBM are focusing on enterprise-grade database management systems and hybrid cloud solutions, while Huawei and Tencent are pushing the boundaries with highly scalable and cost-effective platforms tailored for the APAC region. Unique selling propositions often revolve around compliance adherence, high performance for demanding workloads, and flexible integration with existing enterprise IT architectures. For instance, VMware's Tanzu provides a comprehensive platform for modernizing applications on private cloud, while Azure Arc enables management of hybrid and multi-cloud environments. The performance metrics being prioritized include latency reduction, enhanced throughput, and improved resource utilization, all critical for mission-critical enterprise applications.
Key Drivers, Barriers & Challenges in Private Cloud PaaS
Key Drivers:
The Private Cloud PaaS market is propelled by several significant drivers. The escalating demand for enhanced data security and privacy is paramount, particularly for sensitive enterprise and government data. Organizations are increasingly seeking greater control over their IT infrastructure and application environments, which private cloud PaaS delivers without the complexities of full on-premises management. The need for customization and tailored solutions to meet specific business requirements, especially in regulated industries, further fuels adoption. Furthermore, the drive for digital transformation and application modernization necessitates flexible and agile platforms that private cloud PaaS provides, enabling faster innovation and deployment cycles. The growing maturity of DevOps practices and containerization technologies like Kubernetes also acts as a strong catalyst.
Barriers & Challenges:
Despite strong growth, the market faces several barriers and challenges. High initial investment costs for setting up and maintaining private cloud infrastructure can be a deterrent for some organizations. Complexity in integration with existing legacy systems can pose a significant hurdle. The shortage of skilled IT professionals with expertise in private cloud management and DevOps further constrains adoption. Concerns regarding vendor lock-in, although decreasing with open-source technologies, still linger. Supply chain issues, though less prevalent for software-defined solutions, can impact hardware dependencies. Regulatory hurdles, while driving demand, also add complexity to implementation and ongoing management. Competitive pressures from public cloud providers offering flexible pricing and a vast array of services also present a constant challenge, demanding continuous innovation and value proposition refinement.
Emerging Opportunities in Private Cloud PaaS
Emerging opportunities in the Private Cloud PaaS sector are abundant, driven by evolving technological landscapes and shifting business needs. The growing adoption of hybrid and multi-cloud strategies presents a significant avenue, with vendors focusing on platforms that offer seamless integration and unified management across diverse environments. Edge computing is another burgeoning area, where private cloud PaaS can provide the localized processing power and data management capabilities required for IoT and real-time analytics. The increasing demand for AI and Machine Learning capabilities within enterprise applications opens doors for PaaS providers to offer integrated ML platforms and tools. Furthermore, specialized PaaS solutions tailored for specific industry verticals, such as Industrial IoT (IIoT) in manufacturing or personalized medicine in healthcare, offer untapped market potential. Evolving consumer preferences towards more secure and compliant cloud solutions continue to create a demand for robust private cloud PaaS offerings.
Growth Accelerators in the Private Cloud PaaS Industry
Several catalysts are accelerating long-term growth in the Private Cloud PaaS industry. Technological breakthroughs in areas like quantum computing, advanced AI for automation, and more efficient containerization technologies will unlock new use cases and improve performance. Strategic partnerships and collaborations between hardware vendors, software providers, and system integrators are crucial for creating comprehensive and accessible private cloud solutions. Market expansion strategies, including targeting small and medium-sized enterprises (SMEs) with more affordable and managed private cloud PaaS offerings, can significantly broaden the market base. The continuous development of open-source technologies fosters interoperability and reduces vendor lock-in, encouraging wider adoption. Furthermore, the increasing focus on sustainability and energy efficiency in data centers may drive innovation in private cloud PaaS architectures to optimize resource utilization.
Key Players Shaping the Private Cloud PaaS Market
- Microsoft Azure
- VMware
- AWS
- Huawei
- Tencent
- Oracle
- IBM
- Lenovo
- Kingsoft Cloud
- GMO GlobalSign Holdings
- Avatara
- SAP
- Sangfor Technologies
- Saicom
- Batelco
- China Telecom
- China Mobile Communications Group
- China Unicom
- Alibaba Cloud
Notable Milestones in Private Cloud PaaS Sector
- 2019: VMware launches Tanzu portfolio, enhancing Kubernetes adoption and application modernization on vSphere.
- 2020: Microsoft Azure announces Azure Arc, extending Azure management to multi-cloud and on-premises environments.
- 2021: IBM acquires Red Hat, bolstering its hybrid cloud strategy and Kubernetes expertise.
- 2022: Huawei releases its new generation of cloud services, emphasizing AI and enterprise solutions for private cloud.
- 2023: AWS introduces new services for enhanced security and management of hybrid cloud deployments.
- 2024: Alibaba Cloud expands its private cloud offerings with advanced AI capabilities and industry-specific solutions.
In-Depth Private Cloud PaaS Market Outlook
The future of the Private Cloud PaaS market is exceptionally promising, driven by a confluence of technological advancements and evolving enterprise demands. Growth accelerators such as the integration of advanced AI for intelligent automation, the expansion of hybrid and multi-cloud management solutions, and the increasing adoption of edge computing will continue to shape the market. Strategic partnerships, particularly those focusing on creating more accessible and managed private cloud PaaS for SMEs, are expected to significantly broaden market reach. The ongoing development and widespread adoption of open-source technologies will further foster interoperability and reduce vendor lock-in, making private cloud PaaS a more attractive proposition for a wider range of organizations. The outlook points towards a future where private cloud PaaS is not just about security and control, but also about enabling rapid innovation, driving operational efficiency, and unlocking new business value through sophisticated, tailored, and resilient IT environments.
Private Cloud PaaS Segmentation
-
1. Application
- 1.1. Enterprise
- 1.2. Government
- 1.3. Others
-
2. Types
- 2.1. Infrastructure
- 2.2. Middleware
- 2.3. Development Tools
- 2.4. Business Intelligence (Bi) Services
- 2.5. Database Management Systems
- 2.6. Others
Private Cloud PaaS Segmentation By Geography
-
1. North America
- 1.1. United States
- 1.2. Canada
- 1.3. Mexico
-
2. South America
- 2.1. Brazil
- 2.2. Argentina
- 2.3. Rest of South America
-
3. Europe
- 3.1. United Kingdom
- 3.2. Germany
- 3.3. France
- 3.4. Italy
- 3.5. Spain
- 3.6. Russia
- 3.7. Benelux
- 3.8. Nordics
- 3.9. Rest of Europe
-
4. Middle East & Africa
- 4.1. Turkey
- 4.2. Israel
- 4.3. GCC
- 4.4. North Africa
- 4.5. South Africa
- 4.6. Rest of Middle East & Africa
-
5. Asia Pacific
- 5.1. China
- 5.2. India
- 5.3. Japan
- 5.4. South Korea
- 5.5. ASEAN
- 5.6. Oceania
- 5.7. Rest of Asia Pacific
Private Cloud PaaS Regional Market Share
Geographic Coverage of Private Cloud PaaS
Private Cloud PaaS REPORT HIGHLIGHTS
| Aspects | Details |
|---|---|
| Study Period | 2020-2034 |
| Base Year | 2025 |
| Estimated Year | 2026 |
| Forecast Period | 2026-2034 |
| Historical Period | 2020-2025 |
| Growth Rate | CAGR of 10.5% from 2020-2034 |
| Segmentation |
|
Table of Contents
- 1. Introduction
- 1.1. Research Scope
- 1.2. Market Segmentation
- 1.3. Research Objective
- 1.4. Definitions and Assumptions
- 2. Executive Summary
- 2.1. Market Snapshot
- 3. Market Dynamics
- 3.1. Market Drivers
- 3.2. Market Restrains
- 3.3. Market Trends
- 3.4. Market Opportunities
- 4. Market Factor Analysis
- 4.1. Porters Five Forces
- 4.1.1. Bargaining Power of Suppliers
- 4.1.2. Bargaining Power of Buyers
- 4.1.3. Threat of New Entrants
- 4.1.4. Threat of Substitutes
- 4.1.5. Competitive Rivalry
- 4.2. PESTEL analysis
- 4.3. BCG Analysis
- 4.3.1. Stars (High Growth, High Market Share)
- 4.3.2. Cash Cows (Low Growth, High Market Share)
- 4.3.3. Question Mark (High Growth, Low Market Share)
- 4.3.4. Dogs (Low Growth, Low Market Share)
- 4.4. Ansoff Matrix Analysis
- 4.5. Supply Chain Analysis
- 4.6. Regulatory Landscape
- 4.7. Current Market Potential and Opportunity Assessment (TAM–SAM–SOM Framework)
- 4.8. VDR Analyst Note
- 4.1. Porters Five Forces
- 5. Market Analysis, Insights and Forecast 2021-2033
- 5.1. Market Analysis, Insights and Forecast - by Application
- 5.1.1. Enterprise
- 5.1.2. Government
- 5.1.3. Others
- 5.2. Market Analysis, Insights and Forecast - by Types
- 5.2.1. Infrastructure
- 5.2.2. Middleware
- 5.2.3. Development Tools
- 5.2.4. Business Intelligence (Bi) Services
- 5.2.5. Database Management Systems
- 5.2.6. Others
- 5.3. Market Analysis, Insights and Forecast - by Region
- 5.3.1. North America
- 5.3.2. South America
- 5.3.3. Europe
- 5.3.4. Middle East & Africa
- 5.3.5. Asia Pacific
- 5.1. Market Analysis, Insights and Forecast - by Application
- 6. Global Private Cloud PaaS Analysis, Insights and Forecast, 2021-2033
- 6.1. Market Analysis, Insights and Forecast - by Application
- 6.1.1. Enterprise
- 6.1.2. Government
- 6.1.3. Others
- 6.2. Market Analysis, Insights and Forecast - by Types
- 6.2.1. Infrastructure
- 6.2.2. Middleware
- 6.2.3. Development Tools
- 6.2.4. Business Intelligence (Bi) Services
- 6.2.5. Database Management Systems
- 6.2.6. Others
- 6.1. Market Analysis, Insights and Forecast - by Application
- 7. North America Private Cloud PaaS Analysis, Insights and Forecast, 2021-2033
- 7.1. Market Analysis, Insights and Forecast - by Application
- 7.1.1. Enterprise
- 7.1.2. Government
- 7.1.3. Others
- 7.2. Market Analysis, Insights and Forecast - by Types
- 7.2.1. Infrastructure
- 7.2.2. Middleware
- 7.2.3. Development Tools
- 7.2.4. Business Intelligence (Bi) Services
- 7.2.5. Database Management Systems
- 7.2.6. Others
- 7.1. Market Analysis, Insights and Forecast - by Application
- 8. South America Private Cloud PaaS Analysis, Insights and Forecast, 2021-2033
- 8.1. Market Analysis, Insights and Forecast - by Application
- 8.1.1. Enterprise
- 8.1.2. Government
- 8.1.3. Others
- 8.2. Market Analysis, Insights and Forecast - by Types
- 8.2.1. Infrastructure
- 8.2.2. Middleware
- 8.2.3. Development Tools
- 8.2.4. Business Intelligence (Bi) Services
- 8.2.5. Database Management Systems
- 8.2.6. Others
- 8.1. Market Analysis, Insights and Forecast - by Application
- 9. Europe Private Cloud PaaS Analysis, Insights and Forecast, 2021-2033
- 9.1. Market Analysis, Insights and Forecast - by Application
- 9.1.1. Enterprise
- 9.1.2. Government
- 9.1.3. Others
- 9.2. Market Analysis, Insights and Forecast - by Types
- 9.2.1. Infrastructure
- 9.2.2. Middleware
- 9.2.3. Development Tools
- 9.2.4. Business Intelligence (Bi) Services
- 9.2.5. Database Management Systems
- 9.2.6. Others
- 9.1. Market Analysis, Insights and Forecast - by Application
- 10. Middle East & Africa Private Cloud PaaS Analysis, Insights and Forecast, 2021-2033
- 10.1. Market Analysis, Insights and Forecast - by Application
- 10.1.1. Enterprise
- 10.1.2. Government
- 10.1.3. Others
- 10.2. Market Analysis, Insights and Forecast - by Types
- 10.2.1. Infrastructure
- 10.2.2. Middleware
- 10.2.3. Development Tools
- 10.2.4. Business Intelligence (Bi) Services
- 10.2.5. Database Management Systems
- 10.2.6. Others
- 10.1. Market Analysis, Insights and Forecast - by Application
- 11. Asia Pacific Private Cloud PaaS Analysis, Insights and Forecast, 2021-2033
- 11.1. Market Analysis, Insights and Forecast - by Application
- 11.1.1. Enterprise
- 11.1.2. Government
- 11.1.3. Others
- 11.2. Market Analysis, Insights and Forecast - by Types
- 11.2.1. Infrastructure
- 11.2.2. Middleware
- 11.2.3. Development Tools
- 11.2.4. Business Intelligence (Bi) Services
- 11.2.5. Database Management Systems
- 11.2.6. Others
- 11.1. Market Analysis, Insights and Forecast - by Application
- 12. Competitive Analysis
- 12.1. Company Profiles
- 12.1.1 Microsoft Azure
- 12.1.1.1. Company Overview
- 12.1.1.2. Products
- 12.1.1.3. Company Financials
- 12.1.1.4. SWOT Analysis
- 12.1.2 Vmware
- 12.1.2.1. Company Overview
- 12.1.2.2. Products
- 12.1.2.3. Company Financials
- 12.1.2.4. SWOT Analysis
- 12.1.3 AWS
- 12.1.3.1. Company Overview
- 12.1.3.2. Products
- 12.1.3.3. Company Financials
- 12.1.3.4. SWOT Analysis
- 12.1.4 Huawei
- 12.1.4.1. Company Overview
- 12.1.4.2. Products
- 12.1.4.3. Company Financials
- 12.1.4.4. SWOT Analysis
- 12.1.5 Tencent
- 12.1.5.1. Company Overview
- 12.1.5.2. Products
- 12.1.5.3. Company Financials
- 12.1.5.4. SWOT Analysis
- 12.1.6 Google
- 12.1.6.1. Company Overview
- 12.1.6.2. Products
- 12.1.6.3. Company Financials
- 12.1.6.4. SWOT Analysis
- 12.1.7 Oracle
- 12.1.7.1. Company Overview
- 12.1.7.2. Products
- 12.1.7.3. Company Financials
- 12.1.7.4. SWOT Analysis
- 12.1.8 IBM
- 12.1.8.1. Company Overview
- 12.1.8.2. Products
- 12.1.8.3. Company Financials
- 12.1.8.4. SWOT Analysis
- 12.1.9 Lenovo
- 12.1.9.1. Company Overview
- 12.1.9.2. Products
- 12.1.9.3. Company Financials
- 12.1.9.4. SWOT Analysis
- 12.1.10 Kingsoft Cloud
- 12.1.10.1. Company Overview
- 12.1.10.2. Products
- 12.1.10.3. Company Financials
- 12.1.10.4. SWOT Analysis
- 12.1.11 GMO GlobalSign Holdings
- 12.1.11.1. Company Overview
- 12.1.11.2. Products
- 12.1.11.3. Company Financials
- 12.1.11.4. SWOT Analysis
- 12.1.12 Avatara
- 12.1.12.1. Company Overview
- 12.1.12.2. Products
- 12.1.12.3. Company Financials
- 12.1.12.4. SWOT Analysis
- 12.1.13 SAP
- 12.1.13.1. Company Overview
- 12.1.13.2. Products
- 12.1.13.3. Company Financials
- 12.1.13.4. SWOT Analysis
- 12.1.14 Sangfor Technologies
- 12.1.14.1. Company Overview
- 12.1.14.2. Products
- 12.1.14.3. Company Financials
- 12.1.14.4. SWOT Analysis
- 12.1.15 Saicom
- 12.1.15.1. Company Overview
- 12.1.15.2. Products
- 12.1.15.3. Company Financials
- 12.1.15.4. SWOT Analysis
- 12.1.16 Batelco
- 12.1.16.1. Company Overview
- 12.1.16.2. Products
- 12.1.16.3. Company Financials
- 12.1.16.4. SWOT Analysis
- 12.1.17 China Telecom
- 12.1.17.1. Company Overview
- 12.1.17.2. Products
- 12.1.17.3. Company Financials
- 12.1.17.4. SWOT Analysis
- 12.1.18 China Mobile Communications Group
- 12.1.18.1. Company Overview
- 12.1.18.2. Products
- 12.1.18.3. Company Financials
- 12.1.18.4. SWOT Analysis
- 12.1.19 China Unicom
- 12.1.19.1. Company Overview
- 12.1.19.2. Products
- 12.1.19.3. Company Financials
- 12.1.19.4. SWOT Analysis
- 12.1.20 Alibaba Cloud
- 12.1.20.1. Company Overview
- 12.1.20.2. Products
- 12.1.20.3. Company Financials
- 12.1.20.4. SWOT Analysis
- 12.1.1 Microsoft Azure
- 12.2. Market Entropy
- 12.2.1 Company's Key Areas Served
- 12.2.2 Recent Developments
- 12.3. Company Market Share Analysis 2025
- 12.3.1 Top 5 Companies Market Share Analysis
- 12.3.2 Top 3 Companies Market Share Analysis
- 12.4. List of Potential Customers
- 13. Research Methodology
List of Figures
- Figure 1: Global Private Cloud PaaS Revenue Breakdown (billion, %) by Region 2025 & 2033
- Figure 2: North America Private Cloud PaaS Revenue (billion), by Application 2025 & 2033
- Figure 3: North America Private Cloud PaaS Revenue Share (%), by Application 2025 & 2033
- Figure 4: North America Private Cloud PaaS Revenue (billion), by Types 2025 & 2033
- Figure 5: North America Private Cloud PaaS Revenue Share (%), by Types 2025 & 2033
- Figure 6: North America Private Cloud PaaS Revenue (billion), by Country 2025 & 2033
- Figure 7: North America Private Cloud PaaS Revenue Share (%), by Country 2025 & 2033
- Figure 8: South America Private Cloud PaaS Revenue (billion), by Application 2025 & 2033
- Figure 9: South America Private Cloud PaaS Revenue Share (%), by Application 2025 & 2033
- Figure 10: South America Private Cloud PaaS Revenue (billion), by Types 2025 & 2033
- Figure 11: South America Private Cloud PaaS Revenue Share (%), by Types 2025 & 2033
- Figure 12: South America Private Cloud PaaS Revenue (billion), by Country 2025 & 2033
- Figure 13: South America Private Cloud PaaS Revenue Share (%), by Country 2025 & 2033
- Figure 14: Europe Private Cloud PaaS Revenue (billion), by Application 2025 & 2033
- Figure 15: Europe Private Cloud PaaS Revenue Share (%), by Application 2025 & 2033
- Figure 16: Europe Private Cloud PaaS Revenue (billion), by Types 2025 & 2033
- Figure 17: Europe Private Cloud PaaS Revenue Share (%), by Types 2025 & 2033
- Figure 18: Europe Private Cloud PaaS Revenue (billion), by Country 2025 & 2033
- Figure 19: Europe Private Cloud PaaS Revenue Share (%), by Country 2025 & 2033
- Figure 20: Middle East & Africa Private Cloud PaaS Revenue (billion), by Application 2025 & 2033
- Figure 21: Middle East & Africa Private Cloud PaaS Revenue Share (%), by Application 2025 & 2033
- Figure 22: Middle East & Africa Private Cloud PaaS Revenue (billion), by Types 2025 & 2033
- Figure 23: Middle East & Africa Private Cloud PaaS Revenue Share (%), by Types 2025 & 2033
- Figure 24: Middle East & Africa Private Cloud PaaS Revenue (billion), by Country 2025 & 2033
- Figure 25: Middle East & Africa Private Cloud PaaS Revenue Share (%), by Country 2025 & 2033
- Figure 26: Asia Pacific Private Cloud PaaS Revenue (billion), by Application 2025 & 2033
- Figure 27: Asia Pacific Private Cloud PaaS Revenue Share (%), by Application 2025 & 2033
- Figure 28: Asia Pacific Private Cloud PaaS Revenue (billion), by Types 2025 & 2033
- Figure 29: Asia Pacific Private Cloud PaaS Revenue Share (%), by Types 2025 & 2033
- Figure 30: Asia Pacific Private Cloud PaaS Revenue (billion), by Country 2025 & 2033
- Figure 31: Asia Pacific Private Cloud PaaS Revenue Share (%), by Country 2025 & 2033
List of Tables
- Table 1: Global Private Cloud PaaS Revenue billion Forecast, by Application 2020 & 2033
- Table 2: Global Private Cloud PaaS Revenue billion Forecast, by Types 2020 & 2033
- Table 3: Global Private Cloud PaaS Revenue billion Forecast, by Region 2020 & 2033
- Table 4: Global Private Cloud PaaS Revenue billion Forecast, by Application 2020 & 2033
- Table 5: Global Private Cloud PaaS Revenue billion Forecast, by Types 2020 & 2033
- Table 6: Global Private Cloud PaaS Revenue billion Forecast, by Country 2020 & 2033
- Table 7: United States Private Cloud PaaS Revenue (billion) Forecast, by Application 2020 & 2033
- Table 8: Canada Private Cloud PaaS Revenue (billion) Forecast, by Application 2020 & 2033
- Table 9: Mexico Private Cloud PaaS Revenue (billion) Forecast, by Application 2020 & 2033
- Table 10: Global Private Cloud PaaS Revenue billion Forecast, by Application 2020 & 2033
- Table 11: Global Private Cloud PaaS Revenue billion Forecast, by Types 2020 & 2033
- Table 12: Global Private Cloud PaaS Revenue billion Forecast, by Country 2020 & 2033
- Table 13: Brazil Private Cloud PaaS Revenue (billion) Forecast, by Application 2020 & 2033
- Table 14: Argentina Private Cloud PaaS Revenue (billion) Forecast, by Application 2020 & 2033
- Table 15: Rest of South America Private Cloud PaaS Revenue (billion) Forecast, by Application 2020 & 2033
- Table 16: Global Private Cloud PaaS Revenue billion Forecast, by Application 2020 & 2033
- Table 17: Global Private Cloud PaaS Revenue billion Forecast, by Types 2020 & 2033
- Table 18: Global Private Cloud PaaS Revenue billion Forecast, by Country 2020 & 2033
- Table 19: United Kingdom Private Cloud PaaS Revenue (billion) Forecast, by Application 2020 & 2033
- Table 20: Germany Private Cloud PaaS Revenue (billion) Forecast, by Application 2020 & 2033
- Table 21: France Private Cloud PaaS Revenue (billion) Forecast, by Application 2020 & 2033
- Table 22: Italy Private Cloud PaaS Revenue (billion) Forecast, by Application 2020 & 2033
- Table 23: Spain Private Cloud PaaS Revenue (billion) Forecast, by Application 2020 & 2033
- Table 24: Russia Private Cloud PaaS Revenue (billion) Forecast, by Application 2020 & 2033
- Table 25: Benelux Private Cloud PaaS Revenue (billion) Forecast, by Application 2020 & 2033
- Table 26: Nordics Private Cloud PaaS Revenue (billion) Forecast, by Application 2020 & 2033
- Table 27: Rest of Europe Private Cloud PaaS Revenue (billion) Forecast, by Application 2020 & 2033
- Table 28: Global Private Cloud PaaS Revenue billion Forecast, by Application 2020 & 2033
- Table 29: Global Private Cloud PaaS Revenue billion Forecast, by Types 2020 & 2033
- Table 30: Global Private Cloud PaaS Revenue billion Forecast, by Country 2020 & 2033
- Table 31: Turkey Private Cloud PaaS Revenue (billion) Forecast, by Application 2020 & 2033
- Table 32: Israel Private Cloud PaaS Revenue (billion) Forecast, by Application 2020 & 2033
- Table 33: GCC Private Cloud PaaS Revenue (billion) Forecast, by Application 2020 & 2033
- Table 34: North Africa Private Cloud PaaS Revenue (billion) Forecast, by Application 2020 & 2033
- Table 35: South Africa Private Cloud PaaS Revenue (billion) Forecast, by Application 2020 & 2033
- Table 36: Rest of Middle East & Africa Private Cloud PaaS Revenue (billion) Forecast, by Application 2020 & 2033
- Table 37: Global Private Cloud PaaS Revenue billion Forecast, by Application 2020 & 2033
- Table 38: Global Private Cloud PaaS Revenue billion Forecast, by Types 2020 & 2033
- Table 39: Global Private Cloud PaaS Revenue billion Forecast, by Country 2020 & 2033
- Table 40: China Private Cloud PaaS Revenue (billion) Forecast, by Application 2020 & 2033
- Table 41: India Private Cloud PaaS Revenue (billion) Forecast, by Application 2020 & 2033
- Table 42: Japan Private Cloud PaaS Revenue (billion) Forecast, by Application 2020 & 2033
- Table 43: South Korea Private Cloud PaaS Revenue (billion) Forecast, by Application 2020 & 2033
- Table 44: ASEAN Private Cloud PaaS Revenue (billion) Forecast, by Application 2020 & 2033
- Table 45: Oceania Private Cloud PaaS Revenue (billion) Forecast, by Application 2020 & 2033
- Table 46: Rest of Asia Pacific Private Cloud PaaS Revenue (billion) Forecast, by Application 2020 & 2033
Frequently Asked Questions
1. What is the projected Compound Annual Growth Rate (CAGR) of the Private Cloud PaaS?
The projected CAGR is approximately 10.5%.
2. Which companies are prominent players in the Private Cloud PaaS?
Key companies in the market include Microsoft Azure, Vmware, AWS, Huawei, Tencent, Google, Oracle, IBM, Lenovo, Kingsoft Cloud, GMO GlobalSign Holdings, Avatara, SAP, Sangfor Technologies, Saicom, Batelco, China Telecom, China Mobile Communications Group, China Unicom, Alibaba Cloud.
3. What are the main segments of the Private Cloud PaaS?
The market segments include Application, Types.
4. Can you provide details about the market size?
The market size is estimated to be USD 127.4 billion as of 2022.
5. What are some drivers contributing to market growth?
N/A
6. What are the notable trends driving market growth?
N/A
7. Are there any restraints impacting market growth?
N/A
8. Can you provide examples of recent developments in the market?
N/A
9. What pricing options are available for accessing the report?
Pricing options include single-user, multi-user, and enterprise licenses priced at USD 2900.00, USD 4350.00, and USD 5800.00 respectively.
10. Is the market size provided in terms of value or volume?
The market size is provided in terms of value, measured in billion.
11. Are there any specific market keywords associated with the report?
Yes, the market keyword associated with the report is "Private Cloud PaaS," which aids in identifying and referencing the specific market segment covered.
12. How do I determine which pricing option suits my needs best?
The pricing options vary based on user requirements and access needs. Individual users may opt for single-user licenses, while businesses requiring broader access may choose multi-user or enterprise licenses for cost-effective access to the report.
13. Are there any additional resources or data provided in the Private Cloud PaaS report?
While the report offers comprehensive insights, it's advisable to review the specific contents or supplementary materials provided to ascertain if additional resources or data are available.
14. How can I stay updated on further developments or reports in the Private Cloud PaaS?
To stay informed about further developments, trends, and reports in the Private Cloud PaaS, consider subscribing to industry newsletters, following relevant companies and organizations, or regularly checking reputable industry news sources and publications.
Methodology
Step 1 - Identification of Relevant Samples Size from Population Database


Step 2 - Approaches for Defining Global Market Size (Value, Volume* & Price*)

Note*: In applicable scenarios
Step 3 - Data Sources
Primary Research
- Web Analytics
- Survey Reports
- Research Institute
- Latest Research Reports
- Opinion Leaders
Secondary Research
- Annual Reports
- White Paper
- Latest Press Release
- Industry Association
- Paid Database
- Investor Presentations

Step 4 - Data Triangulation
Involves using different sources of information in order to increase the validity of a study
These sources are likely to be stakeholders in a program - participants, other researchers, program staff, other community members, and so on.
Then we put all data in single framework & apply various statistical tools to find out the dynamic on the market.
During the analysis stage, feedback from the stakeholder groups would be compared to determine areas of agreement as well as areas of divergence