Key Insights
The global Powerline Ethernet Adapter market is poised for significant expansion, projected to reach approximately $1.2 billion by 2033, driven by a robust Compound Annual Growth Rate (CAGR) of around 6.5% from 2025. This growth is primarily fueled by the escalating demand for stable and high-speed internet connectivity in both commercial and residential settings. As businesses increasingly rely on seamless data transfer for operations and remote workforces become the norm, the need for reliable wired connections bypassing Wi-Fi limitations is paramount. In homes, the proliferation of smart home devices, high-definition streaming, and online gaming necessitates an equally dependable network backbone. The introduction of newer, faster adapter types, such as 2000 Mbps and beyond, directly addresses the bandwidth requirements of these burgeoning applications, making powerline adapters a compelling alternative to complex and costly Ethernet cabling installations.
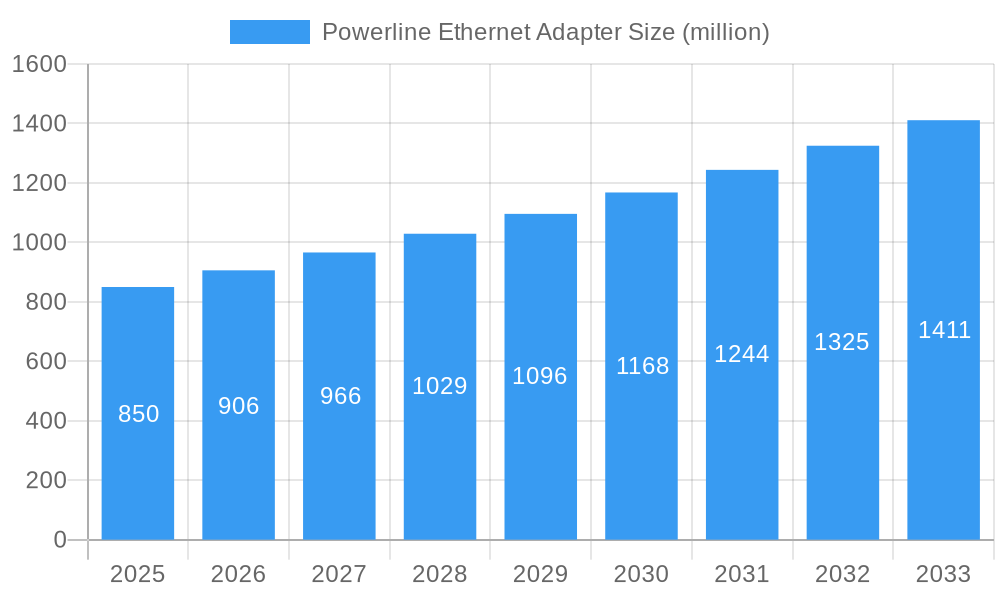
Powerline Ethernet Adapter Market Size (In Million)
Key market drivers include the inherent ease of installation and cost-effectiveness of powerline adapters compared to traditional network cabling solutions. Users can establish a wired network connection simply by plugging the adapters into existing electrical outlets, eliminating the need for drilling or unsightly wires. This user-friendly approach, coupled with the continuous improvement in data transfer speeds and reliability, significantly broadens the addressable market. While the market benefits from these strong growth catalysts, certain restraints, such as potential signal interference in older or complex electrical wiring systems and the growing prevalence of advanced Wi-Fi technologies, warrant attention. However, the segment offering higher speeds (1000 Mbps and above) and the increasing adoption in commercial environments, particularly for expanding network coverage in areas where Wi-Fi is weak, are expected to offset these challenges, ensuring sustained market momentum.
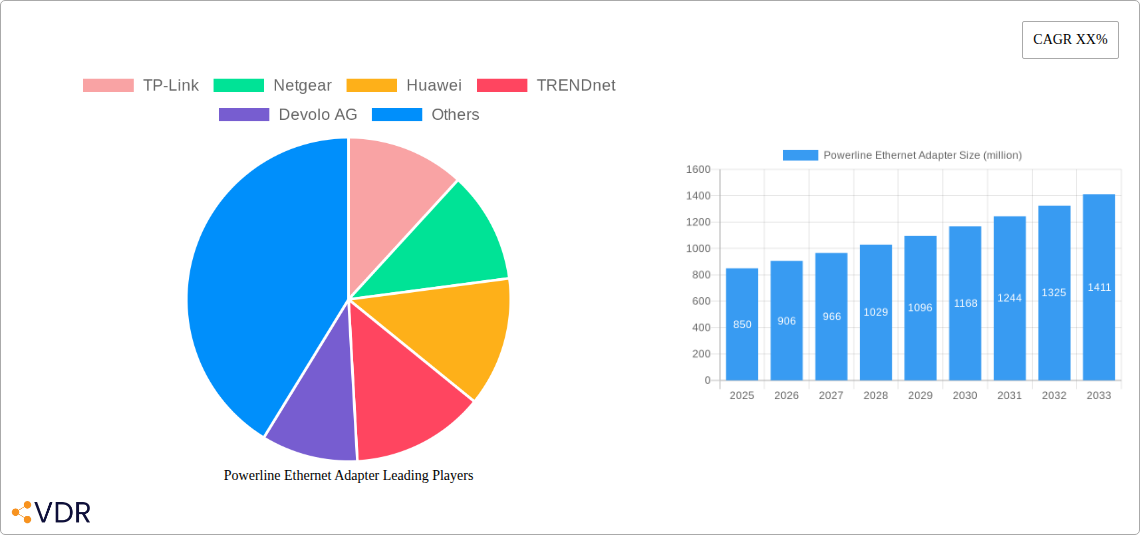
Powerline Ethernet Adapter Company Market Share
This report offers a deep dive into the Powerline Ethernet Adapter market, a critical component for extending wired network connectivity through existing electrical wiring. With increasing demand for stable and high-speed internet access in both home applications and commercial applications, powerline adapters are gaining prominence. This analysis covers the market from 2019 to 2033, with a base year of 2025, providing insights into growth trends, regional dominance, product innovations, and key industry players.
Powerline Ethernet Adapter Market Dynamics & Structure
The Powerline Ethernet Adapter market exhibits a moderately concentrated structure, with key players like TP-Link, Netgear, and Huawei dominating market share. Technological innovation is a primary driver, fueled by the continuous pursuit of higher speeds and enhanced reliability. The development of newer standards like 2000 Mbps adapters is significantly impacting market dynamics. Regulatory frameworks, though generally supportive, can influence product certifications and interoperability standards across different regions. Competitive product substitutes, including Wi-Fi extenders and mesh networking systems, present a constant challenge, pushing powerline adapter manufacturers to emphasize their unique advantages: ease of installation and stable, lag-free connectivity. End-user demographics are shifting, with a growing adoption among gamers, remote workers, and smart home enthusiasts seeking robust wired connections. Mergers and acquisition (M&A) trends are moderate, with smaller players sometimes being acquired by larger entities to consolidate market presence or gain access to specific technologies.
- Market Concentration: Dominated by a few key players with a significant market share.
- Technological Innovation Drivers: Demand for higher speeds (e.g., 2000 Mbps adapters), improved security, and better integration with smart home ecosystems.
- Regulatory Frameworks: Primarily focused on safety standards, electrical interference mitigation, and interoperability.
- Competitive Product Substitutes: Wi-Fi extenders, mesh Wi-Fi systems, and traditional Ethernet cabling.
- End-User Demographics: Home users seeking stable internet for streaming and gaming, remote workers, small businesses, and smart home device owners.
- M&A Trends: Ongoing consolidation, particularly among smaller regional players.
Powerline Ethernet Adapter Growth Trends & Insights
The Powerline Ethernet Adapter market is poised for significant growth, projected to expand at a robust Compound Annual Growth Rate (CAGR) during the forecast period. This expansion is driven by the inherent limitations of traditional Wi-Fi, especially in larger homes or buildings with thick walls, where signal degradation is a common issue. Powerline adapters offer a compelling solution by leveraging existing electrical infrastructure to create a stable and high-speed wired network, making them ideal for bandwidth-intensive applications like 4K streaming, online gaming, and video conferencing. The market penetration of powerline adapters is steadily increasing as consumers become more aware of their benefits and as manufacturers introduce more affordable and feature-rich products.
Technological disruptions, such as the introduction of adapters supporting speeds up to 2000 Mbps, are further accelerating adoption. These higher-speed variants address the growing demand for faster data transfer and are crucial for supporting the increasing number of connected devices in a smart home environment. Consumer behavior shifts are also playing a vital role; the rise of remote work, the proliferation of smart home devices, and the increasing reliance on stable internet for entertainment are all contributing to a greater appreciation for reliable wired network solutions. The ease of installation, often a plug-and-play experience, further enhances their appeal compared to the more complex setup of some mesh Wi-Fi systems.
Market size evolution is evident as the demand for seamless connectivity grows across both residential and commercial sectors. The development of advanced powerline communication (PLC) chips and technologies continues to push the boundaries of speed and efficiency. Industry developments, including standardization efforts and the integration of powerline adapters with other networking solutions, are expected to foster a more cohesive and user-friendly networking ecosystem. The estimated market size for powerline Ethernet adapters is expected to reach $1,100 million by 2025, with a projected growth to $1,800 million by 2033. This growth trajectory underscores the sustained relevance and increasing adoption of powerline Ethernet adapters as a practical and effective networking solution.
- Market Size Evolution: Projected to grow significantly, driven by increasing demand for stable wired connectivity.
- Adoption Rates: Steadily increasing due to awareness of benefits and ease of installation.
- Technological Disruptions: Introduction of higher speed adapters (e.g., 2000 Mbps) and improved powerline communication (PLC) technologies.
- Consumer Behavior Shifts: Driven by remote work, smart home adoption, and demand for high-bandwidth applications.
- Market Penetration: Expanding beyond early adopters to a broader consumer base.
- CAGR: Estimated at 5.2% from 2025 to 2033.
- Estimated Market Size (2025): $1,100 million.
- Projected Market Size (2033): $1,800 million.
Dominant Regions, Countries, or Segments in Powerline Ethernet Adapter
Within the Powerline Ethernet Adapter market, Home Application currently stands as the dominant segment, significantly outpacing commercial applications. This dominance is fueled by the widespread adoption of smart home technologies, the increasing number of connected devices in households, and the growing reliance on stable internet for entertainment and productivity. The ease of installation and the affordability of powerline adapters make them an attractive solution for consumers looking to extend their Wi-Fi coverage or establish wired connections in rooms where traditional Ethernet cabling is impractical.
Among the various speed types, 1200 Mbps and 2000 Mbps adapters are emerging as key growth drivers. While 1000 Mbps adapters remain popular due to their balance of performance and price, the demand for higher speeds is escalating, driven by the proliferation of 4K streaming, online gaming, and the increasing bandwidth requirements of modern applications. The 500 Mbps and 600 Mbps segments, while still relevant, are gradually ceding market share to their faster counterparts as technology advances and prices become more competitive.
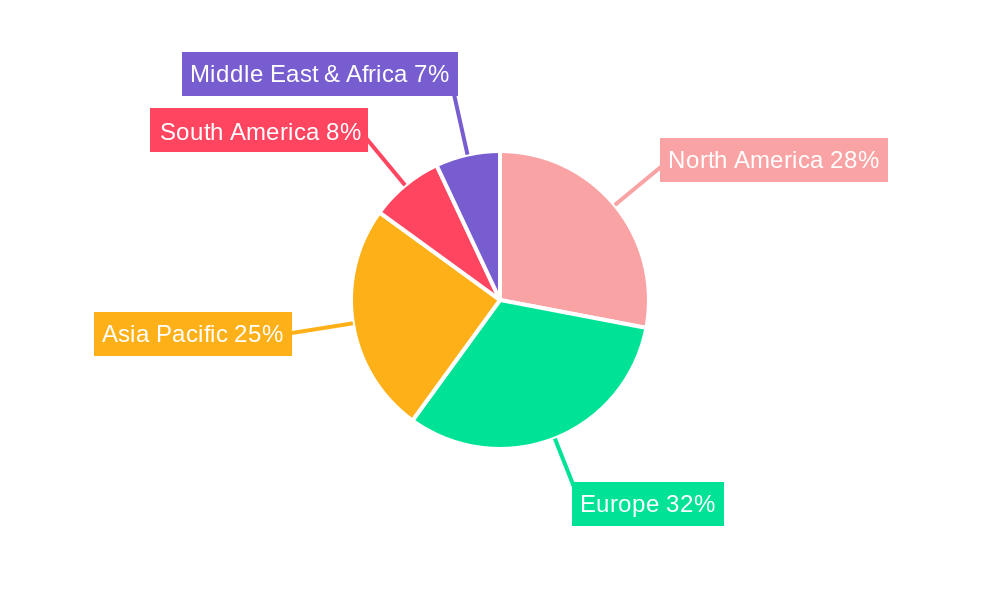
Regionally, Europe is a leading market for powerline Ethernet adapters. This can be attributed to several factors, including:
- High Internet Penetration: Widespread availability of broadband internet across European households.
- Older Housing Stock: Many European homes feature older construction with less flexible wiring, making powerline solutions more practical than running new Ethernet cables.
- Smart Home Adoption: A strong and growing interest in smart home technologies and IoT devices, which require reliable network connectivity.
- Regulatory Support: Supportive regulatory environments that encourage the adoption of networking technologies.
Countries like Germany, the UK, and France are significant contributors to Europe's market share. North America also represents a substantial market, driven by similar factors, particularly the increasing prevalence of smart homes and the demand for high-speed internet. Asia-Pacific is an emerging market with high growth potential, fueled by rapid urbanization and increasing disposable incomes, leading to greater adoption of advanced networking solutions. The market share of the Home Application segment is estimated at 68% in 2025, with the 2000 Mbps type expected to grow at a CAGR of 7.5% from 2025-2033.
- Dominant Segment (Application): Home Application, driven by smart home adoption and device proliferation.
- Dominant Segments (Type): 1200 Mbps and 2000 Mbps adapters are key growth drivers, with 2000 Mbps showing the highest growth potential.
- Leading Region: Europe, due to high internet penetration, older housing stock, and smart home adoption.
- Key Countries in Europe: Germany, UK, France.
- Emerging Region: Asia-Pacific, driven by rapid urbanization and increasing disposable incomes.
- Market Share (Home Application, 2025): Approximately 68%.
- CAGR (2000 Mbps Type, 2025-2033): Estimated at 7.5%.
Powerline Ethernet Adapter Product Landscape
The Powerline Ethernet Adapter product landscape is characterized by continuous innovation focused on enhancing speed, reducing latency, and improving user experience. Manufacturers are actively developing adapters that leverage the latest HomePlug AV2 and G.hn standards, enabling gigabit-plus speeds, with the 2000 Mbps category becoming increasingly prominent. These advanced adapters often feature integrated Wi-Fi capabilities, transforming powerline adapters into dual-purpose devices that provide both wired Ethernet ports and a robust wireless network extension. Innovations in power saving modes and enhanced encryption protocols are also key selling points, addressing environmental concerns and security requirements. Product differentiation often lies in the number of Ethernet ports per adapter, the inclusion of features like pass-through outlets to avoid wasting wall sockets, and intuitive mobile app management for easier setup and network monitoring. The integration of advanced Quality of Service (QoS) features helps prioritize traffic, ensuring a smooth experience for critical applications.
Key Drivers, Barriers & Challenges in Powerline Ethernet Adapter
Key Drivers:
- Demand for Stable High-Speed Internet: The increasing reliance on stable wired connections for gaming, streaming, and remote work.
- Ease of Installation: Plug-and-play functionality appeals to non-technical users.
- Smart Home Growth: Proliferation of smart home devices necessitates reliable network connectivity.
- Technological Advancements: Higher speeds (e.g., 2000 Mbps), improved efficiency, and integrated Wi-Fi capabilities.
- Limitations of Wi-Fi: Signal dead zones and interference in larger or complex home layouts.
Barriers & Challenges:
- Electrical Wiring Quality: Performance can be inconsistent across different electrical wiring systems, especially in older buildings with complex circuitry.
- Interference: Compatibility issues and potential interference with other electrical appliances can degrade performance.
- Competition from Wi-Fi Mesh: Advanced Wi-Fi mesh systems offer seamless roaming and can be perceived as a more comprehensive solution by some consumers.
- Limited Range: While leveraging electrical wiring, the effective range can still be a concern in very large properties.
- Supply Chain Disruptions: Global chip shortages and manufacturing delays can impact product availability and pricing. Estimated impact on availability can be up to 15% reduction in output during peak disruption.
Emerging Opportunities in Powerline Ethernet Adapter
Emerging opportunities in the Powerline Ethernet Adapter market are centered around enhancing existing functionalities and exploring new application areas. The continued development of G.hn standards promises even higher speeds and greater interoperability, opening doors for seamless integration with a wider range of smart home devices and industrial IoT applications. The growing demand for robust wired backhaul for mesh Wi-Fi systems presents a significant opportunity, allowing users to leverage powerline adapters to extend the reach of their mesh networks more effectively. Furthermore, the untapped potential within the small and medium-sized business (SMB) sector for reliable and easily deployable network extensions remains a promising avenue. The integration of powerline adapters into building automation systems and for providing network connectivity in hospitality settings also represents niche but growing markets.
Growth Accelerators in the Powerline Ethernet Adapter Industry
Several factors are accelerating the long-term growth of the Powerline Ethernet Adapter industry. Technological breakthroughs, particularly in the development of more efficient and faster powerline communication chips, are crucial. Strategic partnerships between powerline adapter manufacturers and smart home device companies can drive integrated solutions and broader adoption. Market expansion strategies focusing on emerging economies with rapidly growing internet penetration and smart home adoption will be vital. The ongoing standardization efforts by bodies like the HomePlug Alliance and the ITU are fostering interoperability and consumer confidence, further accelerating market growth.
Key Players Shaping the Powerline Ethernet Adapter Market
- TP-Link
- Netgear
- Huawei
- TRENDnet
- Devolo AG
- Tenda
- ASUS
- D-Link
- Zyxel
- ALFA Network Inc.
- Extollo Communications
- IOGEAR
- Linksys
- Actiontec Electronics, Inc.
- Netis Systems Co.,Ltd.
Notable Milestones in Powerline Ethernet Adapter Sector
- 2019: Launch of enhanced HomePlug AV2 adapters with improved speeds and security features.
- 2020: Increased demand driven by the global shift to remote work, boosting sales of high-speed adapters.
- 2021: Introduction of adapters with integrated Wi-Fi 6 capabilities, blurring the lines between powerline and wireless solutions.
- 2022: Growing focus on G.hn standard development and early product introductions.
- 2023: Significant increase in the availability of 2000 Mbps powerline adapters in the consumer market.
- 2024: Standardization efforts for next-generation powerline technologies gain momentum.
In-Depth Powerline Ethernet Adapter Market Outlook
The Powerline Ethernet Adapter market is set for sustained growth, driven by the persistent need for reliable and high-speed internet connectivity. Future market potential lies in the continued evolution of G.hn technology, promising unprecedented speeds and enhanced interoperability. Strategic opportunities include deeper integration with smart home ecosystems, providing robust wired backhaul for mesh Wi-Fi, and targeting the burgeoning SMB sector with tailored solutions. Manufacturers who focus on product innovation, cost-effectiveness, and user-friendly experiences will be well-positioned to capitalize on the expanding demand for seamless wired networking. The market's trajectory indicates a bright future for powerline adapters as an essential component of modern home and commercial networking infrastructure, with an estimated market value reaching $1,800 million by 2033.
Powerline Ethernet Adapter Segmentation
-
1. Application
- 1.1. Commercial Application
- 1.2. Home Application
-
2. Types
- 2.1. 500 Mbps
- 2.2. 600 Mbps
- 2.3. 1000 Mbps
- 2.4. 1200 Mbps
- 2.5. 2000 Mbps
- 2.6. Others
Powerline Ethernet Adapter Segmentation By Geography
-
1. North America
- 1.1. United States
- 1.2. Canada
- 1.3. Mexico
-
2. South America
- 2.1. Brazil
- 2.2. Argentina
- 2.3. Rest of South America
-
3. Europe
- 3.1. United Kingdom
- 3.2. Germany
- 3.3. France
- 3.4. Italy
- 3.5. Spain
- 3.6. Russia
- 3.7. Benelux
- 3.8. Nordics
- 3.9. Rest of Europe
-
4. Middle East & Africa
- 4.1. Turkey
- 4.2. Israel
- 4.3. GCC
- 4.4. North Africa
- 4.5. South Africa
- 4.6. Rest of Middle East & Africa
-
5. Asia Pacific
- 5.1. China
- 5.2. India
- 5.3. Japan
- 5.4. South Korea
- 5.5. ASEAN
- 5.6. Oceania
- 5.7. Rest of Asia Pacific
Powerline Ethernet Adapter Regional Market Share
Geographic Coverage of Powerline Ethernet Adapter
Powerline Ethernet Adapter REPORT HIGHLIGHTS
| Aspects | Details |
|---|---|
| Study Period | 2020-2034 |
| Base Year | 2025 |
| Estimated Year | 2026 |
| Forecast Period | 2026-2034 |
| Historical Period | 2020-2025 |
| Growth Rate | CAGR of 8.31% from 2020-2034 |
| Segmentation |
|
Table of Contents
- 1. Introduction
- 1.1. Research Scope
- 1.2. Market Segmentation
- 1.3. Research Objective
- 1.4. Definitions and Assumptions
- 2. Executive Summary
- 2.1. Market Snapshot
- 3. Market Dynamics
- 3.1. Market Drivers
- 3.2. Market Restrains
- 3.3. Market Trends
- 3.4. Market Opportunities
- 4. Market Factor Analysis
- 4.1. Porters Five Forces
- 4.1.1. Bargaining Power of Suppliers
- 4.1.2. Bargaining Power of Buyers
- 4.1.3. Threat of New Entrants
- 4.1.4. Threat of Substitutes
- 4.1.5. Competitive Rivalry
- 4.2. PESTEL analysis
- 4.3. BCG Analysis
- 4.3.1. Stars (High Growth, High Market Share)
- 4.3.2. Cash Cows (Low Growth, High Market Share)
- 4.3.3. Question Mark (High Growth, Low Market Share)
- 4.3.4. Dogs (Low Growth, Low Market Share)
- 4.4. Ansoff Matrix Analysis
- 4.5. Supply Chain Analysis
- 4.6. Regulatory Landscape
- 4.7. Current Market Potential and Opportunity Assessment (TAM–SAM–SOM Framework)
- 4.8. VDR Analyst Note
- 4.1. Porters Five Forces
- 5. Market Analysis, Insights and Forecast 2021-2033
- 5.1. Market Analysis, Insights and Forecast - by Application
- 5.1.1. Commercial Application
- 5.1.2. Home Application
- 5.2. Market Analysis, Insights and Forecast - by Types
- 5.2.1. 500 Mbps
- 5.2.2. 600 Mbps
- 5.2.3. 1000 Mbps
- 5.2.4. 1200 Mbps
- 5.2.5. 2000 Mbps
- 5.2.6. Others
- 5.3. Market Analysis, Insights and Forecast - by Region
- 5.3.1. North America
- 5.3.2. South America
- 5.3.3. Europe
- 5.3.4. Middle East & Africa
- 5.3.5. Asia Pacific
- 5.1. Market Analysis, Insights and Forecast - by Application
- 6. Global Powerline Ethernet Adapter Analysis, Insights and Forecast, 2021-2033
- 6.1. Market Analysis, Insights and Forecast - by Application
- 6.1.1. Commercial Application
- 6.1.2. Home Application
- 6.2. Market Analysis, Insights and Forecast - by Types
- 6.2.1. 500 Mbps
- 6.2.2. 600 Mbps
- 6.2.3. 1000 Mbps
- 6.2.4. 1200 Mbps
- 6.2.5. 2000 Mbps
- 6.2.6. Others
- 6.1. Market Analysis, Insights and Forecast - by Application
- 7. North America Powerline Ethernet Adapter Analysis, Insights and Forecast, 2021-2033
- 7.1. Market Analysis, Insights and Forecast - by Application
- 7.1.1. Commercial Application
- 7.1.2. Home Application
- 7.2. Market Analysis, Insights and Forecast - by Types
- 7.2.1. 500 Mbps
- 7.2.2. 600 Mbps
- 7.2.3. 1000 Mbps
- 7.2.4. 1200 Mbps
- 7.2.5. 2000 Mbps
- 7.2.6. Others
- 7.1. Market Analysis, Insights and Forecast - by Application
- 8. South America Powerline Ethernet Adapter Analysis, Insights and Forecast, 2021-2033
- 8.1. Market Analysis, Insights and Forecast - by Application
- 8.1.1. Commercial Application
- 8.1.2. Home Application
- 8.2. Market Analysis, Insights and Forecast - by Types
- 8.2.1. 500 Mbps
- 8.2.2. 600 Mbps
- 8.2.3. 1000 Mbps
- 8.2.4. 1200 Mbps
- 8.2.5. 2000 Mbps
- 8.2.6. Others
- 8.1. Market Analysis, Insights and Forecast - by Application
- 9. Europe Powerline Ethernet Adapter Analysis, Insights and Forecast, 2021-2033
- 9.1. Market Analysis, Insights and Forecast - by Application
- 9.1.1. Commercial Application
- 9.1.2. Home Application
- 9.2. Market Analysis, Insights and Forecast - by Types
- 9.2.1. 500 Mbps
- 9.2.2. 600 Mbps
- 9.2.3. 1000 Mbps
- 9.2.4. 1200 Mbps
- 9.2.5. 2000 Mbps
- 9.2.6. Others
- 9.1. Market Analysis, Insights and Forecast - by Application
- 10. Middle East & Africa Powerline Ethernet Adapter Analysis, Insights and Forecast, 2021-2033
- 10.1. Market Analysis, Insights and Forecast - by Application
- 10.1.1. Commercial Application
- 10.1.2. Home Application
- 10.2. Market Analysis, Insights and Forecast - by Types
- 10.2.1. 500 Mbps
- 10.2.2. 600 Mbps
- 10.2.3. 1000 Mbps
- 10.2.4. 1200 Mbps
- 10.2.5. 2000 Mbps
- 10.2.6. Others
- 10.1. Market Analysis, Insights and Forecast - by Application
- 11. Asia Pacific Powerline Ethernet Adapter Analysis, Insights and Forecast, 2021-2033
- 11.1. Market Analysis, Insights and Forecast - by Application
- 11.1.1. Commercial Application
- 11.1.2. Home Application
- 11.2. Market Analysis, Insights and Forecast - by Types
- 11.2.1. 500 Mbps
- 11.2.2. 600 Mbps
- 11.2.3. 1000 Mbps
- 11.2.4. 1200 Mbps
- 11.2.5. 2000 Mbps
- 11.2.6. Others
- 11.1. Market Analysis, Insights and Forecast - by Application
- 12. Competitive Analysis
- 12.1. Company Profiles
- 12.1.1 TP-Link
- 12.1.1.1. Company Overview
- 12.1.1.2. Products
- 12.1.1.3. Company Financials
- 12.1.1.4. SWOT Analysis
- 12.1.2 Netgear
- 12.1.2.1. Company Overview
- 12.1.2.2. Products
- 12.1.2.3. Company Financials
- 12.1.2.4. SWOT Analysis
- 12.1.3 Huawei
- 12.1.3.1. Company Overview
- 12.1.3.2. Products
- 12.1.3.3. Company Financials
- 12.1.3.4. SWOT Analysis
- 12.1.4 TRENDnet
- 12.1.4.1. Company Overview
- 12.1.4.2. Products
- 12.1.4.3. Company Financials
- 12.1.4.4. SWOT Analysis
- 12.1.5 Devolo AG
- 12.1.5.1. Company Overview
- 12.1.5.2. Products
- 12.1.5.3. Company Financials
- 12.1.5.4. SWOT Analysis
- 12.1.6 Tenda
- 12.1.6.1. Company Overview
- 12.1.6.2. Products
- 12.1.6.3. Company Financials
- 12.1.6.4. SWOT Analysis
- 12.1.7 ASUS
- 12.1.7.1. Company Overview
- 12.1.7.2. Products
- 12.1.7.3. Company Financials
- 12.1.7.4. SWOT Analysis
- 12.1.8 D-Link
- 12.1.8.1. Company Overview
- 12.1.8.2. Products
- 12.1.8.3. Company Financials
- 12.1.8.4. SWOT Analysis
- 12.1.9 Zyxel
- 12.1.9.1. Company Overview
- 12.1.9.2. Products
- 12.1.9.3. Company Financials
- 12.1.9.4. SWOT Analysis
- 12.1.10 ALFA Network Inc.
- 12.1.10.1. Company Overview
- 12.1.10.2. Products
- 12.1.10.3. Company Financials
- 12.1.10.4. SWOT Analysis
- 12.1.11 Extollo Communications
- 12.1.11.1. Company Overview
- 12.1.11.2. Products
- 12.1.11.3. Company Financials
- 12.1.11.4. SWOT Analysis
- 12.1.12 IOGEAR
- 12.1.12.1. Company Overview
- 12.1.12.2. Products
- 12.1.12.3. Company Financials
- 12.1.12.4. SWOT Analysis
- 12.1.13 Linksys
- 12.1.13.1. Company Overview
- 12.1.13.2. Products
- 12.1.13.3. Company Financials
- 12.1.13.4. SWOT Analysis
- 12.1.14 Actiontec Electronics
- 12.1.14.1. Company Overview
- 12.1.14.2. Products
- 12.1.14.3. Company Financials
- 12.1.14.4. SWOT Analysis
- 12.1.15 Inc.
- 12.1.15.1. Company Overview
- 12.1.15.2. Products
- 12.1.15.3. Company Financials
- 12.1.15.4. SWOT Analysis
- 12.1.16 Netis Systems Co.
- 12.1.16.1. Company Overview
- 12.1.16.2. Products
- 12.1.16.3. Company Financials
- 12.1.16.4. SWOT Analysis
- 12.1.17 Ltd.
- 12.1.17.1. Company Overview
- 12.1.17.2. Products
- 12.1.17.3. Company Financials
- 12.1.17.4. SWOT Analysis
- 12.1.1 TP-Link
- 12.2. Market Entropy
- 12.2.1 Company's Key Areas Served
- 12.2.2 Recent Developments
- 12.3. Company Market Share Analysis 2025
- 12.3.1 Top 5 Companies Market Share Analysis
- 12.3.2 Top 3 Companies Market Share Analysis
- 12.4. List of Potential Customers
- 13. Research Methodology
List of Figures
- Figure 1: Global Powerline Ethernet Adapter Revenue Breakdown (undefined, %) by Region 2025 & 2033
- Figure 2: North America Powerline Ethernet Adapter Revenue (undefined), by Application 2025 & 2033
- Figure 3: North America Powerline Ethernet Adapter Revenue Share (%), by Application 2025 & 2033
- Figure 4: North America Powerline Ethernet Adapter Revenue (undefined), by Types 2025 & 2033
- Figure 5: North America Powerline Ethernet Adapter Revenue Share (%), by Types 2025 & 2033
- Figure 6: North America Powerline Ethernet Adapter Revenue (undefined), by Country 2025 & 2033
- Figure 7: North America Powerline Ethernet Adapter Revenue Share (%), by Country 2025 & 2033
- Figure 8: South America Powerline Ethernet Adapter Revenue (undefined), by Application 2025 & 2033
- Figure 9: South America Powerline Ethernet Adapter Revenue Share (%), by Application 2025 & 2033
- Figure 10: South America Powerline Ethernet Adapter Revenue (undefined), by Types 2025 & 2033
- Figure 11: South America Powerline Ethernet Adapter Revenue Share (%), by Types 2025 & 2033
- Figure 12: South America Powerline Ethernet Adapter Revenue (undefined), by Country 2025 & 2033
- Figure 13: South America Powerline Ethernet Adapter Revenue Share (%), by Country 2025 & 2033
- Figure 14: Europe Powerline Ethernet Adapter Revenue (undefined), by Application 2025 & 2033
- Figure 15: Europe Powerline Ethernet Adapter Revenue Share (%), by Application 2025 & 2033
- Figure 16: Europe Powerline Ethernet Adapter Revenue (undefined), by Types 2025 & 2033
- Figure 17: Europe Powerline Ethernet Adapter Revenue Share (%), by Types 2025 & 2033
- Figure 18: Europe Powerline Ethernet Adapter Revenue (undefined), by Country 2025 & 2033
- Figure 19: Europe Powerline Ethernet Adapter Revenue Share (%), by Country 2025 & 2033
- Figure 20: Middle East & Africa Powerline Ethernet Adapter Revenue (undefined), by Application 2025 & 2033
- Figure 21: Middle East & Africa Powerline Ethernet Adapter Revenue Share (%), by Application 2025 & 2033
- Figure 22: Middle East & Africa Powerline Ethernet Adapter Revenue (undefined), by Types 2025 & 2033
- Figure 23: Middle East & Africa Powerline Ethernet Adapter Revenue Share (%), by Types 2025 & 2033
- Figure 24: Middle East & Africa Powerline Ethernet Adapter Revenue (undefined), by Country 2025 & 2033
- Figure 25: Middle East & Africa Powerline Ethernet Adapter Revenue Share (%), by Country 2025 & 2033
- Figure 26: Asia Pacific Powerline Ethernet Adapter Revenue (undefined), by Application 2025 & 2033
- Figure 27: Asia Pacific Powerline Ethernet Adapter Revenue Share (%), by Application 2025 & 2033
- Figure 28: Asia Pacific Powerline Ethernet Adapter Revenue (undefined), by Types 2025 & 2033
- Figure 29: Asia Pacific Powerline Ethernet Adapter Revenue Share (%), by Types 2025 & 2033
- Figure 30: Asia Pacific Powerline Ethernet Adapter Revenue (undefined), by Country 2025 & 2033
- Figure 31: Asia Pacific Powerline Ethernet Adapter Revenue Share (%), by Country 2025 & 2033
List of Tables
- Table 1: Global Powerline Ethernet Adapter Revenue undefined Forecast, by Application 2020 & 2033
- Table 2: Global Powerline Ethernet Adapter Revenue undefined Forecast, by Types 2020 & 2033
- Table 3: Global Powerline Ethernet Adapter Revenue undefined Forecast, by Region 2020 & 2033
- Table 4: Global Powerline Ethernet Adapter Revenue undefined Forecast, by Application 2020 & 2033
- Table 5: Global Powerline Ethernet Adapter Revenue undefined Forecast, by Types 2020 & 2033
- Table 6: Global Powerline Ethernet Adapter Revenue undefined Forecast, by Country 2020 & 2033
- Table 7: United States Powerline Ethernet Adapter Revenue (undefined) Forecast, by Application 2020 & 2033
- Table 8: Canada Powerline Ethernet Adapter Revenue (undefined) Forecast, by Application 2020 & 2033
- Table 9: Mexico Powerline Ethernet Adapter Revenue (undefined) Forecast, by Application 2020 & 2033
- Table 10: Global Powerline Ethernet Adapter Revenue undefined Forecast, by Application 2020 & 2033
- Table 11: Global Powerline Ethernet Adapter Revenue undefined Forecast, by Types 2020 & 2033
- Table 12: Global Powerline Ethernet Adapter Revenue undefined Forecast, by Country 2020 & 2033
- Table 13: Brazil Powerline Ethernet Adapter Revenue (undefined) Forecast, by Application 2020 & 2033
- Table 14: Argentina Powerline Ethernet Adapter Revenue (undefined) Forecast, by Application 2020 & 2033
- Table 15: Rest of South America Powerline Ethernet Adapter Revenue (undefined) Forecast, by Application 2020 & 2033
- Table 16: Global Powerline Ethernet Adapter Revenue undefined Forecast, by Application 2020 & 2033
- Table 17: Global Powerline Ethernet Adapter Revenue undefined Forecast, by Types 2020 & 2033
- Table 18: Global Powerline Ethernet Adapter Revenue undefined Forecast, by Country 2020 & 2033
- Table 19: United Kingdom Powerline Ethernet Adapter Revenue (undefined) Forecast, by Application 2020 & 2033
- Table 20: Germany Powerline Ethernet Adapter Revenue (undefined) Forecast, by Application 2020 & 2033
- Table 21: France Powerline Ethernet Adapter Revenue (undefined) Forecast, by Application 2020 & 2033
- Table 22: Italy Powerline Ethernet Adapter Revenue (undefined) Forecast, by Application 2020 & 2033
- Table 23: Spain Powerline Ethernet Adapter Revenue (undefined) Forecast, by Application 2020 & 2033
- Table 24: Russia Powerline Ethernet Adapter Revenue (undefined) Forecast, by Application 2020 & 2033
- Table 25: Benelux Powerline Ethernet Adapter Revenue (undefined) Forecast, by Application 2020 & 2033
- Table 26: Nordics Powerline Ethernet Adapter Revenue (undefined) Forecast, by Application 2020 & 2033
- Table 27: Rest of Europe Powerline Ethernet Adapter Revenue (undefined) Forecast, by Application 2020 & 2033
- Table 28: Global Powerline Ethernet Adapter Revenue undefined Forecast, by Application 2020 & 2033
- Table 29: Global Powerline Ethernet Adapter Revenue undefined Forecast, by Types 2020 & 2033
- Table 30: Global Powerline Ethernet Adapter Revenue undefined Forecast, by Country 2020 & 2033
- Table 31: Turkey Powerline Ethernet Adapter Revenue (undefined) Forecast, by Application 2020 & 2033
- Table 32: Israel Powerline Ethernet Adapter Revenue (undefined) Forecast, by Application 2020 & 2033
- Table 33: GCC Powerline Ethernet Adapter Revenue (undefined) Forecast, by Application 2020 & 2033
- Table 34: North Africa Powerline Ethernet Adapter Revenue (undefined) Forecast, by Application 2020 & 2033
- Table 35: South Africa Powerline Ethernet Adapter Revenue (undefined) Forecast, by Application 2020 & 2033
- Table 36: Rest of Middle East & Africa Powerline Ethernet Adapter Revenue (undefined) Forecast, by Application 2020 & 2033
- Table 37: Global Powerline Ethernet Adapter Revenue undefined Forecast, by Application 2020 & 2033
- Table 38: Global Powerline Ethernet Adapter Revenue undefined Forecast, by Types 2020 & 2033
- Table 39: Global Powerline Ethernet Adapter Revenue undefined Forecast, by Country 2020 & 2033
- Table 40: China Powerline Ethernet Adapter Revenue (undefined) Forecast, by Application 2020 & 2033
- Table 41: India Powerline Ethernet Adapter Revenue (undefined) Forecast, by Application 2020 & 2033
- Table 42: Japan Powerline Ethernet Adapter Revenue (undefined) Forecast, by Application 2020 & 2033
- Table 43: South Korea Powerline Ethernet Adapter Revenue (undefined) Forecast, by Application 2020 & 2033
- Table 44: ASEAN Powerline Ethernet Adapter Revenue (undefined) Forecast, by Application 2020 & 2033
- Table 45: Oceania Powerline Ethernet Adapter Revenue (undefined) Forecast, by Application 2020 & 2033
- Table 46: Rest of Asia Pacific Powerline Ethernet Adapter Revenue (undefined) Forecast, by Application 2020 & 2033
Frequently Asked Questions
1. What is the projected Compound Annual Growth Rate (CAGR) of the Powerline Ethernet Adapter?
The projected CAGR is approximately 8.31%.
2. Which companies are prominent players in the Powerline Ethernet Adapter?
Key companies in the market include TP-Link, Netgear, Huawei, TRENDnet, Devolo AG, Tenda, ASUS, D-Link, Zyxel, ALFA Network Inc., Extollo Communications, IOGEAR, Linksys, Actiontec Electronics, Inc., Netis Systems Co., Ltd..
3. What are the main segments of the Powerline Ethernet Adapter?
The market segments include Application, Types.
4. Can you provide details about the market size?
The market size is estimated to be USD XXX N/A as of 2022.
5. What are some drivers contributing to market growth?
N/A
6. What are the notable trends driving market growth?
N/A
7. Are there any restraints impacting market growth?
N/A
8. Can you provide examples of recent developments in the market?
N/A
9. What pricing options are available for accessing the report?
Pricing options include single-user, multi-user, and enterprise licenses priced at USD 2900.00, USD 4350.00, and USD 5800.00 respectively.
10. Is the market size provided in terms of value or volume?
The market size is provided in terms of value, measured in N/A.
11. Are there any specific market keywords associated with the report?
Yes, the market keyword associated with the report is "Powerline Ethernet Adapter," which aids in identifying and referencing the specific market segment covered.
12. How do I determine which pricing option suits my needs best?
The pricing options vary based on user requirements and access needs. Individual users may opt for single-user licenses, while businesses requiring broader access may choose multi-user or enterprise licenses for cost-effective access to the report.
13. Are there any additional resources or data provided in the Powerline Ethernet Adapter report?
While the report offers comprehensive insights, it's advisable to review the specific contents or supplementary materials provided to ascertain if additional resources or data are available.
14. How can I stay updated on further developments or reports in the Powerline Ethernet Adapter?
To stay informed about further developments, trends, and reports in the Powerline Ethernet Adapter, consider subscribing to industry newsletters, following relevant companies and organizations, or regularly checking reputable industry news sources and publications.
Methodology
Step 1 - Identification of Relevant Samples Size from Population Database


Step 2 - Approaches for Defining Global Market Size (Value, Volume* & Price*)

Note*: In applicable scenarios
Step 3 - Data Sources
Primary Research
- Web Analytics
- Survey Reports
- Research Institute
- Latest Research Reports
- Opinion Leaders
Secondary Research
- Annual Reports
- White Paper
- Latest Press Release
- Industry Association
- Paid Database
- Investor Presentations

Step 4 - Data Triangulation
Involves using different sources of information in order to increase the validity of a study
These sources are likely to be stakeholders in a program - participants, other researchers, program staff, other community members, and so on.
Then we put all data in single framework & apply various statistical tools to find out the dynamic on the market.
During the analysis stage, feedback from the stakeholder groups would be compared to determine areas of agreement as well as areas of divergence

