
Key Insights
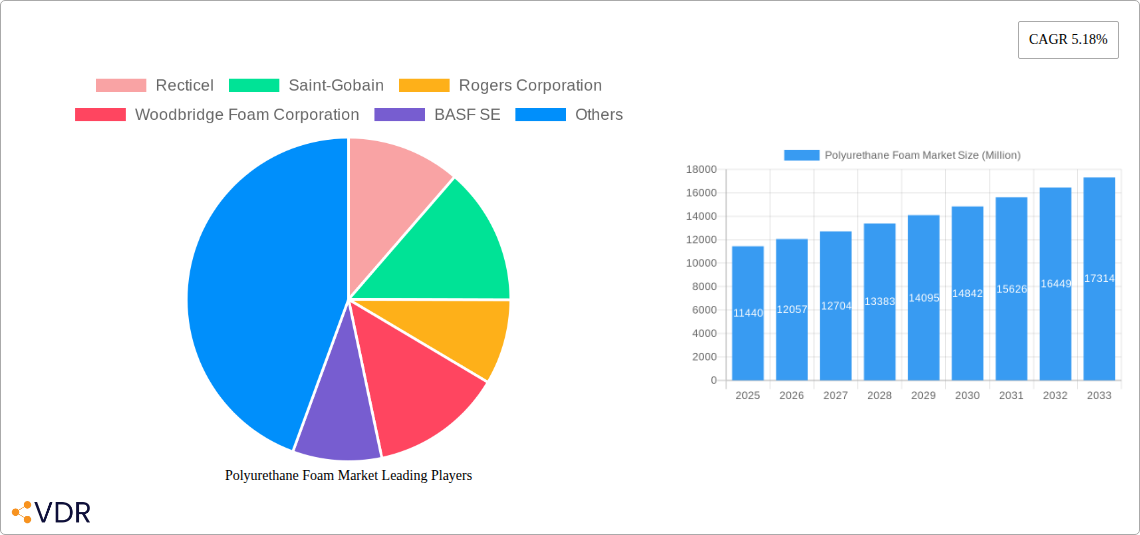
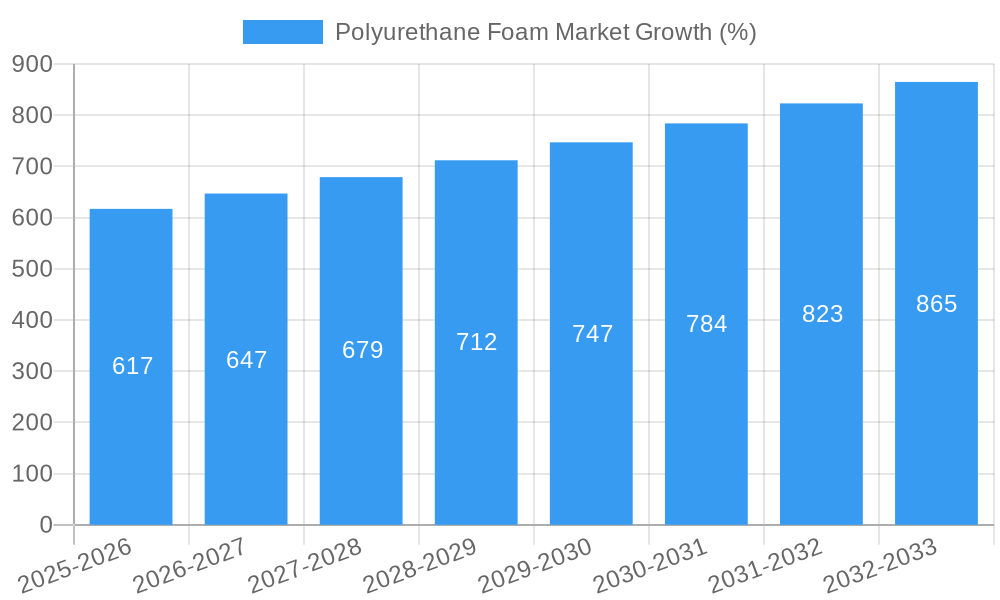
The global polyurethane foam market, valued at $11.44 billion in 2025, is projected to experience robust growth, driven by a Compound Annual Growth Rate (CAGR) of 5.18% from 2025 to 2033. This expansion is fueled by several key factors. The burgeoning construction industry, particularly in developing economies, significantly boosts demand for rigid polyurethane foam in insulation and construction applications. Simultaneously, the automotive sector's increasing adoption of lightweight and high-performance materials further fuels market growth, with flexible polyurethane foam playing a crucial role in seating, interior components, and sound dampening. The packaging industry's reliance on polyurethane foam for cushioning and protection also contributes to market expansion. Furthermore, increasing consumer demand for comfortable and durable furniture supports the market's growth. Growth is segmented by product type, with rigid polyurethane foam dominating due to its superior insulation properties and versatility across various industries. However, flexible polyurethane foam also holds significant market share due to its widespread use in diverse applications. Spray-on polyurethane foam represents a niche but rapidly growing segment, offering advantages in terms of on-site application and customized solutions. While the market faces restraints such as fluctuating raw material prices and environmental concerns regarding the manufacturing process, technological advancements focusing on sustainability and improved product properties are likely to mitigate these challenges. Regional analysis reveals strong growth in Asia-Pacific, driven by rapid industrialization and urbanization, particularly in China and India. North America and Europe also maintain significant market shares owing to established industrial bases and high consumer spending.
The competitive landscape is characterized by a mix of large multinational corporations and specialized regional players. Companies such as BASF, Dow, Covestro, Huntsman, and Recticel are major players, leveraging their extensive research and development capabilities and strong global distribution networks to maintain market leadership. However, the market also features smaller, specialized companies that focus on niche applications or regions. The future growth of the polyurethane foam market will likely be influenced by the ongoing development of sustainable and high-performance materials, stringent environmental regulations, and the increasing focus on energy efficiency across diverse industries. Strategic alliances, mergers, and acquisitions are anticipated to further shape the competitive landscape in the coming years.
Polyurethane Foam Market: A Comprehensive Report (2019-2033)
This comprehensive report provides an in-depth analysis of the global Polyurethane Foam market, encompassing its parent market (Chemical Manufacturing) and child markets (Construction, Automotive, Packaging, Furniture). The study period covers 2019-2033, with 2025 serving as the base and estimated year. The report offers invaluable insights for industry professionals, investors, and strategic decision-makers seeking a clear understanding of this dynamic market. The market size is projected to reach xx Million units by 2033.
Polyurethane Foam Market Market Dynamics & Structure
This section dissects the competitive landscape, technological advancements, and regulatory influences shaping the Polyurethane Foam market. We analyze market concentration, revealing the market share held by key players like BASF SE and Dow, and exploring M&A activity within the sector. The report quantifies the volume of M&A deals over the past five years at xx deals. Qualitative factors, such as the barriers to innovation stemming from high R&D costs and stringent environmental regulations, are also explored.
- Market Concentration: Highly concentrated with top 5 players holding xx% market share in 2024.
- Technological Innovation: Driven by advancements in bio-based polyols and sustainable manufacturing processes.
- Regulatory Framework: Stringent environmental regulations impacting production and material sourcing.
- Competitive Substitutes: Increasing competition from alternative materials like bio-based foams and recycled plastics.
- End-User Demographics: Growing demand from construction, automotive, and packaging sectors.
- M&A Trends: Consolidation through mergers and acquisitions to enhance market share and product portfolios.
Polyurethane Foam Market Growth Trends & Insights
This section leverages extensive market research data to provide a comprehensive analysis of market size evolution, adoption rates across various segments, and technological disruptions. The report details the Compound Annual Growth Rate (CAGR) from 2019 to 2024 at xx% and projects a CAGR of xx% from 2025 to 2033, driven by factors such as increasing urbanization and the rising demand for lightweight and energy-efficient materials in various industries. The analysis also delves into consumer behavior shifts toward sustainable and eco-friendly products, impacting material selection and driving innovation within the industry. Market penetration within key segments is also analyzed providing data-driven projections for future market share.
Dominant Regions, Countries, or Segments in Polyurethane Foam Market
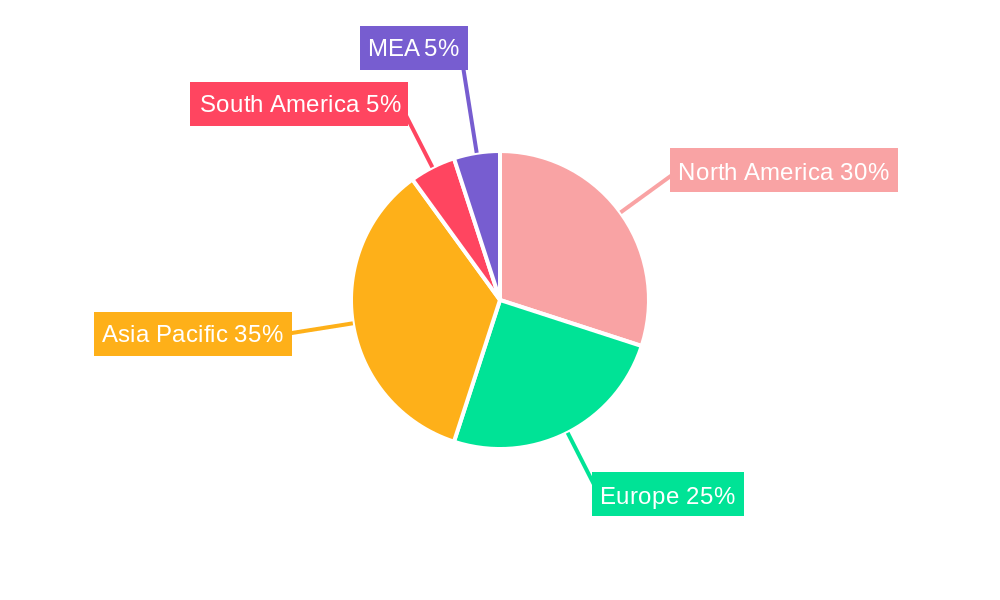
This section pinpoints the leading geographical regions and market segments driving market growth. The analysis includes a detailed breakdown of market share by application (Construction, Automotive, Packaging, Furniture) and type (Rigid, Flexible, Spray-On), identifying the segment with the highest growth potential. North America is currently the dominant region, however Asia-Pacific is projected to experience the fastest growth due to its rapidly expanding construction and automotive sectors.
- Key Drivers (Asia-Pacific): Rapid urbanization, rising disposable incomes, robust automotive production, and supportive government infrastructure projects.
- Dominance Factors (North America): Established manufacturing base, strong consumer demand, and technological innovation.
- Growth Potential (Europe): Focus on sustainable construction and automotive materials leading to significant growth opportunities.
Polyurethane Foam Market Product Landscape
The report showcases the latest innovations in polyurethane foam technology, focusing on improved performance characteristics like enhanced insulation, durability, and lightweight properties. The analysis highlights the unique selling propositions of different product variations and the technological advancements driving product differentiation in the market. Emphasis is placed on the shift towards eco-friendly, bio-based polyurethane foams gaining traction to meet increasingly stringent environmental regulations.
Key Drivers, Barriers & Challenges in Polyurethane Foam Market
Key Drivers: The market is propelled by strong demand from the construction and automotive sectors, increasing consumer awareness of energy efficiency, and advancements in foam formulation leading to enhanced performance characteristics. Government incentives for green building materials also contribute to the growth trajectory.
Key Challenges: Fluctuations in raw material prices, stringent environmental regulations impacting production costs, and competition from alternative materials pose significant challenges to market growth. Supply chain disruptions, particularly concerning isocyanates, have also led to production constraints and price volatility. The estimated impact of these challenges on market growth is a reduction of xx% in projected market size.
Emerging Opportunities in Polyurethane Foam Market
Emerging opportunities lie in the development of bio-based polyurethane foams, expansion into niche applications such as aerospace and medical devices, and customized foam solutions catering to specific end-user needs. The focus on sustainable manufacturing practices and circular economy principles also presents significant growth opportunities. Untapped markets in developing economies present substantial growth potential.
Growth Accelerators in the Polyurethane Foam Market Industry
Long-term growth is propelled by technological breakthroughs in bio-based polyols, strategic partnerships between foam manufacturers and end-users, and market expansion strategies targeting emerging economies. Innovation in foam formulation and processing techniques will further drive growth.
Key Players Shaping the Polyurethane Foam Market Market
- Recticel
- Saint-Gobain
- Rogers Corporation
- Woodbridge Foam Corporation
- BASF SE
- Dow
- Vita (Holdings) Limited
- Covestro AG
- Huntsman Corporation
- Bridgestone Corporation
Notable Milestones in Polyurethane Foam Market Sector
- October 2022: BASF SE opened a new Polyurethane Application Development Laboratory in Mumbai, India, boosting automotive foam innovation.
- September 2022: Covestro AG introduced bio-circular feedstock-based polyether polyols, advancing sustainable flexible foam production for automotive seating.
In-Depth Polyurethane Foam Market Market Outlook
The Polyurethane Foam market exhibits strong growth potential driven by technological advancements, increasing demand from key sectors, and the expansion into new applications. Strategic partnerships and investments in sustainable manufacturing practices will be key to navigating market challenges and capturing future growth opportunities. The market's future is bright, with significant potential for expansion within both established and emerging markets.
Polyurethane Foam Market Segmentation
-
1. Type
-
1.1. Polyurethane Foams(PUFs)
- 1.1.1. Flexible Polyurethane Foam
- 1.1.2. Rigid Polyurethane Foam
- 1.2. Expanded Polypropylene Foam
- 1.3. PET Foam
- 1.4. Other Types
-
1.1. Polyurethane Foams(PUFs)
-
2. Application
- 2.1. Interior
- 2.2. Exterior
Polyurethane Foam Market Segmentation By Geography
-
1. Asia Pacific
- 1.1. China
- 1.2. India
- 1.3. Japan
- 1.4. South Korea
- 1.5. Rest of Asia Pacific
-
2. North America
- 2.1. United States
- 2.2. Canada
- 2.3. Mexico
-
3. Europe
- 3.1. Germany
- 3.2. United Kingdom
- 3.3. Italy
- 3.4. France
- 3.5. Rest of Europe
-
4. South America
- 4.1. Brazil
- 4.2. Argentina
- 4.3. Rest of South America
-
5. Middle East and Africa
- 5.1. Saudi Arabia
- 5.2. South Africa
- 5.3. Rest of Middle East and Africa
Polyurethane Foam Market REPORT HIGHLIGHTS
| Aspects | Details |
|---|---|
| Study Period | 2019-2033 |
| Base Year | 2024 |
| Estimated Year | 2025 |
| Forecast Period | 2025-2033 |
| Historical Period | 2019-2024 |
| Growth Rate | CAGR of 5.18% from 2019-2033 |
| Segmentation |
|
Table of Contents
- 1. Introduction
- 1.1. Research Scope
- 1.2. Market Segmentation
- 1.3. Research Methodology
- 1.4. Definitions and Assumptions
- 2. Executive Summary
- 2.1. Introduction
- 3. Market Dynamics
- 3.1. Introduction
- 3.2. Market Drivers
- 3.2.1. Growing Emphasis on the Sustainable Production of Automotive Foams; Growing Need for Weight Reduction; Other Drivers
- 3.3. Market Restrains
- 3.3.1. Declining Automotive Production in Major Economies of Europe; Availability of Eco-Friendly Bio-Foams
- 3.4. Market Trends
- 3.4.1. Interior Applications to Dominate the Market
- 4. Market Factor Analysis
- 4.1. Porters Five Forces
- 4.2. Supply/Value Chain
- 4.3. PESTEL analysis
- 4.4. Market Entropy
- 4.5. Patent/Trademark Analysis
- 5. Global Polyurethane Foam Market Analysis, Insights and Forecast, 2019-2031
- 5.1. Market Analysis, Insights and Forecast - by Type
- 5.1.1. Polyurethane Foams(PUFs)
- 5.1.1.1. Flexible Polyurethane Foam
- 5.1.1.2. Rigid Polyurethane Foam
- 5.1.2. Expanded Polypropylene Foam
- 5.1.3. PET Foam
- 5.1.4. Other Types
- 5.1.1. Polyurethane Foams(PUFs)
- 5.2. Market Analysis, Insights and Forecast - by Application
- 5.2.1. Interior
- 5.2.2. Exterior
- 5.3. Market Analysis, Insights and Forecast - by Region
- 5.3.1. Asia Pacific
- 5.3.2. North America
- 5.3.3. Europe
- 5.3.4. South America
- 5.3.5. Middle East and Africa
- 5.1. Market Analysis, Insights and Forecast - by Type
- 6. Asia Pacific Polyurethane Foam Market Analysis, Insights and Forecast, 2019-2031
- 6.1. Market Analysis, Insights and Forecast - by Type
- 6.1.1. Polyurethane Foams(PUFs)
- 6.1.1.1. Flexible Polyurethane Foam
- 6.1.1.2. Rigid Polyurethane Foam
- 6.1.2. Expanded Polypropylene Foam
- 6.1.3. PET Foam
- 6.1.4. Other Types
- 6.1.1. Polyurethane Foams(PUFs)
- 6.2. Market Analysis, Insights and Forecast - by Application
- 6.2.1. Interior
- 6.2.2. Exterior
- 6.1. Market Analysis, Insights and Forecast - by Type
- 7. North America Polyurethane Foam Market Analysis, Insights and Forecast, 2019-2031
- 7.1. Market Analysis, Insights and Forecast - by Type
- 7.1.1. Polyurethane Foams(PUFs)
- 7.1.1.1. Flexible Polyurethane Foam
- 7.1.1.2. Rigid Polyurethane Foam
- 7.1.2. Expanded Polypropylene Foam
- 7.1.3. PET Foam
- 7.1.4. Other Types
- 7.1.1. Polyurethane Foams(PUFs)
- 7.2. Market Analysis, Insights and Forecast - by Application
- 7.2.1. Interior
- 7.2.2. Exterior
- 7.1. Market Analysis, Insights and Forecast - by Type
- 8. Europe Polyurethane Foam Market Analysis, Insights and Forecast, 2019-2031
- 8.1. Market Analysis, Insights and Forecast - by Type
- 8.1.1. Polyurethane Foams(PUFs)
- 8.1.1.1. Flexible Polyurethane Foam
- 8.1.1.2. Rigid Polyurethane Foam
- 8.1.2. Expanded Polypropylene Foam
- 8.1.3. PET Foam
- 8.1.4. Other Types
- 8.1.1. Polyurethane Foams(PUFs)
- 8.2. Market Analysis, Insights and Forecast - by Application
- 8.2.1. Interior
- 8.2.2. Exterior
- 8.1. Market Analysis, Insights and Forecast - by Type
- 9. South America Polyurethane Foam Market Analysis, Insights and Forecast, 2019-2031
- 9.1. Market Analysis, Insights and Forecast - by Type
- 9.1.1. Polyurethane Foams(PUFs)
- 9.1.1.1. Flexible Polyurethane Foam
- 9.1.1.2. Rigid Polyurethane Foam
- 9.1.2. Expanded Polypropylene Foam
- 9.1.3. PET Foam
- 9.1.4. Other Types
- 9.1.1. Polyurethane Foams(PUFs)
- 9.2. Market Analysis, Insights and Forecast - by Application
- 9.2.1. Interior
- 9.2.2. Exterior
- 9.1. Market Analysis, Insights and Forecast - by Type
- 10. Middle East and Africa Polyurethane Foam Market Analysis, Insights and Forecast, 2019-2031
- 10.1. Market Analysis, Insights and Forecast - by Type
- 10.1.1. Polyurethane Foams(PUFs)
- 10.1.1.1. Flexible Polyurethane Foam
- 10.1.1.2. Rigid Polyurethane Foam
- 10.1.2. Expanded Polypropylene Foam
- 10.1.3. PET Foam
- 10.1.4. Other Types
- 10.1.1. Polyurethane Foams(PUFs)
- 10.2. Market Analysis, Insights and Forecast - by Application
- 10.2.1. Interior
- 10.2.2. Exterior
- 10.1. Market Analysis, Insights and Forecast - by Type
- 11. North America Polyurethane Foam Market Analysis, Insights and Forecast, 2019-2031
- 11.1. Market Analysis, Insights and Forecast - By Country/Sub-region
- 11.1.1 United States
- 11.1.2 Canada
- 11.1.3 Mexico
- 12. Europe Polyurethane Foam Market Analysis, Insights and Forecast, 2019-2031
- 12.1. Market Analysis, Insights and Forecast - By Country/Sub-region
- 12.1.1 Germany
- 12.1.2 France
- 12.1.3 Italy
- 12.1.4 United Kingdom
- 12.1.5 Netherlands
- 12.1.6 Rest of Europe
- 13. Asia Pacific Polyurethane Foam Market Analysis, Insights and Forecast, 2019-2031
- 13.1. Market Analysis, Insights and Forecast - By Country/Sub-region
- 13.1.1 China
- 13.1.2 Japan
- 13.1.3 India
- 13.1.4 South Korea
- 13.1.5 Taiwan
- 13.1.6 Australia
- 13.1.7 Rest of Asia-Pacific
- 14. South America Polyurethane Foam Market Analysis, Insights and Forecast, 2019-2031
- 14.1. Market Analysis, Insights and Forecast - By Country/Sub-region
- 14.1.1 Brazil
- 14.1.2 Argentina
- 14.1.3 Rest of South America
- 15. MEA Polyurethane Foam Market Analysis, Insights and Forecast, 2019-2031
- 15.1. Market Analysis, Insights and Forecast - By Country/Sub-region
- 15.1.1 Middle East
- 15.1.2 Africa
- 16. Competitive Analysis
- 16.1. Global Market Share Analysis 2024
- 16.2. Company Profiles
- 16.2.1 Recticel
- 16.2.1.1. Overview
- 16.2.1.2. Products
- 16.2.1.3. SWOT Analysis
- 16.2.1.4. Recent Developments
- 16.2.1.5. Financials (Based on Availability)
- 16.2.2 Saint-Gobain
- 16.2.2.1. Overview
- 16.2.2.2. Products
- 16.2.2.3. SWOT Analysis
- 16.2.2.4. Recent Developments
- 16.2.2.5. Financials (Based on Availability)
- 16.2.3 Rogers Corporation
- 16.2.3.1. Overview
- 16.2.3.2. Products
- 16.2.3.3. SWOT Analysis
- 16.2.3.4. Recent Developments
- 16.2.3.5. Financials (Based on Availability)
- 16.2.4 Woodbridge Foam Corporation
- 16.2.4.1. Overview
- 16.2.4.2. Products
- 16.2.4.3. SWOT Analysis
- 16.2.4.4. Recent Developments
- 16.2.4.5. Financials (Based on Availability)
- 16.2.5 BASF SE
- 16.2.5.1. Overview
- 16.2.5.2. Products
- 16.2.5.3. SWOT Analysis
- 16.2.5.4. Recent Developments
- 16.2.5.5. Financials (Based on Availability)
- 16.2.6 Dow
- 16.2.6.1. Overview
- 16.2.6.2. Products
- 16.2.6.3. SWOT Analysis
- 16.2.6.4. Recent Developments
- 16.2.6.5. Financials (Based on Availability)
- 16.2.7 Vita (Holdings) Limited
- 16.2.7.1. Overview
- 16.2.7.2. Products
- 16.2.7.3. SWOT Analysis
- 16.2.7.4. Recent Developments
- 16.2.7.5. Financials (Based on Availability)
- 16.2.8 Covestro AG
- 16.2.8.1. Overview
- 16.2.8.2. Products
- 16.2.8.3. SWOT Analysis
- 16.2.8.4. Recent Developments
- 16.2.8.5. Financials (Based on Availability)
- 16.2.9 Huntsman Corporation
- 16.2.9.1. Overview
- 16.2.9.2. Products
- 16.2.9.3. SWOT Analysis
- 16.2.9.4. Recent Developments
- 16.2.9.5. Financials (Based on Availability)
- 16.2.10 Bridgestone Corporation
- 16.2.10.1. Overview
- 16.2.10.2. Products
- 16.2.10.3. SWOT Analysis
- 16.2.10.4. Recent Developments
- 16.2.10.5. Financials (Based on Availability)
- 16.2.1 Recticel
List of Figures
- Figure 1: Global Polyurethane Foam Market Revenue Breakdown (Million, %) by Region 2024 & 2032
- Figure 2: Global Polyurethane Foam Market Volume Breakdown (K Tons, %) by Region 2024 & 2032
- Figure 3: North America Polyurethane Foam Market Revenue (Million), by Country 2024 & 2032
- Figure 4: North America Polyurethane Foam Market Volume (K Tons), by Country 2024 & 2032
- Figure 5: North America Polyurethane Foam Market Revenue Share (%), by Country 2024 & 2032
- Figure 6: North America Polyurethane Foam Market Volume Share (%), by Country 2024 & 2032
- Figure 7: Europe Polyurethane Foam Market Revenue (Million), by Country 2024 & 2032
- Figure 8: Europe Polyurethane Foam Market Volume (K Tons), by Country 2024 & 2032
- Figure 9: Europe Polyurethane Foam Market Revenue Share (%), by Country 2024 & 2032
- Figure 10: Europe Polyurethane Foam Market Volume Share (%), by Country 2024 & 2032
- Figure 11: Asia Pacific Polyurethane Foam Market Revenue (Million), by Country 2024 & 2032
- Figure 12: Asia Pacific Polyurethane Foam Market Volume (K Tons), by Country 2024 & 2032
- Figure 13: Asia Pacific Polyurethane Foam Market Revenue Share (%), by Country 2024 & 2032
- Figure 14: Asia Pacific Polyurethane Foam Market Volume Share (%), by Country 2024 & 2032
- Figure 15: South America Polyurethane Foam Market Revenue (Million), by Country 2024 & 2032
- Figure 16: South America Polyurethane Foam Market Volume (K Tons), by Country 2024 & 2032
- Figure 17: South America Polyurethane Foam Market Revenue Share (%), by Country 2024 & 2032
- Figure 18: South America Polyurethane Foam Market Volume Share (%), by Country 2024 & 2032
- Figure 19: MEA Polyurethane Foam Market Revenue (Million), by Country 2024 & 2032
- Figure 20: MEA Polyurethane Foam Market Volume (K Tons), by Country 2024 & 2032
- Figure 21: MEA Polyurethane Foam Market Revenue Share (%), by Country 2024 & 2032
- Figure 22: MEA Polyurethane Foam Market Volume Share (%), by Country 2024 & 2032
- Figure 23: Asia Pacific Polyurethane Foam Market Revenue (Million), by Type 2024 & 2032
- Figure 24: Asia Pacific Polyurethane Foam Market Volume (K Tons), by Type 2024 & 2032
- Figure 25: Asia Pacific Polyurethane Foam Market Revenue Share (%), by Type 2024 & 2032
- Figure 26: Asia Pacific Polyurethane Foam Market Volume Share (%), by Type 2024 & 2032
- Figure 27: Asia Pacific Polyurethane Foam Market Revenue (Million), by Application 2024 & 2032
- Figure 28: Asia Pacific Polyurethane Foam Market Volume (K Tons), by Application 2024 & 2032
- Figure 29: Asia Pacific Polyurethane Foam Market Revenue Share (%), by Application 2024 & 2032
- Figure 30: Asia Pacific Polyurethane Foam Market Volume Share (%), by Application 2024 & 2032
- Figure 31: Asia Pacific Polyurethane Foam Market Revenue (Million), by Country 2024 & 2032
- Figure 32: Asia Pacific Polyurethane Foam Market Volume (K Tons), by Country 2024 & 2032
- Figure 33: Asia Pacific Polyurethane Foam Market Revenue Share (%), by Country 2024 & 2032
- Figure 34: Asia Pacific Polyurethane Foam Market Volume Share (%), by Country 2024 & 2032
- Figure 35: North America Polyurethane Foam Market Revenue (Million), by Type 2024 & 2032
- Figure 36: North America Polyurethane Foam Market Volume (K Tons), by Type 2024 & 2032
- Figure 37: North America Polyurethane Foam Market Revenue Share (%), by Type 2024 & 2032
- Figure 38: North America Polyurethane Foam Market Volume Share (%), by Type 2024 & 2032
- Figure 39: North America Polyurethane Foam Market Revenue (Million), by Application 2024 & 2032
- Figure 40: North America Polyurethane Foam Market Volume (K Tons), by Application 2024 & 2032
- Figure 41: North America Polyurethane Foam Market Revenue Share (%), by Application 2024 & 2032
- Figure 42: North America Polyurethane Foam Market Volume Share (%), by Application 2024 & 2032
- Figure 43: North America Polyurethane Foam Market Revenue (Million), by Country 2024 & 2032
- Figure 44: North America Polyurethane Foam Market Volume (K Tons), by Country 2024 & 2032
- Figure 45: North America Polyurethane Foam Market Revenue Share (%), by Country 2024 & 2032
- Figure 46: North America Polyurethane Foam Market Volume Share (%), by Country 2024 & 2032
- Figure 47: Europe Polyurethane Foam Market Revenue (Million), by Type 2024 & 2032
- Figure 48: Europe Polyurethane Foam Market Volume (K Tons), by Type 2024 & 2032
- Figure 49: Europe Polyurethane Foam Market Revenue Share (%), by Type 2024 & 2032
- Figure 50: Europe Polyurethane Foam Market Volume Share (%), by Type 2024 & 2032
- Figure 51: Europe Polyurethane Foam Market Revenue (Million), by Application 2024 & 2032
- Figure 52: Europe Polyurethane Foam Market Volume (K Tons), by Application 2024 & 2032
- Figure 53: Europe Polyurethane Foam Market Revenue Share (%), by Application 2024 & 2032
- Figure 54: Europe Polyurethane Foam Market Volume Share (%), by Application 2024 & 2032
- Figure 55: Europe Polyurethane Foam Market Revenue (Million), by Country 2024 & 2032
- Figure 56: Europe Polyurethane Foam Market Volume (K Tons), by Country 2024 & 2032
- Figure 57: Europe Polyurethane Foam Market Revenue Share (%), by Country 2024 & 2032
- Figure 58: Europe Polyurethane Foam Market Volume Share (%), by Country 2024 & 2032
- Figure 59: South America Polyurethane Foam Market Revenue (Million), by Type 2024 & 2032
- Figure 60: South America Polyurethane Foam Market Volume (K Tons), by Type 2024 & 2032
- Figure 61: South America Polyurethane Foam Market Revenue Share (%), by Type 2024 & 2032
- Figure 62: South America Polyurethane Foam Market Volume Share (%), by Type 2024 & 2032
- Figure 63: South America Polyurethane Foam Market Revenue (Million), by Application 2024 & 2032
- Figure 64: South America Polyurethane Foam Market Volume (K Tons), by Application 2024 & 2032
- Figure 65: South America Polyurethane Foam Market Revenue Share (%), by Application 2024 & 2032
- Figure 66: South America Polyurethane Foam Market Volume Share (%), by Application 2024 & 2032
- Figure 67: South America Polyurethane Foam Market Revenue (Million), by Country 2024 & 2032
- Figure 68: South America Polyurethane Foam Market Volume (K Tons), by Country 2024 & 2032
- Figure 69: South America Polyurethane Foam Market Revenue Share (%), by Country 2024 & 2032
- Figure 70: South America Polyurethane Foam Market Volume Share (%), by Country 2024 & 2032
- Figure 71: Middle East and Africa Polyurethane Foam Market Revenue (Million), by Type 2024 & 2032
- Figure 72: Middle East and Africa Polyurethane Foam Market Volume (K Tons), by Type 2024 & 2032
- Figure 73: Middle East and Africa Polyurethane Foam Market Revenue Share (%), by Type 2024 & 2032
- Figure 74: Middle East and Africa Polyurethane Foam Market Volume Share (%), by Type 2024 & 2032
- Figure 75: Middle East and Africa Polyurethane Foam Market Revenue (Million), by Application 2024 & 2032
- Figure 76: Middle East and Africa Polyurethane Foam Market Volume (K Tons), by Application 2024 & 2032
- Figure 77: Middle East and Africa Polyurethane Foam Market Revenue Share (%), by Application 2024 & 2032
- Figure 78: Middle East and Africa Polyurethane Foam Market Volume Share (%), by Application 2024 & 2032
- Figure 79: Middle East and Africa Polyurethane Foam Market Revenue (Million), by Country 2024 & 2032
- Figure 80: Middle East and Africa Polyurethane Foam Market Volume (K Tons), by Country 2024 & 2032
- Figure 81: Middle East and Africa Polyurethane Foam Market Revenue Share (%), by Country 2024 & 2032
- Figure 82: Middle East and Africa Polyurethane Foam Market Volume Share (%), by Country 2024 & 2032
List of Tables
- Table 1: Global Polyurethane Foam Market Revenue Million Forecast, by Region 2019 & 2032
- Table 2: Global Polyurethane Foam Market Volume K Tons Forecast, by Region 2019 & 2032
- Table 3: Global Polyurethane Foam Market Revenue Million Forecast, by Type 2019 & 2032
- Table 4: Global Polyurethane Foam Market Volume K Tons Forecast, by Type 2019 & 2032
- Table 5: Global Polyurethane Foam Market Revenue Million Forecast, by Application 2019 & 2032
- Table 6: Global Polyurethane Foam Market Volume K Tons Forecast, by Application 2019 & 2032
- Table 7: Global Polyurethane Foam Market Revenue Million Forecast, by Region 2019 & 2032
- Table 8: Global Polyurethane Foam Market Volume K Tons Forecast, by Region 2019 & 2032
- Table 9: Global Polyurethane Foam Market Revenue Million Forecast, by Country 2019 & 2032
- Table 10: Global Polyurethane Foam Market Volume K Tons Forecast, by Country 2019 & 2032
- Table 11: United States Polyurethane Foam Market Revenue (Million) Forecast, by Application 2019 & 2032
- Table 12: United States Polyurethane Foam Market Volume (K Tons) Forecast, by Application 2019 & 2032
- Table 13: Canada Polyurethane Foam Market Revenue (Million) Forecast, by Application 2019 & 2032
- Table 14: Canada Polyurethane Foam Market Volume (K Tons) Forecast, by Application 2019 & 2032
- Table 15: Mexico Polyurethane Foam Market Revenue (Million) Forecast, by Application 2019 & 2032
- Table 16: Mexico Polyurethane Foam Market Volume (K Tons) Forecast, by Application 2019 & 2032
- Table 17: Global Polyurethane Foam Market Revenue Million Forecast, by Country 2019 & 2032
- Table 18: Global Polyurethane Foam Market Volume K Tons Forecast, by Country 2019 & 2032
- Table 19: Germany Polyurethane Foam Market Revenue (Million) Forecast, by Application 2019 & 2032
- Table 20: Germany Polyurethane Foam Market Volume (K Tons) Forecast, by Application 2019 & 2032
- Table 21: France Polyurethane Foam Market Revenue (Million) Forecast, by Application 2019 & 2032
- Table 22: France Polyurethane Foam Market Volume (K Tons) Forecast, by Application 2019 & 2032
- Table 23: Italy Polyurethane Foam Market Revenue (Million) Forecast, by Application 2019 & 2032
- Table 24: Italy Polyurethane Foam Market Volume (K Tons) Forecast, by Application 2019 & 2032
- Table 25: United Kingdom Polyurethane Foam Market Revenue (Million) Forecast, by Application 2019 & 2032
- Table 26: United Kingdom Polyurethane Foam Market Volume (K Tons) Forecast, by Application 2019 & 2032
- Table 27: Netherlands Polyurethane Foam Market Revenue (Million) Forecast, by Application 2019 & 2032
- Table 28: Netherlands Polyurethane Foam Market Volume (K Tons) Forecast, by Application 2019 & 2032
- Table 29: Rest of Europe Polyurethane Foam Market Revenue (Million) Forecast, by Application 2019 & 2032
- Table 30: Rest of Europe Polyurethane Foam Market Volume (K Tons) Forecast, by Application 2019 & 2032
- Table 31: Global Polyurethane Foam Market Revenue Million Forecast, by Country 2019 & 2032
- Table 32: Global Polyurethane Foam Market Volume K Tons Forecast, by Country 2019 & 2032
- Table 33: China Polyurethane Foam Market Revenue (Million) Forecast, by Application 2019 & 2032
- Table 34: China Polyurethane Foam Market Volume (K Tons) Forecast, by Application 2019 & 2032
- Table 35: Japan Polyurethane Foam Market Revenue (Million) Forecast, by Application 2019 & 2032
- Table 36: Japan Polyurethane Foam Market Volume (K Tons) Forecast, by Application 2019 & 2032
- Table 37: India Polyurethane Foam Market Revenue (Million) Forecast, by Application 2019 & 2032
- Table 38: India Polyurethane Foam Market Volume (K Tons) Forecast, by Application 2019 & 2032
- Table 39: South Korea Polyurethane Foam Market Revenue (Million) Forecast, by Application 2019 & 2032
- Table 40: South Korea Polyurethane Foam Market Volume (K Tons) Forecast, by Application 2019 & 2032
- Table 41: Taiwan Polyurethane Foam Market Revenue (Million) Forecast, by Application 2019 & 2032
- Table 42: Taiwan Polyurethane Foam Market Volume (K Tons) Forecast, by Application 2019 & 2032
- Table 43: Australia Polyurethane Foam Market Revenue (Million) Forecast, by Application 2019 & 2032
- Table 44: Australia Polyurethane Foam Market Volume (K Tons) Forecast, by Application 2019 & 2032
- Table 45: Rest of Asia-Pacific Polyurethane Foam Market Revenue (Million) Forecast, by Application 2019 & 2032
- Table 46: Rest of Asia-Pacific Polyurethane Foam Market Volume (K Tons) Forecast, by Application 2019 & 2032
- Table 47: Global Polyurethane Foam Market Revenue Million Forecast, by Country 2019 & 2032
- Table 48: Global Polyurethane Foam Market Volume K Tons Forecast, by Country 2019 & 2032
- Table 49: Brazil Polyurethane Foam Market Revenue (Million) Forecast, by Application 2019 & 2032
- Table 50: Brazil Polyurethane Foam Market Volume (K Tons) Forecast, by Application 2019 & 2032
- Table 51: Argentina Polyurethane Foam Market Revenue (Million) Forecast, by Application 2019 & 2032
- Table 52: Argentina Polyurethane Foam Market Volume (K Tons) Forecast, by Application 2019 & 2032
- Table 53: Rest of South America Polyurethane Foam Market Revenue (Million) Forecast, by Application 2019 & 2032
- Table 54: Rest of South America Polyurethane Foam Market Volume (K Tons) Forecast, by Application 2019 & 2032
- Table 55: Global Polyurethane Foam Market Revenue Million Forecast, by Country 2019 & 2032
- Table 56: Global Polyurethane Foam Market Volume K Tons Forecast, by Country 2019 & 2032
- Table 57: Middle East Polyurethane Foam Market Revenue (Million) Forecast, by Application 2019 & 2032
- Table 58: Middle East Polyurethane Foam Market Volume (K Tons) Forecast, by Application 2019 & 2032
- Table 59: Africa Polyurethane Foam Market Revenue (Million) Forecast, by Application 2019 & 2032
- Table 60: Africa Polyurethane Foam Market Volume (K Tons) Forecast, by Application 2019 & 2032
- Table 61: Global Polyurethane Foam Market Revenue Million Forecast, by Type 2019 & 2032
- Table 62: Global Polyurethane Foam Market Volume K Tons Forecast, by Type 2019 & 2032
- Table 63: Global Polyurethane Foam Market Revenue Million Forecast, by Application 2019 & 2032
- Table 64: Global Polyurethane Foam Market Volume K Tons Forecast, by Application 2019 & 2032
- Table 65: Global Polyurethane Foam Market Revenue Million Forecast, by Country 2019 & 2032
- Table 66: Global Polyurethane Foam Market Volume K Tons Forecast, by Country 2019 & 2032
- Table 67: China Polyurethane Foam Market Revenue (Million) Forecast, by Application 2019 & 2032
- Table 68: China Polyurethane Foam Market Volume (K Tons) Forecast, by Application 2019 & 2032
- Table 69: India Polyurethane Foam Market Revenue (Million) Forecast, by Application 2019 & 2032
- Table 70: India Polyurethane Foam Market Volume (K Tons) Forecast, by Application 2019 & 2032
- Table 71: Japan Polyurethane Foam Market Revenue (Million) Forecast, by Application 2019 & 2032
- Table 72: Japan Polyurethane Foam Market Volume (K Tons) Forecast, by Application 2019 & 2032
- Table 73: South Korea Polyurethane Foam Market Revenue (Million) Forecast, by Application 2019 & 2032
- Table 74: South Korea Polyurethane Foam Market Volume (K Tons) Forecast, by Application 2019 & 2032
- Table 75: Rest of Asia Pacific Polyurethane Foam Market Revenue (Million) Forecast, by Application 2019 & 2032
- Table 76: Rest of Asia Pacific Polyurethane Foam Market Volume (K Tons) Forecast, by Application 2019 & 2032
- Table 77: Global Polyurethane Foam Market Revenue Million Forecast, by Type 2019 & 2032
- Table 78: Global Polyurethane Foam Market Volume K Tons Forecast, by Type 2019 & 2032
- Table 79: Global Polyurethane Foam Market Revenue Million Forecast, by Application 2019 & 2032
- Table 80: Global Polyurethane Foam Market Volume K Tons Forecast, by Application 2019 & 2032
- Table 81: Global Polyurethane Foam Market Revenue Million Forecast, by Country 2019 & 2032
- Table 82: Global Polyurethane Foam Market Volume K Tons Forecast, by Country 2019 & 2032
- Table 83: United States Polyurethane Foam Market Revenue (Million) Forecast, by Application 2019 & 2032
- Table 84: United States Polyurethane Foam Market Volume (K Tons) Forecast, by Application 2019 & 2032
- Table 85: Canada Polyurethane Foam Market Revenue (Million) Forecast, by Application 2019 & 2032
- Table 86: Canada Polyurethane Foam Market Volume (K Tons) Forecast, by Application 2019 & 2032
- Table 87: Mexico Polyurethane Foam Market Revenue (Million) Forecast, by Application 2019 & 2032
- Table 88: Mexico Polyurethane Foam Market Volume (K Tons) Forecast, by Application 2019 & 2032
- Table 89: Global Polyurethane Foam Market Revenue Million Forecast, by Type 2019 & 2032
- Table 90: Global Polyurethane Foam Market Volume K Tons Forecast, by Type 2019 & 2032
- Table 91: Global Polyurethane Foam Market Revenue Million Forecast, by Application 2019 & 2032
- Table 92: Global Polyurethane Foam Market Volume K Tons Forecast, by Application 2019 & 2032
- Table 93: Global Polyurethane Foam Market Revenue Million Forecast, by Country 2019 & 2032
- Table 94: Global Polyurethane Foam Market Volume K Tons Forecast, by Country 2019 & 2032
- Table 95: Germany Polyurethane Foam Market Revenue (Million) Forecast, by Application 2019 & 2032
- Table 96: Germany Polyurethane Foam Market Volume (K Tons) Forecast, by Application 2019 & 2032
- Table 97: United Kingdom Polyurethane Foam Market Revenue (Million) Forecast, by Application 2019 & 2032
- Table 98: United Kingdom Polyurethane Foam Market Volume (K Tons) Forecast, by Application 2019 & 2032
- Table 99: Italy Polyurethane Foam Market Revenue (Million) Forecast, by Application 2019 & 2032
- Table 100: Italy Polyurethane Foam Market Volume (K Tons) Forecast, by Application 2019 & 2032
- Table 101: France Polyurethane Foam Market Revenue (Million) Forecast, by Application 2019 & 2032
- Table 102: France Polyurethane Foam Market Volume (K Tons) Forecast, by Application 2019 & 2032
- Table 103: Rest of Europe Polyurethane Foam Market Revenue (Million) Forecast, by Application 2019 & 2032
- Table 104: Rest of Europe Polyurethane Foam Market Volume (K Tons) Forecast, by Application 2019 & 2032
- Table 105: Global Polyurethane Foam Market Revenue Million Forecast, by Type 2019 & 2032
- Table 106: Global Polyurethane Foam Market Volume K Tons Forecast, by Type 2019 & 2032
- Table 107: Global Polyurethane Foam Market Revenue Million Forecast, by Application 2019 & 2032
- Table 108: Global Polyurethane Foam Market Volume K Tons Forecast, by Application 2019 & 2032
- Table 109: Global Polyurethane Foam Market Revenue Million Forecast, by Country 2019 & 2032
- Table 110: Global Polyurethane Foam Market Volume K Tons Forecast, by Country 2019 & 2032
- Table 111: Brazil Polyurethane Foam Market Revenue (Million) Forecast, by Application 2019 & 2032
- Table 112: Brazil Polyurethane Foam Market Volume (K Tons) Forecast, by Application 2019 & 2032
- Table 113: Argentina Polyurethane Foam Market Revenue (Million) Forecast, by Application 2019 & 2032
- Table 114: Argentina Polyurethane Foam Market Volume (K Tons) Forecast, by Application 2019 & 2032
- Table 115: Rest of South America Polyurethane Foam Market Revenue (Million) Forecast, by Application 2019 & 2032
- Table 116: Rest of South America Polyurethane Foam Market Volume (K Tons) Forecast, by Application 2019 & 2032
- Table 117: Global Polyurethane Foam Market Revenue Million Forecast, by Type 2019 & 2032
- Table 118: Global Polyurethane Foam Market Volume K Tons Forecast, by Type 2019 & 2032
- Table 119: Global Polyurethane Foam Market Revenue Million Forecast, by Application 2019 & 2032
- Table 120: Global Polyurethane Foam Market Volume K Tons Forecast, by Application 2019 & 2032
- Table 121: Global Polyurethane Foam Market Revenue Million Forecast, by Country 2019 & 2032
- Table 122: Global Polyurethane Foam Market Volume K Tons Forecast, by Country 2019 & 2032
- Table 123: Saudi Arabia Polyurethane Foam Market Revenue (Million) Forecast, by Application 2019 & 2032
- Table 124: Saudi Arabia Polyurethane Foam Market Volume (K Tons) Forecast, by Application 2019 & 2032
- Table 125: South Africa Polyurethane Foam Market Revenue (Million) Forecast, by Application 2019 & 2032
- Table 126: South Africa Polyurethane Foam Market Volume (K Tons) Forecast, by Application 2019 & 2032
- Table 127: Rest of Middle East and Africa Polyurethane Foam Market Revenue (Million) Forecast, by Application 2019 & 2032
- Table 128: Rest of Middle East and Africa Polyurethane Foam Market Volume (K Tons) Forecast, by Application 2019 & 2032
Frequently Asked Questions
1. What is the projected Compound Annual Growth Rate (CAGR) of the Polyurethane Foam Market?
The projected CAGR is approximately 5.18%.
2. Which companies are prominent players in the Polyurethane Foam Market?
Key companies in the market include Recticel, Saint-Gobain, Rogers Corporation, Woodbridge Foam Corporation, BASF SE, Dow, Vita (Holdings) Limited, Covestro AG, Huntsman Corporation, Bridgestone Corporation.
3. What are the main segments of the Polyurethane Foam Market?
The market segments include Type, Application.
4. Can you provide details about the market size?
The market size is estimated to be USD 11.44 Million as of 2022.
5. What are some drivers contributing to market growth?
Growing Emphasis on the Sustainable Production of Automotive Foams; Growing Need for Weight Reduction; Other Drivers.
6. What are the notable trends driving market growth?
Interior Applications to Dominate the Market.
7. Are there any restraints impacting market growth?
Declining Automotive Production in Major Economies of Europe; Availability of Eco-Friendly Bio-Foams.
8. Can you provide examples of recent developments in the market?
October 2022: BASF SE opened a new Polyurethane Application Development Laboratory in Mumbai, India which will support manufacturers of molded polyurethane foams used in the automotive industry to test these foams for comfort, performance, emission reduction, and productivity.
9. What pricing options are available for accessing the report?
Pricing options include single-user, multi-user, and enterprise licenses priced at USD 4750, USD 5250, and USD 8750 respectively.
10. Is the market size provided in terms of value or volume?
The market size is provided in terms of value, measured in Million and volume, measured in K Tons.
11. Are there any specific market keywords associated with the report?
Yes, the market keyword associated with the report is "Polyurethane Foam Market," which aids in identifying and referencing the specific market segment covered.
12. How do I determine which pricing option suits my needs best?
The pricing options vary based on user requirements and access needs. Individual users may opt for single-user licenses, while businesses requiring broader access may choose multi-user or enterprise licenses for cost-effective access to the report.
13. Are there any additional resources or data provided in the Polyurethane Foam Market report?
While the report offers comprehensive insights, it's advisable to review the specific contents or supplementary materials provided to ascertain if additional resources or data are available.
14. How can I stay updated on further developments or reports in the Polyurethane Foam Market?
To stay informed about further developments, trends, and reports in the Polyurethane Foam Market, consider subscribing to industry newsletters, following relevant companies and organizations, or regularly checking reputable industry news sources and publications.
Methodology
Step 1 - Identification of Relevant Samples Size from Population Database


Step 2 - Approaches for Defining Global Market Size (Value, Volume* & Price*)

Note*: In applicable scenarios
Step 3 - Data Sources
Primary Research
- Web Analytics
- Survey Reports
- Research Institute
- Latest Research Reports
- Opinion Leaders
Secondary Research
- Annual Reports
- White Paper
- Latest Press Release
- Industry Association
- Paid Database
- Investor Presentations

Step 4 - Data Triangulation
Involves using different sources of information in order to increase the validity of a study
These sources are likely to be stakeholders in a program - participants, other researchers, program staff, other community members, and so on.
Then we put all data in single framework & apply various statistical tools to find out the dynamic on the market.
During the analysis stage, feedback from the stakeholder groups would be compared to determine areas of agreement as well as areas of divergence


