
Key Insights
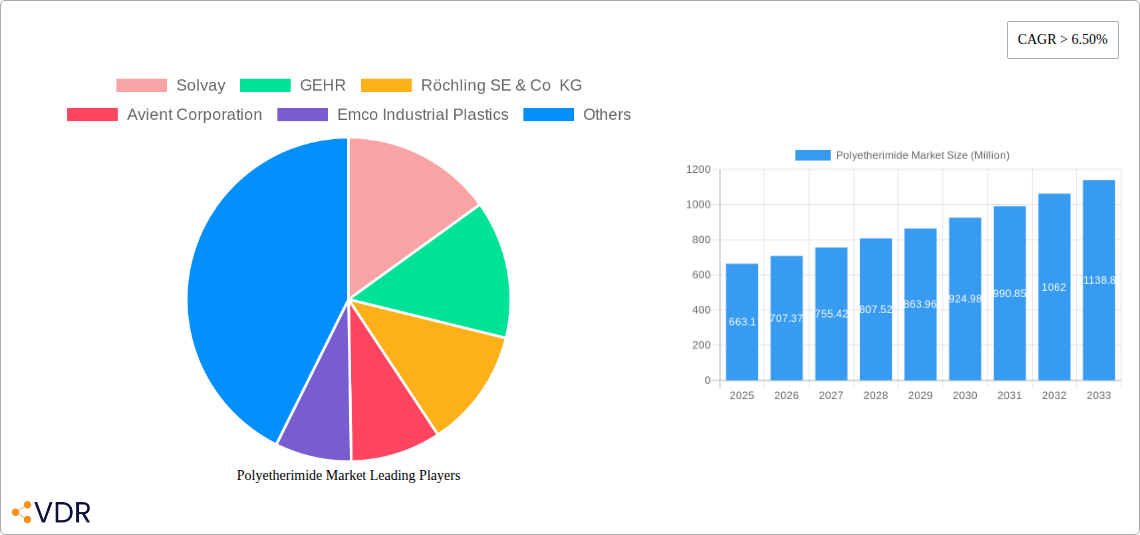
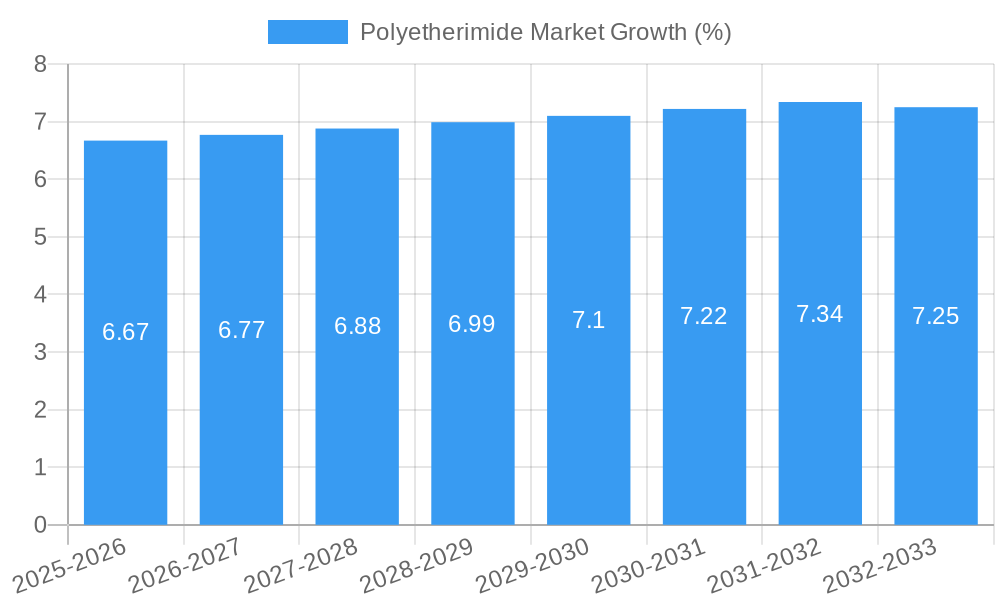
The Polyetherimide (PEI) market, valued at $663.10 million in 2025, is projected to experience robust growth, exceeding a 6.50% CAGR from 2025 to 2033. This expansion is driven by the increasing demand for high-performance materials across diverse sectors. The automotive industry's push for lightweight and durable components, coupled with the electronics sector's need for high-temperature resistant materials in advanced devices, are significant contributors to market growth. Furthermore, the rising adoption of PEI in medical devices, owing to its biocompatibility and sterilization resistance, further fuels market expansion. Reinforced PEI grades dominate the market due to their superior mechanical properties, while the transportation and electrical & electronics sectors are major end-users. Growth is expected to be geographically diverse, with North America and Asia-Pacific showing significant potential due to strong industrial bases and technological advancements. However, the relatively high cost of PEI compared to alternative polymers could act as a restraint, particularly in price-sensitive applications. Ongoing research and development efforts focused on improving the cost-effectiveness and expanding the applications of PEI are anticipated to mitigate this challenge.
The competitive landscape is characterized by both established players like Solvay, SABIC, and Mitsubishi Chemical, and specialized manufacturers focusing on specific applications. Strategic partnerships, acquisitions, and continuous innovation in material properties are shaping the market dynamics. The forecast period (2025-2033) anticipates consistent growth, driven by sustained demand from key industries and ongoing technological advancements within the PEI sector. Factors such as improved processing techniques and the development of new grades with enhanced properties will further bolster market expansion. Geographic expansion into emerging markets in Asia-Pacific and South America will contribute to the overall market size. However, maintaining consistent supply chain stability and addressing potential environmental concerns associated with PEI production will be crucial for long-term growth.
Polyetherimide Market: A Comprehensive Report (2019-2033)
This in-depth report provides a comprehensive analysis of the Polyetherimide (PEI) market, encompassing market dynamics, growth trends, regional insights, product landscapes, and key player strategies. The study period spans from 2019 to 2033, with 2025 serving as the base and estimated year. The report segments the market by Grade (Reinforced, Unreinforced) and End-User Industry (Transportation, Electrical and Electronics, Consumer Goods, Healthcare, Household and Industrial Appliances, Others), offering granular insights for strategic decision-making. The report is crucial for manufacturers, investors, and industry professionals seeking to navigate the complexities of this dynamic market. Expected market value in 2025 is XX Million.
Keywords: Polyetherimide, PEI, Market Report, Market Analysis, Market Size, Market Growth, Market Forecast, Reinforced Polyetherimide, Unreinforced Polyetherimide, Transportation, Electrical and Electronics, Consumer Goods, Healthcare, Household Appliances, Solvay, GEHR, Röchling, Avient, SABIC, Mitsubishi Chemical, RTP Company, Kuraray, Aikolon, Ensinger, Eagle Performance Plastics
Polyetherimide Market Dynamics & Structure
The Polyetherimide market exhibits a moderately concentrated structure, with key players holding significant market shares. Technological innovation, particularly in enhancing PEI's high-temperature resistance and chemical stability, is a primary growth driver. Stringent regulatory frameworks concerning material safety and environmental impact influence market dynamics. Competitive pressure from alternative high-performance polymers exists, while the market's growth is influenced by demographics in key end-user sectors. M&A activity has been moderate, with a focus on enhancing product portfolios and expanding geographical reach. Over the historical period (2019-2024), approximately xx M&A deals were recorded in the sector.
- Market Concentration: Moderately concentrated, with top 5 players holding approximately xx% market share in 2025.
- Innovation Drivers: High-temperature resistance, improved chemical resistance, and enhanced processability.
- Regulatory Landscape: Stringent safety and environmental regulations, impacting material selection and manufacturing processes.
- Competitive Substitutes: Polyimides, PEEK, and other high-performance polymers.
- End-User Demographics: Growth influenced by aging populations (Healthcare), increasing electronic device usage (Electrical and Electronics), and automotive advancements (Transportation).
Polyetherimide Market Growth Trends & Insights
The Polyetherimide market is experiencing steady growth, driven by increasing demand from diverse end-user industries. The market size expanded from xx Million in 2019 to xx Million in 2024, exhibiting a CAGR of xx%. This growth trajectory is projected to continue, with a forecasted CAGR of xx% from 2025 to 2033, reaching an estimated xx Million by 2033. Technological advancements, such as the development of specialized grades with improved properties, are driving adoption rates, particularly in high-demand applications such as aerospace and medical devices. Consumer preference shifts towards high-performance, durable products further fuel market growth. The market penetration rate in key end-user industries is also expected to increase significantly during the forecast period.
Dominant Regions, Countries, or Segments in Polyetherimide Market
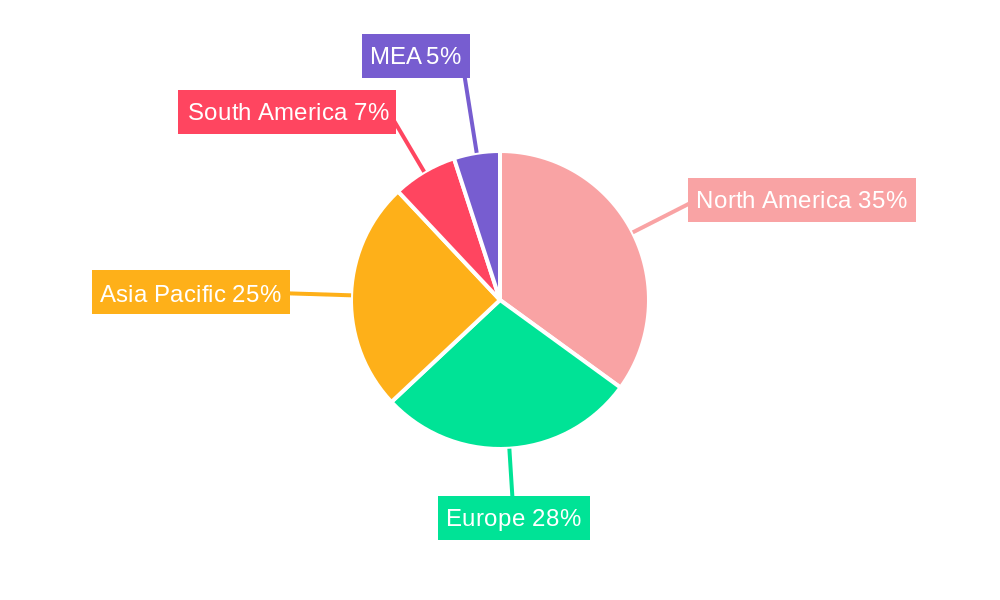
North America currently holds the largest market share, driven by strong demand from the electrical and electronics sector and robust growth in the transportation industry. Within North America, the United States is the dominant market. The Asia-Pacific region is expected to experience the fastest growth rate during the forecast period, fueled by increasing industrialization and rising disposable incomes. Within the product segments, reinforced polyetherimide holds a larger market share due to its enhanced mechanical properties, suitable for demanding applications. The transportation and electrical & electronics end-user segments are the primary contributors to market revenue.
- Key Drivers in North America: Strong domestic demand, advanced manufacturing infrastructure, and technological leadership.
- Key Drivers in Asia-Pacific: Rapid industrialization, growing consumer base, and government initiatives promoting technological advancements.
- Reinforced PEI Dominance: Superior mechanical properties cater to high-performance applications.
- Transportation & Electrical/Electronics Dominance: High demand driven by stringent performance requirements.
Polyetherimide Market Product Landscape
PEI products are offered in various grades, tailored for specific applications. Reinforced grades excel in high-stress environments, while unreinforced grades are suitable for applications requiring flexibility. Technological advancements focus on enhancing thermal stability, chemical resistance, and processability, allowing for broader applications across diverse industries. Unique selling propositions include superior heat resistance, exceptional chemical inertness, and low flammability. Recent innovations include the development of bio-based PEI variants, furthering sustainability efforts.
Key Drivers, Barriers & Challenges in Polyetherimide Market
Key Drivers: Growing demand from electronics, transportation, and healthcare sectors; advancements in material properties enhancing application diversity; and government regulations emphasizing high-performance, sustainable materials.
Key Challenges: High manufacturing costs compared to some alternative polymers; potential supply chain disruptions; and intense competition from established and emerging players. The impact of increased raw material costs on profitability is estimated at xx% in 2025.
Emerging Opportunities in Polyetherimide Market
Untapped markets in developing economies present significant opportunities for expansion. The development of innovative applications in 3D printing and additive manufacturing holds immense potential. Evolving consumer preferences for sustainable and recyclable materials drive demand for bio-based PEI alternatives.
Growth Accelerators in the Polyetherimide Market Industry
Technological breakthroughs in improving PEI's processability and expanding its application range are key growth catalysts. Strategic partnerships between material suppliers and end-users facilitate product development and market penetration. Expansion into niche markets, such as aerospace and medical devices, offer further growth prospects.
Key Players Shaping the Polyetherimide Market Market
- Solvay
- GEHR
- Röchling SE & Co KG
- Avient Corporation
- Emco Industrial Plastics
- SABIC
- The Mitsubishi Chemical Group of companies
- RTP Company
- Kuraray Europe GmbH
- Aikolon Oy
- Ensinger
- Eagle Performance Plastics Inc
Notable Milestones in Polyetherimide Market Sector
- 2020: Solvay launched a new high-performance PEI grade with enhanced thermal stability.
- 2022: Avient Corporation announced a strategic partnership to expand its PEI product portfolio.
- 2023: Increased investment in R&D for bio-based PEI alternatives by several key players. (Further details with specific company would be added here if available)
In-Depth Polyetherimide Market Market Outlook
The Polyetherimide market is poised for sustained growth, driven by ongoing technological advancements and increasing demand from various sectors. Strategic investments in R&D, coupled with expansion into high-growth markets, will further shape the industry landscape. Opportunities exist for companies to capitalize on the growing demand for sustainable and high-performance materials, leading to significant market expansion in the coming years.
Polyetherimide Market Segmentation
-
1. Grade
- 1.1. Reinforced
- 1.2. Unreinforced
-
2. End-User Industry
- 2.1. Transportation
- 2.2. Electrical and Electronics
- 2.3. Consumer Goods
- 2.4. Healthcare
- 2.5. Household and Industrial Appliances
- 2.6. Others
Polyetherimide Market Segmentation By Geography
-
1. Asia Pacific
- 1.1. China
- 1.2. India
- 1.3. Japan
- 1.4. South Korea
- 1.5. Southeast ASia
- 1.6. Australia
- 1.7. Rest of Asia Pacific
-
2. North America
- 2.1. United States
- 2.2. Canada
- 2.3. Mexico
-
3. Europe
- 3.1. Germany
- 3.2. United Kingdom
- 3.3. Italy
- 3.4. France
- 3.5. Spain
- 3.6. Rest of Europe
-
4. South America
- 4.1. Brazil
- 4.2. Argentina
- 4.3. Colombia
- 4.4. Rest of South America
-
5. Middle East and Africa
- 5.1. Saudi Arabia
- 5.2. South Africa
- 5.3. UAE
- 5.4. Rest of Middle East and Africa
Polyetherimide Market REPORT HIGHLIGHTS
| Aspects | Details |
|---|---|
| Study Period | 2019-2033 |
| Base Year | 2024 |
| Estimated Year | 2025 |
| Forecast Period | 2025-2033 |
| Historical Period | 2019-2024 |
| Growth Rate | CAGR of > 6.50% from 2019-2033 |
| Segmentation |
|
Table of Contents
- 1. Introduction
- 1.1. Research Scope
- 1.2. Market Segmentation
- 1.3. Research Methodology
- 1.4. Definitions and Assumptions
- 2. Executive Summary
- 2.1. Introduction
- 3. Market Dynamics
- 3.1. Introduction
- 3.2. Market Drivers
- 3.2.1. Increasing Demand from the Transportation Industry; Rapid Growth in the Automotive Sector; Increasing Usage in Healthcare Sector
- 3.3. Market Restrains
- 3.3.1. High Price When Compared to the Conventional Polymers; Availability of Substitute Materials
- 3.4. Market Trends
- 3.4.1. Increasing demand from Electrical & Electronics Industry
- 4. Market Factor Analysis
- 4.1. Porters Five Forces
- 4.2. Supply/Value Chain
- 4.3. PESTEL analysis
- 4.4. Market Entropy
- 4.5. Patent/Trademark Analysis
- 5. Global Polyetherimide Market Analysis, Insights and Forecast, 2019-2031
- 5.1. Market Analysis, Insights and Forecast - by Grade
- 5.1.1. Reinforced
- 5.1.2. Unreinforced
- 5.2. Market Analysis, Insights and Forecast - by End-User Industry
- 5.2.1. Transportation
- 5.2.2. Electrical and Electronics
- 5.2.3. Consumer Goods
- 5.2.4. Healthcare
- 5.2.5. Household and Industrial Appliances
- 5.2.6. Others
- 5.3. Market Analysis, Insights and Forecast - by Region
- 5.3.1. Asia Pacific
- 5.3.2. North America
- 5.3.3. Europe
- 5.3.4. South America
- 5.3.5. Middle East and Africa
- 5.1. Market Analysis, Insights and Forecast - by Grade
- 6. Asia Pacific Polyetherimide Market Analysis, Insights and Forecast, 2019-2031
- 6.1. Market Analysis, Insights and Forecast - by Grade
- 6.1.1. Reinforced
- 6.1.2. Unreinforced
- 6.2. Market Analysis, Insights and Forecast - by End-User Industry
- 6.2.1. Transportation
- 6.2.2. Electrical and Electronics
- 6.2.3. Consumer Goods
- 6.2.4. Healthcare
- 6.2.5. Household and Industrial Appliances
- 6.2.6. Others
- 6.1. Market Analysis, Insights and Forecast - by Grade
- 7. North America Polyetherimide Market Analysis, Insights and Forecast, 2019-2031
- 7.1. Market Analysis, Insights and Forecast - by Grade
- 7.1.1. Reinforced
- 7.1.2. Unreinforced
- 7.2. Market Analysis, Insights and Forecast - by End-User Industry
- 7.2.1. Transportation
- 7.2.2. Electrical and Electronics
- 7.2.3. Consumer Goods
- 7.2.4. Healthcare
- 7.2.5. Household and Industrial Appliances
- 7.2.6. Others
- 7.1. Market Analysis, Insights and Forecast - by Grade
- 8. Europe Polyetherimide Market Analysis, Insights and Forecast, 2019-2031
- 8.1. Market Analysis, Insights and Forecast - by Grade
- 8.1.1. Reinforced
- 8.1.2. Unreinforced
- 8.2. Market Analysis, Insights and Forecast - by End-User Industry
- 8.2.1. Transportation
- 8.2.2. Electrical and Electronics
- 8.2.3. Consumer Goods
- 8.2.4. Healthcare
- 8.2.5. Household and Industrial Appliances
- 8.2.6. Others
- 8.1. Market Analysis, Insights and Forecast - by Grade
- 9. South America Polyetherimide Market Analysis, Insights and Forecast, 2019-2031
- 9.1. Market Analysis, Insights and Forecast - by Grade
- 9.1.1. Reinforced
- 9.1.2. Unreinforced
- 9.2. Market Analysis, Insights and Forecast - by End-User Industry
- 9.2.1. Transportation
- 9.2.2. Electrical and Electronics
- 9.2.3. Consumer Goods
- 9.2.4. Healthcare
- 9.2.5. Household and Industrial Appliances
- 9.2.6. Others
- 9.1. Market Analysis, Insights and Forecast - by Grade
- 10. Middle East and Africa Polyetherimide Market Analysis, Insights and Forecast, 2019-2031
- 10.1. Market Analysis, Insights and Forecast - by Grade
- 10.1.1. Reinforced
- 10.1.2. Unreinforced
- 10.2. Market Analysis, Insights and Forecast - by End-User Industry
- 10.2.1. Transportation
- 10.2.2. Electrical and Electronics
- 10.2.3. Consumer Goods
- 10.2.4. Healthcare
- 10.2.5. Household and Industrial Appliances
- 10.2.6. Others
- 10.1. Market Analysis, Insights and Forecast - by Grade
- 11. North America Polyetherimide Market Analysis, Insights and Forecast, 2019-2031
- 11.1. Market Analysis, Insights and Forecast - By Country/Sub-region
- 11.1.1 United States
- 11.1.2 Canada
- 11.1.3 Mexico
- 12. Europe Polyetherimide Market Analysis, Insights and Forecast, 2019-2031
- 12.1. Market Analysis, Insights and Forecast - By Country/Sub-region
- 12.1.1 Germany
- 12.1.2 United Kingdom
- 12.1.3 France
- 12.1.4 Spain
- 12.1.5 Italy
- 12.1.6 Spain
- 12.1.7 Belgium
- 12.1.8 Netherland
- 12.1.9 Nordics
- 12.1.10 Rest of Europe
- 13. Asia Pacific Polyetherimide Market Analysis, Insights and Forecast, 2019-2031
- 13.1. Market Analysis, Insights and Forecast - By Country/Sub-region
- 13.1.1 China
- 13.1.2 Japan
- 13.1.3 India
- 13.1.4 South Korea
- 13.1.5 Southeast Asia
- 13.1.6 Australia
- 13.1.7 Indonesia
- 13.1.8 Phillipes
- 13.1.9 Singapore
- 13.1.10 Thailandc
- 13.1.11 Rest of Asia Pacific
- 14. South America Polyetherimide Market Analysis, Insights and Forecast, 2019-2031
- 14.1. Market Analysis, Insights and Forecast - By Country/Sub-region
- 14.1.1 Brazil
- 14.1.2 Argentina
- 14.1.3 Peru
- 14.1.4 Chile
- 14.1.5 Colombia
- 14.1.6 Ecuador
- 14.1.7 Venezuela
- 14.1.8 Rest of South America
- 15. North America Polyetherimide Market Analysis, Insights and Forecast, 2019-2031
- 15.1. Market Analysis, Insights and Forecast - By Country/Sub-region
- 15.1.1 United States
- 15.1.2 Canada
- 15.1.3 Mexico
- 16. MEA Polyetherimide Market Analysis, Insights and Forecast, 2019-2031
- 16.1. Market Analysis, Insights and Forecast - By Country/Sub-region
- 16.1.1 United Arab Emirates
- 16.1.2 Saudi Arabia
- 16.1.3 South Africa
- 16.1.4 Rest of Middle East and Africa
- 17. Competitive Analysis
- 17.1. Global Market Share Analysis 2024
- 17.2. Company Profiles
- 17.2.1 Solvay
- 17.2.1.1. Overview
- 17.2.1.2. Products
- 17.2.1.3. SWOT Analysis
- 17.2.1.4. Recent Developments
- 17.2.1.5. Financials (Based on Availability)
- 17.2.2 GEHR
- 17.2.2.1. Overview
- 17.2.2.2. Products
- 17.2.2.3. SWOT Analysis
- 17.2.2.4. Recent Developments
- 17.2.2.5. Financials (Based on Availability)
- 17.2.3 Röchling SE & Co KG
- 17.2.3.1. Overview
- 17.2.3.2. Products
- 17.2.3.3. SWOT Analysis
- 17.2.3.4. Recent Developments
- 17.2.3.5. Financials (Based on Availability)
- 17.2.4 Avient Corporation
- 17.2.4.1. Overview
- 17.2.4.2. Products
- 17.2.4.3. SWOT Analysis
- 17.2.4.4. Recent Developments
- 17.2.4.5. Financials (Based on Availability)
- 17.2.5 Emco Industrial Plastics
- 17.2.5.1. Overview
- 17.2.5.2. Products
- 17.2.5.3. SWOT Analysis
- 17.2.5.4. Recent Developments
- 17.2.5.5. Financials (Based on Availability)
- 17.2.6 SABIC
- 17.2.6.1. Overview
- 17.2.6.2. Products
- 17.2.6.3. SWOT Analysis
- 17.2.6.4. Recent Developments
- 17.2.6.5. Financials (Based on Availability)
- 17.2.7 the Mitsubishi Chemical Group of companies
- 17.2.7.1. Overview
- 17.2.7.2. Products
- 17.2.7.3. SWOT Analysis
- 17.2.7.4. Recent Developments
- 17.2.7.5. Financials (Based on Availability)
- 17.2.8 RTP Company
- 17.2.8.1. Overview
- 17.2.8.2. Products
- 17.2.8.3. SWOT Analysis
- 17.2.8.4. Recent Developments
- 17.2.8.5. Financials (Based on Availability)
- 17.2.9 Kuraray Europe GmbH
- 17.2.9.1. Overview
- 17.2.9.2. Products
- 17.2.9.3. SWOT Analysis
- 17.2.9.4. Recent Developments
- 17.2.9.5. Financials (Based on Availability)
- 17.2.10 Aikolon Oy
- 17.2.10.1. Overview
- 17.2.10.2. Products
- 17.2.10.3. SWOT Analysis
- 17.2.10.4. Recent Developments
- 17.2.10.5. Financials (Based on Availability)
- 17.2.11 Ensinger
- 17.2.11.1. Overview
- 17.2.11.2. Products
- 17.2.11.3. SWOT Analysis
- 17.2.11.4. Recent Developments
- 17.2.11.5. Financials (Based on Availability)
- 17.2.12 Eagle Performance Plastics Inc
- 17.2.12.1. Overview
- 17.2.12.2. Products
- 17.2.12.3. SWOT Analysis
- 17.2.12.4. Recent Developments
- 17.2.12.5. Financials (Based on Availability)
- 17.2.1 Solvay
List of Figures
- Figure 1: Global Polyetherimide Market Revenue Breakdown (Million, %) by Region 2024 & 2032
- Figure 2: Global Polyetherimide Market Volume Breakdown (K Tons, %) by Region 2024 & 2032
- Figure 3: North America Polyetherimide Market Revenue (Million), by Country 2024 & 2032
- Figure 4: North America Polyetherimide Market Volume (K Tons), by Country 2024 & 2032
- Figure 5: North America Polyetherimide Market Revenue Share (%), by Country 2024 & 2032
- Figure 6: North America Polyetherimide Market Volume Share (%), by Country 2024 & 2032
- Figure 7: Europe Polyetherimide Market Revenue (Million), by Country 2024 & 2032
- Figure 8: Europe Polyetherimide Market Volume (K Tons), by Country 2024 & 2032
- Figure 9: Europe Polyetherimide Market Revenue Share (%), by Country 2024 & 2032
- Figure 10: Europe Polyetherimide Market Volume Share (%), by Country 2024 & 2032
- Figure 11: Asia Pacific Polyetherimide Market Revenue (Million), by Country 2024 & 2032
- Figure 12: Asia Pacific Polyetherimide Market Volume (K Tons), by Country 2024 & 2032
- Figure 13: Asia Pacific Polyetherimide Market Revenue Share (%), by Country 2024 & 2032
- Figure 14: Asia Pacific Polyetherimide Market Volume Share (%), by Country 2024 & 2032
- Figure 15: South America Polyetherimide Market Revenue (Million), by Country 2024 & 2032
- Figure 16: South America Polyetherimide Market Volume (K Tons), by Country 2024 & 2032
- Figure 17: South America Polyetherimide Market Revenue Share (%), by Country 2024 & 2032
- Figure 18: South America Polyetherimide Market Volume Share (%), by Country 2024 & 2032
- Figure 19: North America Polyetherimide Market Revenue (Million), by Country 2024 & 2032
- Figure 20: North America Polyetherimide Market Volume (K Tons), by Country 2024 & 2032
- Figure 21: North America Polyetherimide Market Revenue Share (%), by Country 2024 & 2032
- Figure 22: North America Polyetherimide Market Volume Share (%), by Country 2024 & 2032
- Figure 23: MEA Polyetherimide Market Revenue (Million), by Country 2024 & 2032
- Figure 24: MEA Polyetherimide Market Volume (K Tons), by Country 2024 & 2032
- Figure 25: MEA Polyetherimide Market Revenue Share (%), by Country 2024 & 2032
- Figure 26: MEA Polyetherimide Market Volume Share (%), by Country 2024 & 2032
- Figure 27: Asia Pacific Polyetherimide Market Revenue (Million), by Grade 2024 & 2032
- Figure 28: Asia Pacific Polyetherimide Market Volume (K Tons), by Grade 2024 & 2032
- Figure 29: Asia Pacific Polyetherimide Market Revenue Share (%), by Grade 2024 & 2032
- Figure 30: Asia Pacific Polyetherimide Market Volume Share (%), by Grade 2024 & 2032
- Figure 31: Asia Pacific Polyetherimide Market Revenue (Million), by End-User Industry 2024 & 2032
- Figure 32: Asia Pacific Polyetherimide Market Volume (K Tons), by End-User Industry 2024 & 2032
- Figure 33: Asia Pacific Polyetherimide Market Revenue Share (%), by End-User Industry 2024 & 2032
- Figure 34: Asia Pacific Polyetherimide Market Volume Share (%), by End-User Industry 2024 & 2032
- Figure 35: Asia Pacific Polyetherimide Market Revenue (Million), by Country 2024 & 2032
- Figure 36: Asia Pacific Polyetherimide Market Volume (K Tons), by Country 2024 & 2032
- Figure 37: Asia Pacific Polyetherimide Market Revenue Share (%), by Country 2024 & 2032
- Figure 38: Asia Pacific Polyetherimide Market Volume Share (%), by Country 2024 & 2032
- Figure 39: North America Polyetherimide Market Revenue (Million), by Grade 2024 & 2032
- Figure 40: North America Polyetherimide Market Volume (K Tons), by Grade 2024 & 2032
- Figure 41: North America Polyetherimide Market Revenue Share (%), by Grade 2024 & 2032
- Figure 42: North America Polyetherimide Market Volume Share (%), by Grade 2024 & 2032
- Figure 43: North America Polyetherimide Market Revenue (Million), by End-User Industry 2024 & 2032
- Figure 44: North America Polyetherimide Market Volume (K Tons), by End-User Industry 2024 & 2032
- Figure 45: North America Polyetherimide Market Revenue Share (%), by End-User Industry 2024 & 2032
- Figure 46: North America Polyetherimide Market Volume Share (%), by End-User Industry 2024 & 2032
- Figure 47: North America Polyetherimide Market Revenue (Million), by Country 2024 & 2032
- Figure 48: North America Polyetherimide Market Volume (K Tons), by Country 2024 & 2032
- Figure 49: North America Polyetherimide Market Revenue Share (%), by Country 2024 & 2032
- Figure 50: North America Polyetherimide Market Volume Share (%), by Country 2024 & 2032
- Figure 51: Europe Polyetherimide Market Revenue (Million), by Grade 2024 & 2032
- Figure 52: Europe Polyetherimide Market Volume (K Tons), by Grade 2024 & 2032
- Figure 53: Europe Polyetherimide Market Revenue Share (%), by Grade 2024 & 2032
- Figure 54: Europe Polyetherimide Market Volume Share (%), by Grade 2024 & 2032
- Figure 55: Europe Polyetherimide Market Revenue (Million), by End-User Industry 2024 & 2032
- Figure 56: Europe Polyetherimide Market Volume (K Tons), by End-User Industry 2024 & 2032
- Figure 57: Europe Polyetherimide Market Revenue Share (%), by End-User Industry 2024 & 2032
- Figure 58: Europe Polyetherimide Market Volume Share (%), by End-User Industry 2024 & 2032
- Figure 59: Europe Polyetherimide Market Revenue (Million), by Country 2024 & 2032
- Figure 60: Europe Polyetherimide Market Volume (K Tons), by Country 2024 & 2032
- Figure 61: Europe Polyetherimide Market Revenue Share (%), by Country 2024 & 2032
- Figure 62: Europe Polyetherimide Market Volume Share (%), by Country 2024 & 2032
- Figure 63: South America Polyetherimide Market Revenue (Million), by Grade 2024 & 2032
- Figure 64: South America Polyetherimide Market Volume (K Tons), by Grade 2024 & 2032
- Figure 65: South America Polyetherimide Market Revenue Share (%), by Grade 2024 & 2032
- Figure 66: South America Polyetherimide Market Volume Share (%), by Grade 2024 & 2032
- Figure 67: South America Polyetherimide Market Revenue (Million), by End-User Industry 2024 & 2032
- Figure 68: South America Polyetherimide Market Volume (K Tons), by End-User Industry 2024 & 2032
- Figure 69: South America Polyetherimide Market Revenue Share (%), by End-User Industry 2024 & 2032
- Figure 70: South America Polyetherimide Market Volume Share (%), by End-User Industry 2024 & 2032
- Figure 71: South America Polyetherimide Market Revenue (Million), by Country 2024 & 2032
- Figure 72: South America Polyetherimide Market Volume (K Tons), by Country 2024 & 2032
- Figure 73: South America Polyetherimide Market Revenue Share (%), by Country 2024 & 2032
- Figure 74: South America Polyetherimide Market Volume Share (%), by Country 2024 & 2032
- Figure 75: Middle East and Africa Polyetherimide Market Revenue (Million), by Grade 2024 & 2032
- Figure 76: Middle East and Africa Polyetherimide Market Volume (K Tons), by Grade 2024 & 2032
- Figure 77: Middle East and Africa Polyetherimide Market Revenue Share (%), by Grade 2024 & 2032
- Figure 78: Middle East and Africa Polyetherimide Market Volume Share (%), by Grade 2024 & 2032
- Figure 79: Middle East and Africa Polyetherimide Market Revenue (Million), by End-User Industry 2024 & 2032
- Figure 80: Middle East and Africa Polyetherimide Market Volume (K Tons), by End-User Industry 2024 & 2032
- Figure 81: Middle East and Africa Polyetherimide Market Revenue Share (%), by End-User Industry 2024 & 2032
- Figure 82: Middle East and Africa Polyetherimide Market Volume Share (%), by End-User Industry 2024 & 2032
- Figure 83: Middle East and Africa Polyetherimide Market Revenue (Million), by Country 2024 & 2032
- Figure 84: Middle East and Africa Polyetherimide Market Volume (K Tons), by Country 2024 & 2032
- Figure 85: Middle East and Africa Polyetherimide Market Revenue Share (%), by Country 2024 & 2032
- Figure 86: Middle East and Africa Polyetherimide Market Volume Share (%), by Country 2024 & 2032
List of Tables
- Table 1: Global Polyetherimide Market Revenue Million Forecast, by Region 2019 & 2032
- Table 2: Global Polyetherimide Market Volume K Tons Forecast, by Region 2019 & 2032
- Table 3: Global Polyetherimide Market Revenue Million Forecast, by Grade 2019 & 2032
- Table 4: Global Polyetherimide Market Volume K Tons Forecast, by Grade 2019 & 2032
- Table 5: Global Polyetherimide Market Revenue Million Forecast, by End-User Industry 2019 & 2032
- Table 6: Global Polyetherimide Market Volume K Tons Forecast, by End-User Industry 2019 & 2032
- Table 7: Global Polyetherimide Market Revenue Million Forecast, by Region 2019 & 2032
- Table 8: Global Polyetherimide Market Volume K Tons Forecast, by Region 2019 & 2032
- Table 9: Global Polyetherimide Market Revenue Million Forecast, by Country 2019 & 2032
- Table 10: Global Polyetherimide Market Volume K Tons Forecast, by Country 2019 & 2032
- Table 11: United States Polyetherimide Market Revenue (Million) Forecast, by Application 2019 & 2032
- Table 12: United States Polyetherimide Market Volume (K Tons) Forecast, by Application 2019 & 2032
- Table 13: Canada Polyetherimide Market Revenue (Million) Forecast, by Application 2019 & 2032
- Table 14: Canada Polyetherimide Market Volume (K Tons) Forecast, by Application 2019 & 2032
- Table 15: Mexico Polyetherimide Market Revenue (Million) Forecast, by Application 2019 & 2032
- Table 16: Mexico Polyetherimide Market Volume (K Tons) Forecast, by Application 2019 & 2032
- Table 17: Global Polyetherimide Market Revenue Million Forecast, by Country 2019 & 2032
- Table 18: Global Polyetherimide Market Volume K Tons Forecast, by Country 2019 & 2032
- Table 19: Germany Polyetherimide Market Revenue (Million) Forecast, by Application 2019 & 2032
- Table 20: Germany Polyetherimide Market Volume (K Tons) Forecast, by Application 2019 & 2032
- Table 21: United Kingdom Polyetherimide Market Revenue (Million) Forecast, by Application 2019 & 2032
- Table 22: United Kingdom Polyetherimide Market Volume (K Tons) Forecast, by Application 2019 & 2032
- Table 23: France Polyetherimide Market Revenue (Million) Forecast, by Application 2019 & 2032
- Table 24: France Polyetherimide Market Volume (K Tons) Forecast, by Application 2019 & 2032
- Table 25: Spain Polyetherimide Market Revenue (Million) Forecast, by Application 2019 & 2032
- Table 26: Spain Polyetherimide Market Volume (K Tons) Forecast, by Application 2019 & 2032
- Table 27: Italy Polyetherimide Market Revenue (Million) Forecast, by Application 2019 & 2032
- Table 28: Italy Polyetherimide Market Volume (K Tons) Forecast, by Application 2019 & 2032
- Table 29: Spain Polyetherimide Market Revenue (Million) Forecast, by Application 2019 & 2032
- Table 30: Spain Polyetherimide Market Volume (K Tons) Forecast, by Application 2019 & 2032
- Table 31: Belgium Polyetherimide Market Revenue (Million) Forecast, by Application 2019 & 2032
- Table 32: Belgium Polyetherimide Market Volume (K Tons) Forecast, by Application 2019 & 2032
- Table 33: Netherland Polyetherimide Market Revenue (Million) Forecast, by Application 2019 & 2032
- Table 34: Netherland Polyetherimide Market Volume (K Tons) Forecast, by Application 2019 & 2032
- Table 35: Nordics Polyetherimide Market Revenue (Million) Forecast, by Application 2019 & 2032
- Table 36: Nordics Polyetherimide Market Volume (K Tons) Forecast, by Application 2019 & 2032
- Table 37: Rest of Europe Polyetherimide Market Revenue (Million) Forecast, by Application 2019 & 2032
- Table 38: Rest of Europe Polyetherimide Market Volume (K Tons) Forecast, by Application 2019 & 2032
- Table 39: Global Polyetherimide Market Revenue Million Forecast, by Country 2019 & 2032
- Table 40: Global Polyetherimide Market Volume K Tons Forecast, by Country 2019 & 2032
- Table 41: China Polyetherimide Market Revenue (Million) Forecast, by Application 2019 & 2032
- Table 42: China Polyetherimide Market Volume (K Tons) Forecast, by Application 2019 & 2032
- Table 43: Japan Polyetherimide Market Revenue (Million) Forecast, by Application 2019 & 2032
- Table 44: Japan Polyetherimide Market Volume (K Tons) Forecast, by Application 2019 & 2032
- Table 45: India Polyetherimide Market Revenue (Million) Forecast, by Application 2019 & 2032
- Table 46: India Polyetherimide Market Volume (K Tons) Forecast, by Application 2019 & 2032
- Table 47: South Korea Polyetherimide Market Revenue (Million) Forecast, by Application 2019 & 2032
- Table 48: South Korea Polyetherimide Market Volume (K Tons) Forecast, by Application 2019 & 2032
- Table 49: Southeast Asia Polyetherimide Market Revenue (Million) Forecast, by Application 2019 & 2032
- Table 50: Southeast Asia Polyetherimide Market Volume (K Tons) Forecast, by Application 2019 & 2032
- Table 51: Australia Polyetherimide Market Revenue (Million) Forecast, by Application 2019 & 2032
- Table 52: Australia Polyetherimide Market Volume (K Tons) Forecast, by Application 2019 & 2032
- Table 53: Indonesia Polyetherimide Market Revenue (Million) Forecast, by Application 2019 & 2032
- Table 54: Indonesia Polyetherimide Market Volume (K Tons) Forecast, by Application 2019 & 2032
- Table 55: Phillipes Polyetherimide Market Revenue (Million) Forecast, by Application 2019 & 2032
- Table 56: Phillipes Polyetherimide Market Volume (K Tons) Forecast, by Application 2019 & 2032
- Table 57: Singapore Polyetherimide Market Revenue (Million) Forecast, by Application 2019 & 2032
- Table 58: Singapore Polyetherimide Market Volume (K Tons) Forecast, by Application 2019 & 2032
- Table 59: Thailandc Polyetherimide Market Revenue (Million) Forecast, by Application 2019 & 2032
- Table 60: Thailandc Polyetherimide Market Volume (K Tons) Forecast, by Application 2019 & 2032
- Table 61: Rest of Asia Pacific Polyetherimide Market Revenue (Million) Forecast, by Application 2019 & 2032
- Table 62: Rest of Asia Pacific Polyetherimide Market Volume (K Tons) Forecast, by Application 2019 & 2032
- Table 63: Global Polyetherimide Market Revenue Million Forecast, by Country 2019 & 2032
- Table 64: Global Polyetherimide Market Volume K Tons Forecast, by Country 2019 & 2032
- Table 65: Brazil Polyetherimide Market Revenue (Million) Forecast, by Application 2019 & 2032
- Table 66: Brazil Polyetherimide Market Volume (K Tons) Forecast, by Application 2019 & 2032
- Table 67: Argentina Polyetherimide Market Revenue (Million) Forecast, by Application 2019 & 2032
- Table 68: Argentina Polyetherimide Market Volume (K Tons) Forecast, by Application 2019 & 2032
- Table 69: Peru Polyetherimide Market Revenue (Million) Forecast, by Application 2019 & 2032
- Table 70: Peru Polyetherimide Market Volume (K Tons) Forecast, by Application 2019 & 2032
- Table 71: Chile Polyetherimide Market Revenue (Million) Forecast, by Application 2019 & 2032
- Table 72: Chile Polyetherimide Market Volume (K Tons) Forecast, by Application 2019 & 2032
- Table 73: Colombia Polyetherimide Market Revenue (Million) Forecast, by Application 2019 & 2032
- Table 74: Colombia Polyetherimide Market Volume (K Tons) Forecast, by Application 2019 & 2032
- Table 75: Ecuador Polyetherimide Market Revenue (Million) Forecast, by Application 2019 & 2032
- Table 76: Ecuador Polyetherimide Market Volume (K Tons) Forecast, by Application 2019 & 2032
- Table 77: Venezuela Polyetherimide Market Revenue (Million) Forecast, by Application 2019 & 2032
- Table 78: Venezuela Polyetherimide Market Volume (K Tons) Forecast, by Application 2019 & 2032
- Table 79: Rest of South America Polyetherimide Market Revenue (Million) Forecast, by Application 2019 & 2032
- Table 80: Rest of South America Polyetherimide Market Volume (K Tons) Forecast, by Application 2019 & 2032
- Table 81: Global Polyetherimide Market Revenue Million Forecast, by Country 2019 & 2032
- Table 82: Global Polyetherimide Market Volume K Tons Forecast, by Country 2019 & 2032
- Table 83: United States Polyetherimide Market Revenue (Million) Forecast, by Application 2019 & 2032
- Table 84: United States Polyetherimide Market Volume (K Tons) Forecast, by Application 2019 & 2032
- Table 85: Canada Polyetherimide Market Revenue (Million) Forecast, by Application 2019 & 2032
- Table 86: Canada Polyetherimide Market Volume (K Tons) Forecast, by Application 2019 & 2032
- Table 87: Mexico Polyetherimide Market Revenue (Million) Forecast, by Application 2019 & 2032
- Table 88: Mexico Polyetherimide Market Volume (K Tons) Forecast, by Application 2019 & 2032
- Table 89: Global Polyetherimide Market Revenue Million Forecast, by Country 2019 & 2032
- Table 90: Global Polyetherimide Market Volume K Tons Forecast, by Country 2019 & 2032
- Table 91: United Arab Emirates Polyetherimide Market Revenue (Million) Forecast, by Application 2019 & 2032
- Table 92: United Arab Emirates Polyetherimide Market Volume (K Tons) Forecast, by Application 2019 & 2032
- Table 93: Saudi Arabia Polyetherimide Market Revenue (Million) Forecast, by Application 2019 & 2032
- Table 94: Saudi Arabia Polyetherimide Market Volume (K Tons) Forecast, by Application 2019 & 2032
- Table 95: South Africa Polyetherimide Market Revenue (Million) Forecast, by Application 2019 & 2032
- Table 96: South Africa Polyetherimide Market Volume (K Tons) Forecast, by Application 2019 & 2032
- Table 97: Rest of Middle East and Africa Polyetherimide Market Revenue (Million) Forecast, by Application 2019 & 2032
- Table 98: Rest of Middle East and Africa Polyetherimide Market Volume (K Tons) Forecast, by Application 2019 & 2032
- Table 99: Global Polyetherimide Market Revenue Million Forecast, by Grade 2019 & 2032
- Table 100: Global Polyetherimide Market Volume K Tons Forecast, by Grade 2019 & 2032
- Table 101: Global Polyetherimide Market Revenue Million Forecast, by End-User Industry 2019 & 2032
- Table 102: Global Polyetherimide Market Volume K Tons Forecast, by End-User Industry 2019 & 2032
- Table 103: Global Polyetherimide Market Revenue Million Forecast, by Country 2019 & 2032
- Table 104: Global Polyetherimide Market Volume K Tons Forecast, by Country 2019 & 2032
- Table 105: China Polyetherimide Market Revenue (Million) Forecast, by Application 2019 & 2032
- Table 106: China Polyetherimide Market Volume (K Tons) Forecast, by Application 2019 & 2032
- Table 107: India Polyetherimide Market Revenue (Million) Forecast, by Application 2019 & 2032
- Table 108: India Polyetherimide Market Volume (K Tons) Forecast, by Application 2019 & 2032
- Table 109: Japan Polyetherimide Market Revenue (Million) Forecast, by Application 2019 & 2032
- Table 110: Japan Polyetherimide Market Volume (K Tons) Forecast, by Application 2019 & 2032
- Table 111: South Korea Polyetherimide Market Revenue (Million) Forecast, by Application 2019 & 2032
- Table 112: South Korea Polyetherimide Market Volume (K Tons) Forecast, by Application 2019 & 2032
- Table 113: Southeast ASia Polyetherimide Market Revenue (Million) Forecast, by Application 2019 & 2032
- Table 114: Southeast ASia Polyetherimide Market Volume (K Tons) Forecast, by Application 2019 & 2032
- Table 115: Australia Polyetherimide Market Revenue (Million) Forecast, by Application 2019 & 2032
- Table 116: Australia Polyetherimide Market Volume (K Tons) Forecast, by Application 2019 & 2032
- Table 117: Rest of Asia Pacific Polyetherimide Market Revenue (Million) Forecast, by Application 2019 & 2032
- Table 118: Rest of Asia Pacific Polyetherimide Market Volume (K Tons) Forecast, by Application 2019 & 2032
- Table 119: Global Polyetherimide Market Revenue Million Forecast, by Grade 2019 & 2032
- Table 120: Global Polyetherimide Market Volume K Tons Forecast, by Grade 2019 & 2032
- Table 121: Global Polyetherimide Market Revenue Million Forecast, by End-User Industry 2019 & 2032
- Table 122: Global Polyetherimide Market Volume K Tons Forecast, by End-User Industry 2019 & 2032
- Table 123: Global Polyetherimide Market Revenue Million Forecast, by Country 2019 & 2032
- Table 124: Global Polyetherimide Market Volume K Tons Forecast, by Country 2019 & 2032
- Table 125: United States Polyetherimide Market Revenue (Million) Forecast, by Application 2019 & 2032
- Table 126: United States Polyetherimide Market Volume (K Tons) Forecast, by Application 2019 & 2032
- Table 127: Canada Polyetherimide Market Revenue (Million) Forecast, by Application 2019 & 2032
- Table 128: Canada Polyetherimide Market Volume (K Tons) Forecast, by Application 2019 & 2032
- Table 129: Mexico Polyetherimide Market Revenue (Million) Forecast, by Application 2019 & 2032
- Table 130: Mexico Polyetherimide Market Volume (K Tons) Forecast, by Application 2019 & 2032
- Table 131: Global Polyetherimide Market Revenue Million Forecast, by Grade 2019 & 2032
- Table 132: Global Polyetherimide Market Volume K Tons Forecast, by Grade 2019 & 2032
- Table 133: Global Polyetherimide Market Revenue Million Forecast, by End-User Industry 2019 & 2032
- Table 134: Global Polyetherimide Market Volume K Tons Forecast, by End-User Industry 2019 & 2032
- Table 135: Global Polyetherimide Market Revenue Million Forecast, by Country 2019 & 2032
- Table 136: Global Polyetherimide Market Volume K Tons Forecast, by Country 2019 & 2032
- Table 137: Germany Polyetherimide Market Revenue (Million) Forecast, by Application 2019 & 2032
- Table 138: Germany Polyetherimide Market Volume (K Tons) Forecast, by Application 2019 & 2032
- Table 139: United Kingdom Polyetherimide Market Revenue (Million) Forecast, by Application 2019 & 2032
- Table 140: United Kingdom Polyetherimide Market Volume (K Tons) Forecast, by Application 2019 & 2032
- Table 141: Italy Polyetherimide Market Revenue (Million) Forecast, by Application 2019 & 2032
- Table 142: Italy Polyetherimide Market Volume (K Tons) Forecast, by Application 2019 & 2032
- Table 143: France Polyetherimide Market Revenue (Million) Forecast, by Application 2019 & 2032
- Table 144: France Polyetherimide Market Volume (K Tons) Forecast, by Application 2019 & 2032
- Table 145: Spain Polyetherimide Market Revenue (Million) Forecast, by Application 2019 & 2032
- Table 146: Spain Polyetherimide Market Volume (K Tons) Forecast, by Application 2019 & 2032
- Table 147: Rest of Europe Polyetherimide Market Revenue (Million) Forecast, by Application 2019 & 2032
- Table 148: Rest of Europe Polyetherimide Market Volume (K Tons) Forecast, by Application 2019 & 2032
- Table 149: Global Polyetherimide Market Revenue Million Forecast, by Grade 2019 & 2032
- Table 150: Global Polyetherimide Market Volume K Tons Forecast, by Grade 2019 & 2032
- Table 151: Global Polyetherimide Market Revenue Million Forecast, by End-User Industry 2019 & 2032
- Table 152: Global Polyetherimide Market Volume K Tons Forecast, by End-User Industry 2019 & 2032
- Table 153: Global Polyetherimide Market Revenue Million Forecast, by Country 2019 & 2032
- Table 154: Global Polyetherimide Market Volume K Tons Forecast, by Country 2019 & 2032
- Table 155: Brazil Polyetherimide Market Revenue (Million) Forecast, by Application 2019 & 2032
- Table 156: Brazil Polyetherimide Market Volume (K Tons) Forecast, by Application 2019 & 2032
- Table 157: Argentina Polyetherimide Market Revenue (Million) Forecast, by Application 2019 & 2032
- Table 158: Argentina Polyetherimide Market Volume (K Tons) Forecast, by Application 2019 & 2032
- Table 159: Colombia Polyetherimide Market Revenue (Million) Forecast, by Application 2019 & 2032
- Table 160: Colombia Polyetherimide Market Volume (K Tons) Forecast, by Application 2019 & 2032
- Table 161: Rest of South America Polyetherimide Market Revenue (Million) Forecast, by Application 2019 & 2032
- Table 162: Rest of South America Polyetherimide Market Volume (K Tons) Forecast, by Application 2019 & 2032
- Table 163: Global Polyetherimide Market Revenue Million Forecast, by Grade 2019 & 2032
- Table 164: Global Polyetherimide Market Volume K Tons Forecast, by Grade 2019 & 2032
- Table 165: Global Polyetherimide Market Revenue Million Forecast, by End-User Industry 2019 & 2032
- Table 166: Global Polyetherimide Market Volume K Tons Forecast, by End-User Industry 2019 & 2032
- Table 167: Global Polyetherimide Market Revenue Million Forecast, by Country 2019 & 2032
- Table 168: Global Polyetherimide Market Volume K Tons Forecast, by Country 2019 & 2032
- Table 169: Saudi Arabia Polyetherimide Market Revenue (Million) Forecast, by Application 2019 & 2032
- Table 170: Saudi Arabia Polyetherimide Market Volume (K Tons) Forecast, by Application 2019 & 2032
- Table 171: South Africa Polyetherimide Market Revenue (Million) Forecast, by Application 2019 & 2032
- Table 172: South Africa Polyetherimide Market Volume (K Tons) Forecast, by Application 2019 & 2032
- Table 173: UAE Polyetherimide Market Revenue (Million) Forecast, by Application 2019 & 2032
- Table 174: UAE Polyetherimide Market Volume (K Tons) Forecast, by Application 2019 & 2032
- Table 175: Rest of Middle East and Africa Polyetherimide Market Revenue (Million) Forecast, by Application 2019 & 2032
- Table 176: Rest of Middle East and Africa Polyetherimide Market Volume (K Tons) Forecast, by Application 2019 & 2032
Frequently Asked Questions
1. What is the projected Compound Annual Growth Rate (CAGR) of the Polyetherimide Market?
The projected CAGR is approximately > 6.50%.
2. Which companies are prominent players in the Polyetherimide Market?
Key companies in the market include Solvay, GEHR, Röchling SE & Co KG, Avient Corporation, Emco Industrial Plastics, SABIC, the Mitsubishi Chemical Group of companies, RTP Company, Kuraray Europe GmbH, Aikolon Oy, Ensinger, Eagle Performance Plastics Inc.
3. What are the main segments of the Polyetherimide Market?
The market segments include Grade, End-User Industry.
4. Can you provide details about the market size?
The market size is estimated to be USD 663.10 Million as of 2022.
5. What are some drivers contributing to market growth?
Increasing Demand from the Transportation Industry; Rapid Growth in the Automotive Sector; Increasing Usage in Healthcare Sector.
6. What are the notable trends driving market growth?
Increasing demand from Electrical & Electronics Industry.
7. Are there any restraints impacting market growth?
High Price When Compared to the Conventional Polymers; Availability of Substitute Materials.
8. Can you provide examples of recent developments in the market?
N/A
9. What pricing options are available for accessing the report?
Pricing options include single-user, multi-user, and enterprise licenses priced at USD 4750, USD 5250, and USD 8750 respectively.
10. Is the market size provided in terms of value or volume?
The market size is provided in terms of value, measured in Million and volume, measured in K Tons.
11. Are there any specific market keywords associated with the report?
Yes, the market keyword associated with the report is "Polyetherimide Market," which aids in identifying and referencing the specific market segment covered.
12. How do I determine which pricing option suits my needs best?
The pricing options vary based on user requirements and access needs. Individual users may opt for single-user licenses, while businesses requiring broader access may choose multi-user or enterprise licenses for cost-effective access to the report.
13. Are there any additional resources or data provided in the Polyetherimide Market report?
While the report offers comprehensive insights, it's advisable to review the specific contents or supplementary materials provided to ascertain if additional resources or data are available.
14. How can I stay updated on further developments or reports in the Polyetherimide Market?
To stay informed about further developments, trends, and reports in the Polyetherimide Market, consider subscribing to industry newsletters, following relevant companies and organizations, or regularly checking reputable industry news sources and publications.
Methodology
Step 1 - Identification of Relevant Samples Size from Population Database


Step 2 - Approaches for Defining Global Market Size (Value, Volume* & Price*)

Note*: In applicable scenarios
Step 3 - Data Sources
Primary Research
- Web Analytics
- Survey Reports
- Research Institute
- Latest Research Reports
- Opinion Leaders
Secondary Research
- Annual Reports
- White Paper
- Latest Press Release
- Industry Association
- Paid Database
- Investor Presentations

Step 4 - Data Triangulation
Involves using different sources of information in order to increase the validity of a study
These sources are likely to be stakeholders in a program - participants, other researchers, program staff, other community members, and so on.
Then we put all data in single framework & apply various statistical tools to find out the dynamic on the market.
During the analysis stage, feedback from the stakeholder groups would be compared to determine areas of agreement as well as areas of divergence


