
Key Insights
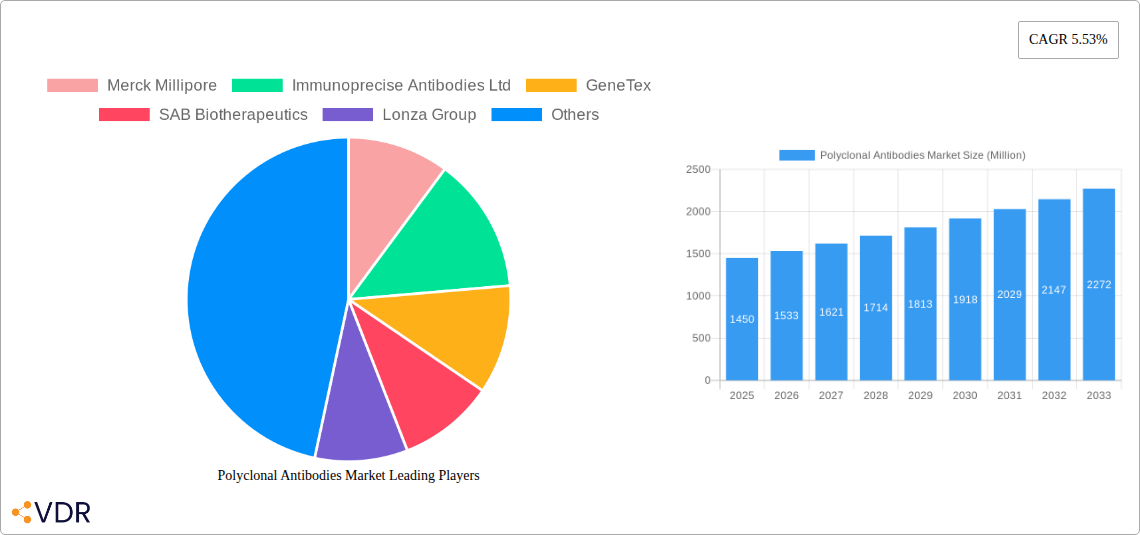
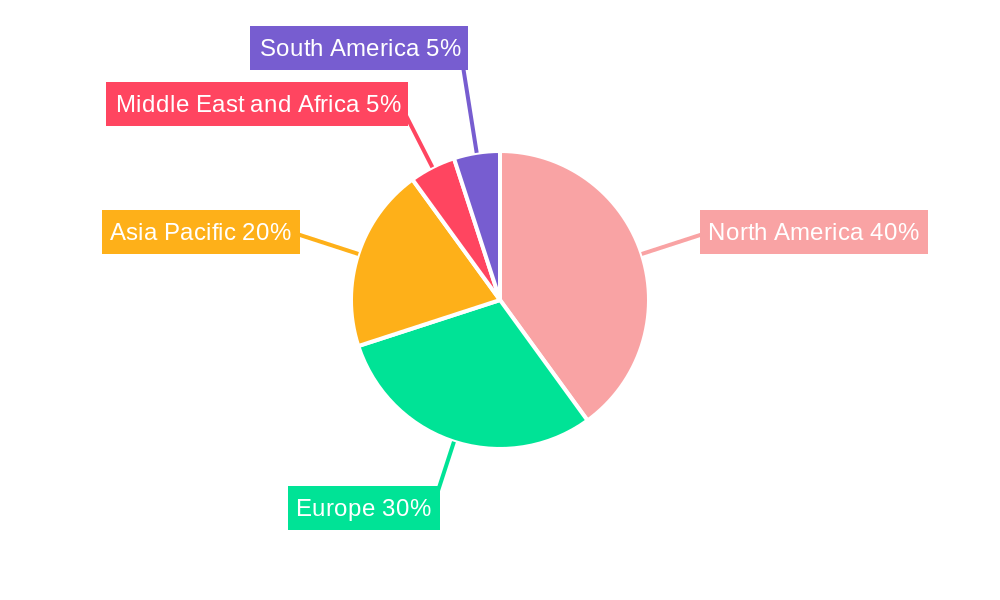
The global polyclonal antibodies market, valued at $1.45 billion in 2025, is projected to experience robust growth, driven by a compound annual growth rate (CAGR) of 5.53% from 2025 to 2033. This expansion is fueled by several key factors. The increasing prevalence of chronic diseases, such as cancer and autoimmune disorders, is significantly boosting demand for diagnostic and therapeutic applications of polyclonal antibodies. Furthermore, advancements in research methodologies and the rising adoption of personalized medicine are creating new avenues for market growth. The pharmaceutical and biotechnology industries are major consumers, driving the demand for high-quality polyclonal antibodies for drug development and clinical trials. Technological advancements leading to improved antibody production techniques, increased specificity, and higher yields are contributing to market expansion. The robust growth is anticipated across all major regions, with North America and Europe holding significant market shares due to established healthcare infrastructure and robust research activities. However, the Asia-Pacific region is projected to witness significant growth owing to rising healthcare spending and increasing awareness of advanced medical technologies.
The market segmentation reveals a diverse landscape. Rabbit, mouse, and goat polyclonal antibodies dominate the source segment, reflecting their established efficacy and cost-effectiveness. Diagnostic applications currently hold a larger market share than clinical research, but the latter is poised for substantial growth due to increasing R&D investments in novel therapeutics. Hospitals and academic research centers are key end-users, but the biopharmaceutical and biotechnology industries are expected to drive future growth with increased investment in antibody-based drug development. Competitive rivalry among established players like Merck Millipore, Lonza Group, and Roche, alongside emerging companies focusing on innovative antibody technologies, ensures market dynamism and the continuous development of advanced polyclonal antibodies. While regulatory hurdles and potential safety concerns related to certain antibody sources might pose some restraint, the overall market outlook remains optimistic, suggesting continued expansion throughout the forecast period.
Polyclonal Antibodies Market: A Comprehensive Report (2019-2033)
This in-depth report provides a comprehensive analysis of the Polyclonal Antibodies market, encompassing market dynamics, growth trends, regional segmentation, product landscape, key players, and future outlook. The study period covers 2019-2033, with 2025 as the base and estimated year. This report is designed for industry professionals, investors, and researchers seeking actionable insights into this rapidly evolving market. The total market value is projected to reach xx Million by 2033.
Polyclonal Antibodies Market Market Dynamics & Structure
The global polyclonal antibodies market is characterized by a moderately concentrated structure, with key players holding significant market share. The market's growth is fueled by technological innovations in antibody production and purification techniques, driving the development of highly specific and sensitive polyclonal antibodies. Stringent regulatory frameworks governing the development and approval of therapeutic and diagnostic antibodies influence market dynamics. Competitive product substitutes, such as monoclonal antibodies, pose challenges, while the increasing prevalence of chronic diseases and growing demand for advanced diagnostics are significant drivers. Mergers and acquisitions (M&A) activity within the sector is moderate, with larger companies strategically acquiring smaller firms to expand their product portfolio and technological capabilities.
- Market Concentration: Moderately concentrated, with top 5 players holding approximately xx% market share in 2025.
- Technological Innovation: Advancements in antibody engineering and production methods are key drivers.
- Regulatory Landscape: Stringent regulatory requirements impacting R&D and product approvals.
- Competitive Substitutes: Monoclonal antibodies present a competitive threat.
- M&A Activity: Moderate level of consolidation through acquisitions and partnerships.
- End-User Demographics: Growing demand from hospitals, research centers, and pharmaceutical companies.
Polyclonal Antibodies Market Growth Trends & Insights
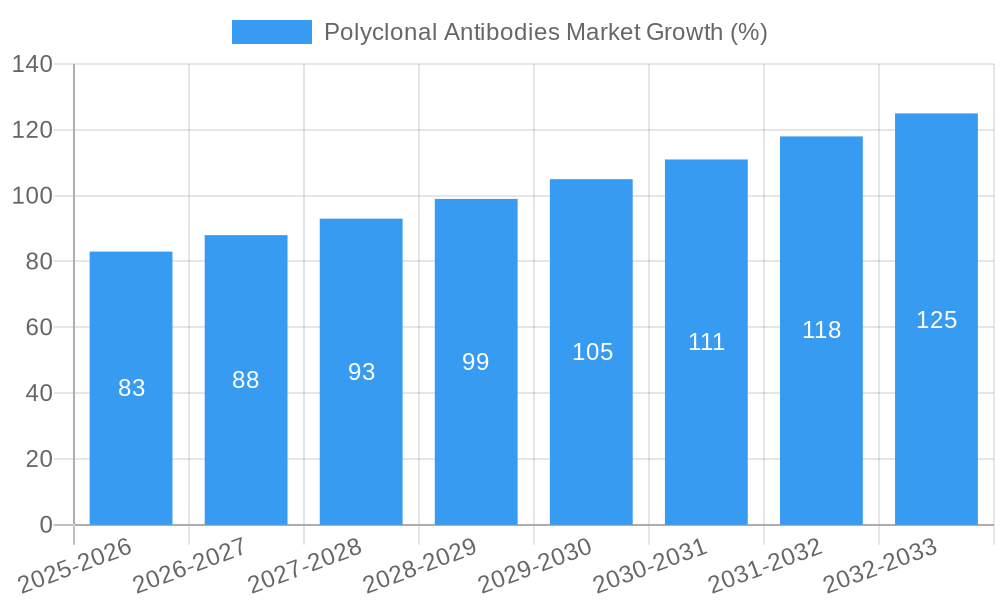
The polyclonal antibodies market experienced significant growth during the historical period (2019-2024), driven by factors such as rising prevalence of infectious diseases, increasing demand for diagnostic tools, and expanding research and development activities in the biotechnology and pharmaceutical industries. The market is projected to maintain a healthy Compound Annual Growth Rate (CAGR) of xx% during the forecast period (2025-2033). Technological advancements, such as next-generation sequencing and high-throughput screening, are accelerating the development of novel polyclonal antibodies with improved specificity and efficacy. Changing consumer behavior, favoring personalized medicine and point-of-care diagnostics, further contributes to market expansion. Market penetration of polyclonal antibodies in various therapeutic and diagnostic applications continues to increase, driven by their cost-effectiveness and ease of production compared to monoclonal antibodies.
Dominant Regions, Countries, or Segments in Polyclonal Antibodies Market
North America currently holds the largest market share in the polyclonal antibodies market, driven by robust research and development infrastructure, high healthcare expenditure, and a large number of biotechnology and pharmaceutical companies. Europe follows closely, while the Asia-Pacific region is expected to demonstrate significant growth in the coming years, driven by increasing healthcare investments and rising prevalence of chronic diseases.
Dominant Segments:
Product Type: Primary antibodies are currently the largest segment, followed by secondary antibodies.
Source: Rabbit polyclonal antibodies dominate due to their cost-effectiveness and ease of production.
Application: Diagnostic applications contribute significantly to the market share.
End User: Hospitals and research centers constitute a major end-user segment.
Key Drivers:
- Strong R&D infrastructure in North America and Europe.
- Growing healthcare expenditure globally.
- Increasing prevalence of chronic diseases.
- Favorable government policies and regulations.
Polyclonal Antibodies Market Product Landscape
Polyclonal antibodies are characterized by their broad specificity, relatively low cost of production, and suitability for a range of applications. Recent innovations focus on improving their specificity and affinity through advanced purification techniques and targeted selection strategies. These antibodies find extensive use in various diagnostic assays, research applications, and therapeutic development. Technological advancements include the development of novel conjugation chemistries and improved labeling techniques, enhancing the sensitivity and versatility of polyclonal antibodies. Unique selling propositions include their ability to bind to multiple epitopes on a target antigen and their ease of production, making them cost-effective for large-scale applications.
Key Drivers, Barriers & Challenges in Polyclonal Antibodies Market
Key Drivers:
- Increasing demand for diagnostic tools for infectious diseases and chronic conditions.
- Rising investments in R&D activities in the biotechnology and pharmaceutical industries.
- Growing adoption of polyclonal antibodies in personalized medicine.
Challenges & Restraints:
- Batch-to-batch variability in polyclonal antibodies.
- Competition from monoclonal antibodies, which often exhibit higher specificity.
- Stringent regulatory requirements and approval processes.
- Potential supply chain disruptions impacting the availability of raw materials.
Emerging Opportunities in Polyclonal Antibodies Market
- Growing demand for point-of-care diagnostics.
- Expansion into emerging markets with unmet healthcare needs.
- Development of novel applications in areas such as cancer immunotherapy.
- Increased use of polyclonal antibodies in combination therapies.
Growth Accelerators in the Polyclonal Antibodies Market Industry
Technological breakthroughs in antibody engineering and production methods are significantly accelerating market growth. Strategic partnerships between antibody manufacturers and diagnostic companies are creating synergies and driving innovation. Market expansion into emerging economies, where healthcare infrastructure is rapidly developing, creates substantial growth opportunities. The development of novel applications for polyclonal antibodies, particularly in personalized medicine and advanced therapeutics, further fuels long-term expansion.
Key Players Shaping the Polyclonal Antibodies Market Market
- Merck Millipore
- Immunoprecise Antibodies Ltd
- GeneTex
- SAB Biotherapeutics
- Lonza Group
- Gallus Immunotech
- F Hoffmann-La Roche AG
- Creative Diagnostics
- PerkinElmer Inc
- IGY Life Sciences
- Agilent Technologies
- Emergent BioSolutions Inc
- Bio-Rad Laboratories
Notable Milestones in Polyclonal Antibodies Market Sector
- October 2023: Creative Diagnostics announces new Anti-Small Molecule Label Antibodies for nucleic acid lateral flow immunoassays.
- February 2023: Roche launches IDH1 R132H (MRQ-67) Rabbit Monoclonal Primary Antibody and ATRX Rabbit Polyclonal Antibody for brain cancer diagnostics.
In-Depth Polyclonal Antibodies Market Market Outlook
The future of the polyclonal antibodies market is promising, driven by continuous technological advancements and the expansion of their applications in diagnostics and therapeutics. Strategic partnerships and collaborations among industry players will drive innovation and accelerate market growth. The focus on developing higher-affinity, more specific polyclonal antibodies, along with improved manufacturing processes, will enhance market competitiveness and create new opportunities. The market is poised for sustained growth, driven by unmet needs in personalized medicine and emerging diagnostic technologies.
Polyclonal Antibodies Market Segmentation
-
1. Product Type
- 1.1. Primary Antibody
- 1.2. Secondary Antibody
-
2. Source
- 2.1. Rabbit
- 2.2. Mouse
- 2.3. Goat
- 2.4. Horse
- 2.5. Other Animals
-
3. Application
- 3.1. Diagnostic
- 3.2. Clinical Research
-
4. End User
- 4.1. Hospitals
- 4.2. Academic and Research Centers
- 4.3. Bio-Pharmacuetical Industries
- 4.4. Biotechnology Companies
- 4.5. Diagnostics Centers
Polyclonal Antibodies Market Segmentation By Geography
-
1. North America
- 1.1. United States
- 1.2. Canada
- 1.3. Mexico
-
2. Europe
- 2.1. Germany
- 2.2. United Kingdom
- 2.3. France
- 2.4. Italy
- 2.5. Spain
- 2.6. Rest of Europe
-
3. Asia Pacific
- 3.1. China
- 3.2. Japan
- 3.3. India
- 3.4. Australia
- 3.5. South Korea
-
4. Middle East and Africa
- 4.1. GCC
- 4.2. South Africa
- 4.3. Rest of Middle East and Africa
-
5. South America
- 5.1. Brazil
- 5.2. Argentina
- 5.3. Rest of South America
Polyclonal Antibodies Market REPORT HIGHLIGHTS
| Aspects | Details |
|---|---|
| Study Period | 2019-2033 |
| Base Year | 2024 |
| Estimated Year | 2025 |
| Forecast Period | 2025-2033 |
| Historical Period | 2019-2024 |
| Growth Rate | CAGR of 5.53% from 2019-2033 |
| Segmentation |
|
Table of Contents
- 1. Introduction
- 1.1. Research Scope
- 1.2. Market Segmentation
- 1.3. Research Methodology
- 1.4. Definitions and Assumptions
- 2. Executive Summary
- 2.1. Introduction
- 3. Market Dynamics
- 3.1. Introduction
- 3.2. Market Drivers
- 3.2.1. Increasing Global Prevalence of Infectious and Chronic Diseases like Cancer.; Use of Polyclonal Antibodies in various Diagnostic Testing and Biopharmaceutical Industries.
- 3.3. Market Restrains
- 3.3.1. Limited Availability of High Quality Polyclonal Antibodies
- 3.4. Market Trends
- 3.4.1. Secondary Antibody Segment is Expected to Dominate the Polyclonal Antibodies Market Over the Forecast Period
- 4. Market Factor Analysis
- 4.1. Porters Five Forces
- 4.2. Supply/Value Chain
- 4.3. PESTEL analysis
- 4.4. Market Entropy
- 4.5. Patent/Trademark Analysis
- 5. Global Polyclonal Antibodies Market Analysis, Insights and Forecast, 2019-2031
- 5.1. Market Analysis, Insights and Forecast - by Product Type
- 5.1.1. Primary Antibody
- 5.1.2. Secondary Antibody
- 5.2. Market Analysis, Insights and Forecast - by Source
- 5.2.1. Rabbit
- 5.2.2. Mouse
- 5.2.3. Goat
- 5.2.4. Horse
- 5.2.5. Other Animals
- 5.3. Market Analysis, Insights and Forecast - by Application
- 5.3.1. Diagnostic
- 5.3.2. Clinical Research
- 5.4. Market Analysis, Insights and Forecast - by End User
- 5.4.1. Hospitals
- 5.4.2. Academic and Research Centers
- 5.4.3. Bio-Pharmacuetical Industries
- 5.4.4. Biotechnology Companies
- 5.4.5. Diagnostics Centers
- 5.5. Market Analysis, Insights and Forecast - by Region
- 5.5.1. North America
- 5.5.2. Europe
- 5.5.3. Asia Pacific
- 5.5.4. Middle East and Africa
- 5.5.5. South America
- 5.1. Market Analysis, Insights and Forecast - by Product Type
- 6. North America Polyclonal Antibodies Market Analysis, Insights and Forecast, 2019-2031
- 6.1. Market Analysis, Insights and Forecast - by Product Type
- 6.1.1. Primary Antibody
- 6.1.2. Secondary Antibody
- 6.2. Market Analysis, Insights and Forecast - by Source
- 6.2.1. Rabbit
- 6.2.2. Mouse
- 6.2.3. Goat
- 6.2.4. Horse
- 6.2.5. Other Animals
- 6.3. Market Analysis, Insights and Forecast - by Application
- 6.3.1. Diagnostic
- 6.3.2. Clinical Research
- 6.4. Market Analysis, Insights and Forecast - by End User
- 6.4.1. Hospitals
- 6.4.2. Academic and Research Centers
- 6.4.3. Bio-Pharmacuetical Industries
- 6.4.4. Biotechnology Companies
- 6.4.5. Diagnostics Centers
- 6.1. Market Analysis, Insights and Forecast - by Product Type
- 7. Europe Polyclonal Antibodies Market Analysis, Insights and Forecast, 2019-2031
- 7.1. Market Analysis, Insights and Forecast - by Product Type
- 7.1.1. Primary Antibody
- 7.1.2. Secondary Antibody
- 7.2. Market Analysis, Insights and Forecast - by Source
- 7.2.1. Rabbit
- 7.2.2. Mouse
- 7.2.3. Goat
- 7.2.4. Horse
- 7.2.5. Other Animals
- 7.3. Market Analysis, Insights and Forecast - by Application
- 7.3.1. Diagnostic
- 7.3.2. Clinical Research
- 7.4. Market Analysis, Insights and Forecast - by End User
- 7.4.1. Hospitals
- 7.4.2. Academic and Research Centers
- 7.4.3. Bio-Pharmacuetical Industries
- 7.4.4. Biotechnology Companies
- 7.4.5. Diagnostics Centers
- 7.1. Market Analysis, Insights and Forecast - by Product Type
- 8. Asia Pacific Polyclonal Antibodies Market Analysis, Insights and Forecast, 2019-2031
- 8.1. Market Analysis, Insights and Forecast - by Product Type
- 8.1.1. Primary Antibody
- 8.1.2. Secondary Antibody
- 8.2. Market Analysis, Insights and Forecast - by Source
- 8.2.1. Rabbit
- 8.2.2. Mouse
- 8.2.3. Goat
- 8.2.4. Horse
- 8.2.5. Other Animals
- 8.3. Market Analysis, Insights and Forecast - by Application
- 8.3.1. Diagnostic
- 8.3.2. Clinical Research
- 8.4. Market Analysis, Insights and Forecast - by End User
- 8.4.1. Hospitals
- 8.4.2. Academic and Research Centers
- 8.4.3. Bio-Pharmacuetical Industries
- 8.4.4. Biotechnology Companies
- 8.4.5. Diagnostics Centers
- 8.1. Market Analysis, Insights and Forecast - by Product Type
- 9. Middle East and Africa Polyclonal Antibodies Market Analysis, Insights and Forecast, 2019-2031
- 9.1. Market Analysis, Insights and Forecast - by Product Type
- 9.1.1. Primary Antibody
- 9.1.2. Secondary Antibody
- 9.2. Market Analysis, Insights and Forecast - by Source
- 9.2.1. Rabbit
- 9.2.2. Mouse
- 9.2.3. Goat
- 9.2.4. Horse
- 9.2.5. Other Animals
- 9.3. Market Analysis, Insights and Forecast - by Application
- 9.3.1. Diagnostic
- 9.3.2. Clinical Research
- 9.4. Market Analysis, Insights and Forecast - by End User
- 9.4.1. Hospitals
- 9.4.2. Academic and Research Centers
- 9.4.3. Bio-Pharmacuetical Industries
- 9.4.4. Biotechnology Companies
- 9.4.5. Diagnostics Centers
- 9.1. Market Analysis, Insights and Forecast - by Product Type
- 10. South America Polyclonal Antibodies Market Analysis, Insights and Forecast, 2019-2031
- 10.1. Market Analysis, Insights and Forecast - by Product Type
- 10.1.1. Primary Antibody
- 10.1.2. Secondary Antibody
- 10.2. Market Analysis, Insights and Forecast - by Source
- 10.2.1. Rabbit
- 10.2.2. Mouse
- 10.2.3. Goat
- 10.2.4. Horse
- 10.2.5. Other Animals
- 10.3. Market Analysis, Insights and Forecast - by Application
- 10.3.1. Diagnostic
- 10.3.2. Clinical Research
- 10.4. Market Analysis, Insights and Forecast - by End User
- 10.4.1. Hospitals
- 10.4.2. Academic and Research Centers
- 10.4.3. Bio-Pharmacuetical Industries
- 10.4.4. Biotechnology Companies
- 10.4.5. Diagnostics Centers
- 10.1. Market Analysis, Insights and Forecast - by Product Type
- 11. North America Polyclonal Antibodies Market Analysis, Insights and Forecast, 2019-2031
- 11.1. Market Analysis, Insights and Forecast - By Country/Sub-region
- 11.1.1 United States
- 11.1.2 Canada
- 11.1.3 Mexico
- 12. Europe Polyclonal Antibodies Market Analysis, Insights and Forecast, 2019-2031
- 12.1. Market Analysis, Insights and Forecast - By Country/Sub-region
- 12.1.1 Germany
- 12.1.2 United Kingdom
- 12.1.3 France
- 12.1.4 Italy
- 12.1.5 Spain
- 12.1.6 Rest of Europe
- 13. Asia Pacific Polyclonal Antibodies Market Analysis, Insights and Forecast, 2019-2031
- 13.1. Market Analysis, Insights and Forecast - By Country/Sub-region
- 13.1.1 China
- 13.1.2 Japan
- 13.1.3 India
- 13.1.4 Australia
- 13.1.5 South Korea
- 14. Middle East and Africa Polyclonal Antibodies Market Analysis, Insights and Forecast, 2019-2031
- 14.1. Market Analysis, Insights and Forecast - By Country/Sub-region
- 14.1.1 GCC
- 14.1.2 South Africa
- 14.1.3 Rest of Middle East and Africa
- 15. South America Polyclonal Antibodies Market Analysis, Insights and Forecast, 2019-2031
- 15.1. Market Analysis, Insights and Forecast - By Country/Sub-region
- 15.1.1 Brazil
- 15.1.2 Argentina
- 15.1.3 Rest of South America
- 16. Competitive Analysis
- 16.1. Global Market Share Analysis 2024
- 16.2. Company Profiles
- 16.2.1 Merck Millipore
- 16.2.1.1. Overview
- 16.2.1.2. Products
- 16.2.1.3. SWOT Analysis
- 16.2.1.4. Recent Developments
- 16.2.1.5. Financials (Based on Availability)
- 16.2.2 Immunoprecise Antibodies Ltd
- 16.2.2.1. Overview
- 16.2.2.2. Products
- 16.2.2.3. SWOT Analysis
- 16.2.2.4. Recent Developments
- 16.2.2.5. Financials (Based on Availability)
- 16.2.3 GeneTex
- 16.2.3.1. Overview
- 16.2.3.2. Products
- 16.2.3.3. SWOT Analysis
- 16.2.3.4. Recent Developments
- 16.2.3.5. Financials (Based on Availability)
- 16.2.4 SAB Biotherapeutics
- 16.2.4.1. Overview
- 16.2.4.2. Products
- 16.2.4.3. SWOT Analysis
- 16.2.4.4. Recent Developments
- 16.2.4.5. Financials (Based on Availability)
- 16.2.5 Lonza Group
- 16.2.5.1. Overview
- 16.2.5.2. Products
- 16.2.5.3. SWOT Analysis
- 16.2.5.4. Recent Developments
- 16.2.5.5. Financials (Based on Availability)
- 16.2.6 Gallus Immunotech
- 16.2.6.1. Overview
- 16.2.6.2. Products
- 16.2.6.3. SWOT Analysis
- 16.2.6.4. Recent Developments
- 16.2.6.5. Financials (Based on Availability)
- 16.2.7 F Hoffmann-La Roche AG
- 16.2.7.1. Overview
- 16.2.7.2. Products
- 16.2.7.3. SWOT Analysis
- 16.2.7.4. Recent Developments
- 16.2.7.5. Financials (Based on Availability)
- 16.2.8 Creative Diagnostics
- 16.2.8.1. Overview
- 16.2.8.2. Products
- 16.2.8.3. SWOT Analysis
- 16.2.8.4. Recent Developments
- 16.2.8.5. Financials (Based on Availability)
- 16.2.9 PerkinElmer Inc
- 16.2.9.1. Overview
- 16.2.9.2. Products
- 16.2.9.3. SWOT Analysis
- 16.2.9.4. Recent Developments
- 16.2.9.5. Financials (Based on Availability)
- 16.2.10 IGY Life Sciences
- 16.2.10.1. Overview
- 16.2.10.2. Products
- 16.2.10.3. SWOT Analysis
- 16.2.10.4. Recent Developments
- 16.2.10.5. Financials (Based on Availability)
- 16.2.11 Agilent Technologies
- 16.2.11.1. Overview
- 16.2.11.2. Products
- 16.2.11.3. SWOT Analysis
- 16.2.11.4. Recent Developments
- 16.2.11.5. Financials (Based on Availability)
- 16.2.12 Emergent BioSolutions Inc
- 16.2.12.1. Overview
- 16.2.12.2. Products
- 16.2.12.3. SWOT Analysis
- 16.2.12.4. Recent Developments
- 16.2.12.5. Financials (Based on Availability)
- 16.2.13 Bio- Rad Laboratories
- 16.2.13.1. Overview
- 16.2.13.2. Products
- 16.2.13.3. SWOT Analysis
- 16.2.13.4. Recent Developments
- 16.2.13.5. Financials (Based on Availability)
- 16.2.1 Merck Millipore
List of Figures
- Figure 1: Global Polyclonal Antibodies Market Revenue Breakdown (Million, %) by Region 2024 & 2032
- Figure 2: North America Polyclonal Antibodies Market Revenue (Million), by Country 2024 & 2032
- Figure 3: North America Polyclonal Antibodies Market Revenue Share (%), by Country 2024 & 2032
- Figure 4: Europe Polyclonal Antibodies Market Revenue (Million), by Country 2024 & 2032
- Figure 5: Europe Polyclonal Antibodies Market Revenue Share (%), by Country 2024 & 2032
- Figure 6: Asia Pacific Polyclonal Antibodies Market Revenue (Million), by Country 2024 & 2032
- Figure 7: Asia Pacific Polyclonal Antibodies Market Revenue Share (%), by Country 2024 & 2032
- Figure 8: Middle East and Africa Polyclonal Antibodies Market Revenue (Million), by Country 2024 & 2032
- Figure 9: Middle East and Africa Polyclonal Antibodies Market Revenue Share (%), by Country 2024 & 2032
- Figure 10: South America Polyclonal Antibodies Market Revenue (Million), by Country 2024 & 2032
- Figure 11: South America Polyclonal Antibodies Market Revenue Share (%), by Country 2024 & 2032
- Figure 12: North America Polyclonal Antibodies Market Revenue (Million), by Product Type 2024 & 2032
- Figure 13: North America Polyclonal Antibodies Market Revenue Share (%), by Product Type 2024 & 2032
- Figure 14: North America Polyclonal Antibodies Market Revenue (Million), by Source 2024 & 2032
- Figure 15: North America Polyclonal Antibodies Market Revenue Share (%), by Source 2024 & 2032
- Figure 16: North America Polyclonal Antibodies Market Revenue (Million), by Application 2024 & 2032
- Figure 17: North America Polyclonal Antibodies Market Revenue Share (%), by Application 2024 & 2032
- Figure 18: North America Polyclonal Antibodies Market Revenue (Million), by End User 2024 & 2032
- Figure 19: North America Polyclonal Antibodies Market Revenue Share (%), by End User 2024 & 2032
- Figure 20: North America Polyclonal Antibodies Market Revenue (Million), by Country 2024 & 2032
- Figure 21: North America Polyclonal Antibodies Market Revenue Share (%), by Country 2024 & 2032
- Figure 22: Europe Polyclonal Antibodies Market Revenue (Million), by Product Type 2024 & 2032
- Figure 23: Europe Polyclonal Antibodies Market Revenue Share (%), by Product Type 2024 & 2032
- Figure 24: Europe Polyclonal Antibodies Market Revenue (Million), by Source 2024 & 2032
- Figure 25: Europe Polyclonal Antibodies Market Revenue Share (%), by Source 2024 & 2032
- Figure 26: Europe Polyclonal Antibodies Market Revenue (Million), by Application 2024 & 2032
- Figure 27: Europe Polyclonal Antibodies Market Revenue Share (%), by Application 2024 & 2032
- Figure 28: Europe Polyclonal Antibodies Market Revenue (Million), by End User 2024 & 2032
- Figure 29: Europe Polyclonal Antibodies Market Revenue Share (%), by End User 2024 & 2032
- Figure 30: Europe Polyclonal Antibodies Market Revenue (Million), by Country 2024 & 2032
- Figure 31: Europe Polyclonal Antibodies Market Revenue Share (%), by Country 2024 & 2032
- Figure 32: Asia Pacific Polyclonal Antibodies Market Revenue (Million), by Product Type 2024 & 2032
- Figure 33: Asia Pacific Polyclonal Antibodies Market Revenue Share (%), by Product Type 2024 & 2032
- Figure 34: Asia Pacific Polyclonal Antibodies Market Revenue (Million), by Source 2024 & 2032
- Figure 35: Asia Pacific Polyclonal Antibodies Market Revenue Share (%), by Source 2024 & 2032
- Figure 36: Asia Pacific Polyclonal Antibodies Market Revenue (Million), by Application 2024 & 2032
- Figure 37: Asia Pacific Polyclonal Antibodies Market Revenue Share (%), by Application 2024 & 2032
- Figure 38: Asia Pacific Polyclonal Antibodies Market Revenue (Million), by End User 2024 & 2032
- Figure 39: Asia Pacific Polyclonal Antibodies Market Revenue Share (%), by End User 2024 & 2032
- Figure 40: Asia Pacific Polyclonal Antibodies Market Revenue (Million), by Country 2024 & 2032
- Figure 41: Asia Pacific Polyclonal Antibodies Market Revenue Share (%), by Country 2024 & 2032
- Figure 42: Middle East and Africa Polyclonal Antibodies Market Revenue (Million), by Product Type 2024 & 2032
- Figure 43: Middle East and Africa Polyclonal Antibodies Market Revenue Share (%), by Product Type 2024 & 2032
- Figure 44: Middle East and Africa Polyclonal Antibodies Market Revenue (Million), by Source 2024 & 2032
- Figure 45: Middle East and Africa Polyclonal Antibodies Market Revenue Share (%), by Source 2024 & 2032
- Figure 46: Middle East and Africa Polyclonal Antibodies Market Revenue (Million), by Application 2024 & 2032
- Figure 47: Middle East and Africa Polyclonal Antibodies Market Revenue Share (%), by Application 2024 & 2032
- Figure 48: Middle East and Africa Polyclonal Antibodies Market Revenue (Million), by End User 2024 & 2032
- Figure 49: Middle East and Africa Polyclonal Antibodies Market Revenue Share (%), by End User 2024 & 2032
- Figure 50: Middle East and Africa Polyclonal Antibodies Market Revenue (Million), by Country 2024 & 2032
- Figure 51: Middle East and Africa Polyclonal Antibodies Market Revenue Share (%), by Country 2024 & 2032
- Figure 52: South America Polyclonal Antibodies Market Revenue (Million), by Product Type 2024 & 2032
- Figure 53: South America Polyclonal Antibodies Market Revenue Share (%), by Product Type 2024 & 2032
- Figure 54: South America Polyclonal Antibodies Market Revenue (Million), by Source 2024 & 2032
- Figure 55: South America Polyclonal Antibodies Market Revenue Share (%), by Source 2024 & 2032
- Figure 56: South America Polyclonal Antibodies Market Revenue (Million), by Application 2024 & 2032
- Figure 57: South America Polyclonal Antibodies Market Revenue Share (%), by Application 2024 & 2032
- Figure 58: South America Polyclonal Antibodies Market Revenue (Million), by End User 2024 & 2032
- Figure 59: South America Polyclonal Antibodies Market Revenue Share (%), by End User 2024 & 2032
- Figure 60: South America Polyclonal Antibodies Market Revenue (Million), by Country 2024 & 2032
- Figure 61: South America Polyclonal Antibodies Market Revenue Share (%), by Country 2024 & 2032
List of Tables
- Table 1: Global Polyclonal Antibodies Market Revenue Million Forecast, by Region 2019 & 2032
- Table 2: Global Polyclonal Antibodies Market Revenue Million Forecast, by Product Type 2019 & 2032
- Table 3: Global Polyclonal Antibodies Market Revenue Million Forecast, by Source 2019 & 2032
- Table 4: Global Polyclonal Antibodies Market Revenue Million Forecast, by Application 2019 & 2032
- Table 5: Global Polyclonal Antibodies Market Revenue Million Forecast, by End User 2019 & 2032
- Table 6: Global Polyclonal Antibodies Market Revenue Million Forecast, by Region 2019 & 2032
- Table 7: Global Polyclonal Antibodies Market Revenue Million Forecast, by Country 2019 & 2032
- Table 8: United States Polyclonal Antibodies Market Revenue (Million) Forecast, by Application 2019 & 2032
- Table 9: Canada Polyclonal Antibodies Market Revenue (Million) Forecast, by Application 2019 & 2032
- Table 10: Mexico Polyclonal Antibodies Market Revenue (Million) Forecast, by Application 2019 & 2032
- Table 11: Global Polyclonal Antibodies Market Revenue Million Forecast, by Country 2019 & 2032
- Table 12: Germany Polyclonal Antibodies Market Revenue (Million) Forecast, by Application 2019 & 2032
- Table 13: United Kingdom Polyclonal Antibodies Market Revenue (Million) Forecast, by Application 2019 & 2032
- Table 14: France Polyclonal Antibodies Market Revenue (Million) Forecast, by Application 2019 & 2032
- Table 15: Italy Polyclonal Antibodies Market Revenue (Million) Forecast, by Application 2019 & 2032
- Table 16: Spain Polyclonal Antibodies Market Revenue (Million) Forecast, by Application 2019 & 2032
- Table 17: Rest of Europe Polyclonal Antibodies Market Revenue (Million) Forecast, by Application 2019 & 2032
- Table 18: Global Polyclonal Antibodies Market Revenue Million Forecast, by Country 2019 & 2032
- Table 19: China Polyclonal Antibodies Market Revenue (Million) Forecast, by Application 2019 & 2032
- Table 20: Japan Polyclonal Antibodies Market Revenue (Million) Forecast, by Application 2019 & 2032
- Table 21: India Polyclonal Antibodies Market Revenue (Million) Forecast, by Application 2019 & 2032
- Table 22: Australia Polyclonal Antibodies Market Revenue (Million) Forecast, by Application 2019 & 2032
- Table 23: South Korea Polyclonal Antibodies Market Revenue (Million) Forecast, by Application 2019 & 2032
- Table 24: Global Polyclonal Antibodies Market Revenue Million Forecast, by Country 2019 & 2032
- Table 25: GCC Polyclonal Antibodies Market Revenue (Million) Forecast, by Application 2019 & 2032
- Table 26: South Africa Polyclonal Antibodies Market Revenue (Million) Forecast, by Application 2019 & 2032
- Table 27: Rest of Middle East and Africa Polyclonal Antibodies Market Revenue (Million) Forecast, by Application 2019 & 2032
- Table 28: Global Polyclonal Antibodies Market Revenue Million Forecast, by Country 2019 & 2032
- Table 29: Brazil Polyclonal Antibodies Market Revenue (Million) Forecast, by Application 2019 & 2032
- Table 30: Argentina Polyclonal Antibodies Market Revenue (Million) Forecast, by Application 2019 & 2032
- Table 31: Rest of South America Polyclonal Antibodies Market Revenue (Million) Forecast, by Application 2019 & 2032
- Table 32: Global Polyclonal Antibodies Market Revenue Million Forecast, by Product Type 2019 & 2032
- Table 33: Global Polyclonal Antibodies Market Revenue Million Forecast, by Source 2019 & 2032
- Table 34: Global Polyclonal Antibodies Market Revenue Million Forecast, by Application 2019 & 2032
- Table 35: Global Polyclonal Antibodies Market Revenue Million Forecast, by End User 2019 & 2032
- Table 36: Global Polyclonal Antibodies Market Revenue Million Forecast, by Country 2019 & 2032
- Table 37: United States Polyclonal Antibodies Market Revenue (Million) Forecast, by Application 2019 & 2032
- Table 38: Canada Polyclonal Antibodies Market Revenue (Million) Forecast, by Application 2019 & 2032
- Table 39: Mexico Polyclonal Antibodies Market Revenue (Million) Forecast, by Application 2019 & 2032
- Table 40: Global Polyclonal Antibodies Market Revenue Million Forecast, by Product Type 2019 & 2032
- Table 41: Global Polyclonal Antibodies Market Revenue Million Forecast, by Source 2019 & 2032
- Table 42: Global Polyclonal Antibodies Market Revenue Million Forecast, by Application 2019 & 2032
- Table 43: Global Polyclonal Antibodies Market Revenue Million Forecast, by End User 2019 & 2032
- Table 44: Global Polyclonal Antibodies Market Revenue Million Forecast, by Country 2019 & 2032
- Table 45: Germany Polyclonal Antibodies Market Revenue (Million) Forecast, by Application 2019 & 2032
- Table 46: United Kingdom Polyclonal Antibodies Market Revenue (Million) Forecast, by Application 2019 & 2032
- Table 47: France Polyclonal Antibodies Market Revenue (Million) Forecast, by Application 2019 & 2032
- Table 48: Italy Polyclonal Antibodies Market Revenue (Million) Forecast, by Application 2019 & 2032
- Table 49: Spain Polyclonal Antibodies Market Revenue (Million) Forecast, by Application 2019 & 2032
- Table 50: Rest of Europe Polyclonal Antibodies Market Revenue (Million) Forecast, by Application 2019 & 2032
- Table 51: Global Polyclonal Antibodies Market Revenue Million Forecast, by Product Type 2019 & 2032
- Table 52: Global Polyclonal Antibodies Market Revenue Million Forecast, by Source 2019 & 2032
- Table 53: Global Polyclonal Antibodies Market Revenue Million Forecast, by Application 2019 & 2032
- Table 54: Global Polyclonal Antibodies Market Revenue Million Forecast, by End User 2019 & 2032
- Table 55: Global Polyclonal Antibodies Market Revenue Million Forecast, by Country 2019 & 2032
- Table 56: China Polyclonal Antibodies Market Revenue (Million) Forecast, by Application 2019 & 2032
- Table 57: Japan Polyclonal Antibodies Market Revenue (Million) Forecast, by Application 2019 & 2032
- Table 58: India Polyclonal Antibodies Market Revenue (Million) Forecast, by Application 2019 & 2032
- Table 59: Australia Polyclonal Antibodies Market Revenue (Million) Forecast, by Application 2019 & 2032
- Table 60: South Korea Polyclonal Antibodies Market Revenue (Million) Forecast, by Application 2019 & 2032
- Table 61: Global Polyclonal Antibodies Market Revenue Million Forecast, by Product Type 2019 & 2032
- Table 62: Global Polyclonal Antibodies Market Revenue Million Forecast, by Source 2019 & 2032
- Table 63: Global Polyclonal Antibodies Market Revenue Million Forecast, by Application 2019 & 2032
- Table 64: Global Polyclonal Antibodies Market Revenue Million Forecast, by End User 2019 & 2032
- Table 65: Global Polyclonal Antibodies Market Revenue Million Forecast, by Country 2019 & 2032
- Table 66: GCC Polyclonal Antibodies Market Revenue (Million) Forecast, by Application 2019 & 2032
- Table 67: South Africa Polyclonal Antibodies Market Revenue (Million) Forecast, by Application 2019 & 2032
- Table 68: Rest of Middle East and Africa Polyclonal Antibodies Market Revenue (Million) Forecast, by Application 2019 & 2032
- Table 69: Global Polyclonal Antibodies Market Revenue Million Forecast, by Product Type 2019 & 2032
- Table 70: Global Polyclonal Antibodies Market Revenue Million Forecast, by Source 2019 & 2032
- Table 71: Global Polyclonal Antibodies Market Revenue Million Forecast, by Application 2019 & 2032
- Table 72: Global Polyclonal Antibodies Market Revenue Million Forecast, by End User 2019 & 2032
- Table 73: Global Polyclonal Antibodies Market Revenue Million Forecast, by Country 2019 & 2032
- Table 74: Brazil Polyclonal Antibodies Market Revenue (Million) Forecast, by Application 2019 & 2032
- Table 75: Argentina Polyclonal Antibodies Market Revenue (Million) Forecast, by Application 2019 & 2032
- Table 76: Rest of South America Polyclonal Antibodies Market Revenue (Million) Forecast, by Application 2019 & 2032
Frequently Asked Questions
1. What is the projected Compound Annual Growth Rate (CAGR) of the Polyclonal Antibodies Market?
The projected CAGR is approximately 5.53%.
2. Which companies are prominent players in the Polyclonal Antibodies Market?
Key companies in the market include Merck Millipore, Immunoprecise Antibodies Ltd, GeneTex, SAB Biotherapeutics, Lonza Group, Gallus Immunotech, F Hoffmann-La Roche AG, Creative Diagnostics, PerkinElmer Inc, IGY Life Sciences, Agilent Technologies, Emergent BioSolutions Inc, Bio- Rad Laboratories.
3. What are the main segments of the Polyclonal Antibodies Market?
The market segments include Product Type, Source, Application, End User.
4. Can you provide details about the market size?
The market size is estimated to be USD 1.45 Million as of 2022.
5. What are some drivers contributing to market growth?
Increasing Global Prevalence of Infectious and Chronic Diseases like Cancer.; Use of Polyclonal Antibodies in various Diagnostic Testing and Biopharmaceutical Industries..
6. What are the notable trends driving market growth?
Secondary Antibody Segment is Expected to Dominate the Polyclonal Antibodies Market Over the Forecast Period.
7. Are there any restraints impacting market growth?
Limited Availability of High Quality Polyclonal Antibodies.
8. Can you provide examples of recent developments in the market?
October 2023: Creative Diagnostics, a leading manufacturer and supplier of antibodies, antigens, and assay kits, has recently announced a series of new Anti-Small Molecule Label Antibodies to facilitate the development of nucleic acid lateral flow immunoassay. These antibodies can specifically bind to small molecule labels and offer customers multiple choices with Anti-FAM polyclonal antibodies.
9. What pricing options are available for accessing the report?
Pricing options include single-user, multi-user, and enterprise licenses priced at USD 4750, USD 5250, and USD 8750 respectively.
10. Is the market size provided in terms of value or volume?
The market size is provided in terms of value, measured in Million.
11. Are there any specific market keywords associated with the report?
Yes, the market keyword associated with the report is "Polyclonal Antibodies Market," which aids in identifying and referencing the specific market segment covered.
12. How do I determine which pricing option suits my needs best?
The pricing options vary based on user requirements and access needs. Individual users may opt for single-user licenses, while businesses requiring broader access may choose multi-user or enterprise licenses for cost-effective access to the report.
13. Are there any additional resources or data provided in the Polyclonal Antibodies Market report?
While the report offers comprehensive insights, it's advisable to review the specific contents or supplementary materials provided to ascertain if additional resources or data are available.
14. How can I stay updated on further developments or reports in the Polyclonal Antibodies Market?
To stay informed about further developments, trends, and reports in the Polyclonal Antibodies Market, consider subscribing to industry newsletters, following relevant companies and organizations, or regularly checking reputable industry news sources and publications.
Methodology
Step 1 - Identification of Relevant Samples Size from Population Database


Step 2 - Approaches for Defining Global Market Size (Value, Volume* & Price*)

Note*: In applicable scenarios
Step 3 - Data Sources
Primary Research
- Web Analytics
- Survey Reports
- Research Institute
- Latest Research Reports
- Opinion Leaders
Secondary Research
- Annual Reports
- White Paper
- Latest Press Release
- Industry Association
- Paid Database
- Investor Presentations

Step 4 - Data Triangulation
Involves using different sources of information in order to increase the validity of a study
These sources are likely to be stakeholders in a program - participants, other researchers, program staff, other community members, and so on.
Then we put all data in single framework & apply various statistical tools to find out the dynamic on the market.
During the analysis stage, feedback from the stakeholder groups would be compared to determine areas of agreement as well as areas of divergence


