

Key Insights
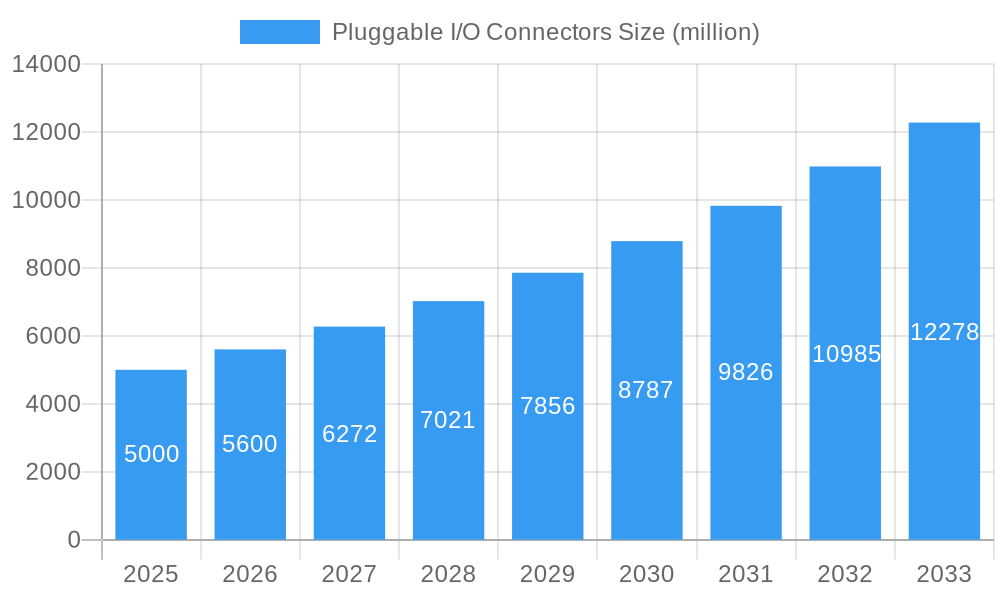
The Pluggable I/O Connector market is experiencing robust growth, driven by the increasing demand for high-speed data transmission and miniaturization in various electronic devices. The market, estimated at $5 billion in 2025, is projected to exhibit a Compound Annual Growth Rate (CAGR) of approximately 12% from 2025 to 2033, reaching a value exceeding $12 billion by the end of the forecast period. Key drivers include the proliferation of high-performance computing (HPC), data centers, and 5G infrastructure deployments, all of which necessitate connectors capable of handling ever-increasing bandwidth demands. Furthermore, the ongoing trend towards smaller, more energy-efficient devices fuels the demand for compact and reliable pluggable I/O connectors. Leading companies like TE Connectivity, Amphenol, and Molex are driving innovation, introducing advanced connector technologies that support higher data rates and improved signal integrity. However, market restraints include fluctuating raw material prices and the complexity of integrating these connectors into sophisticated electronic systems. The market is segmented by connector type (e.g., USB, SATA, PCIe), application (e.g., servers, networking equipment, consumer electronics), and region. North America and Asia-Pacific currently dominate the market, driven by significant technological advancements and substantial investments in infrastructure.
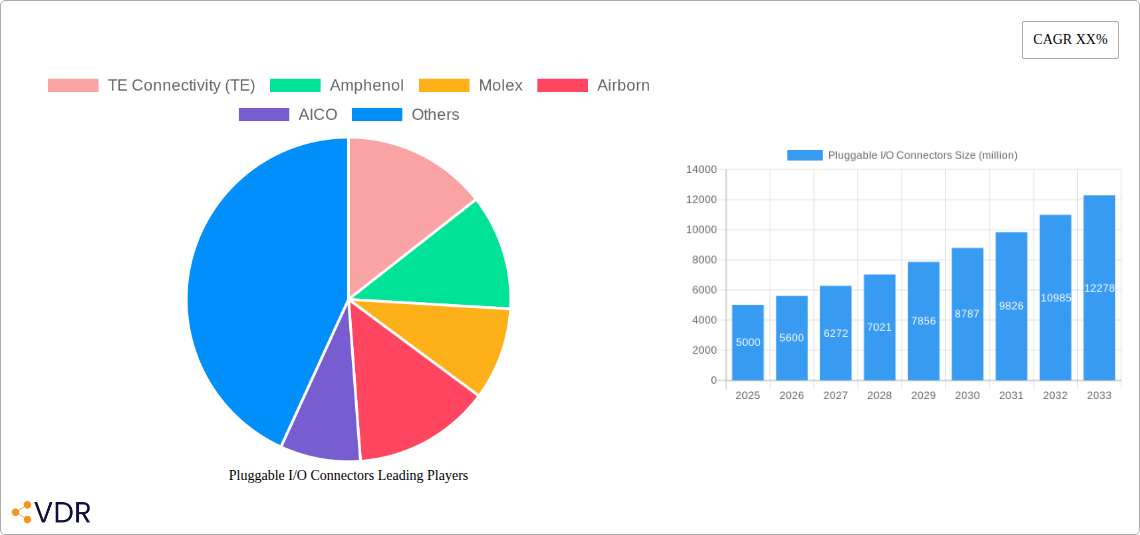
Pluggable I/O Connectors Market Size (In Billion)
The forecast for the Pluggable I/O Connector market reveals a sustained period of growth, influenced by continuing developments in data center infrastructure, the expansion of cloud computing services, and the relentless miniaturization of electronic devices. The consistent advancement of connector technology to meet higher bandwidth requirements and improved energy efficiency further reinforces positive market projections. Competitive dynamics will remain intense among major players, leading to innovation and price optimization. The market's segmentation offers various growth opportunities across different connector types and applications. Regional variations will also play a key role, with developing economies exhibiting considerable growth potential in the coming years due to rising infrastructure investments and increasing electronic device adoption. Strategic partnerships and mergers and acquisitions are likely to continue shaping the competitive landscape, emphasizing the importance of technological leadership and global reach for success in this dynamic market.
Pluggable I/O Connectors Company Market Share
Pluggable I/O Connectors Market Report: 2019-2033
This comprehensive report provides a detailed analysis of the Pluggable I/O Connectors market, encompassing market dynamics, growth trends, regional segmentation, product landscape, key players, and future outlook. The report covers the period from 2019 to 2033, with 2025 serving as the base and estimated year. This in-depth study caters to industry professionals, investors, and strategic decision-makers seeking actionable insights into this rapidly evolving sector. The parent market is the broader connectivity solutions market, while the child market is high-speed data transmission solutions. The report projects a market size of xx million units by 2033.
Pluggable I/O Connectors Market Dynamics & Structure
This section analyzes the competitive landscape, technological advancements, regulatory influences, and market trends impacting the Pluggable I/O Connectors market. The market is characterized by a moderately concentrated structure, with key players such as TE Connectivity, Amphenol, and Molex holding significant market share. The analysis delves into the impact of technological innovation, specifically in high-speed data transmission and miniaturization, on market dynamics. Furthermore, it explores the role of regulatory frameworks concerning data security and environmental compliance. The report also examines the competitive threat from substitute products and assesses the influence of mergers and acquisitions (M&A) activity on market consolidation.
- Market Concentration: High, with the top 5 players controlling approximately xx% of the market in 2025.
- Technological Innovation: Significant focus on higher bandwidth, lower latency, and miniaturization drives market growth.
- Regulatory Framework: Compliance with data security standards and environmental regulations impacts product development and market access.
- M&A Activity: xx major M&A deals recorded between 2019 and 2024, leading to increased market consolidation.
- Substitute Products: Wireless connectivity technologies present a degree of competitive pressure.
Pluggable I/O Connectors Growth Trends & Insights
The Pluggable I/O Connectors market exhibits robust growth, driven by increasing demand from diverse end-user industries. This section details the market size evolution, adoption rates across various segments, and the influence of technological disruptions on market trajectory. The report quantifies market growth using Compound Annual Growth Rate (CAGR) and market penetration rates. It also examines consumer behavior shifts and evolving preferences impacting product design and functionality. Significant growth is driven by the expanding adoption of high-speed data transmission in data centers, 5G infrastructure, and automotive applications. The report forecasts a CAGR of xx% during the forecast period (2025-2033).
Dominant Regions, Countries, or Segments in Pluggable I/O Connectors
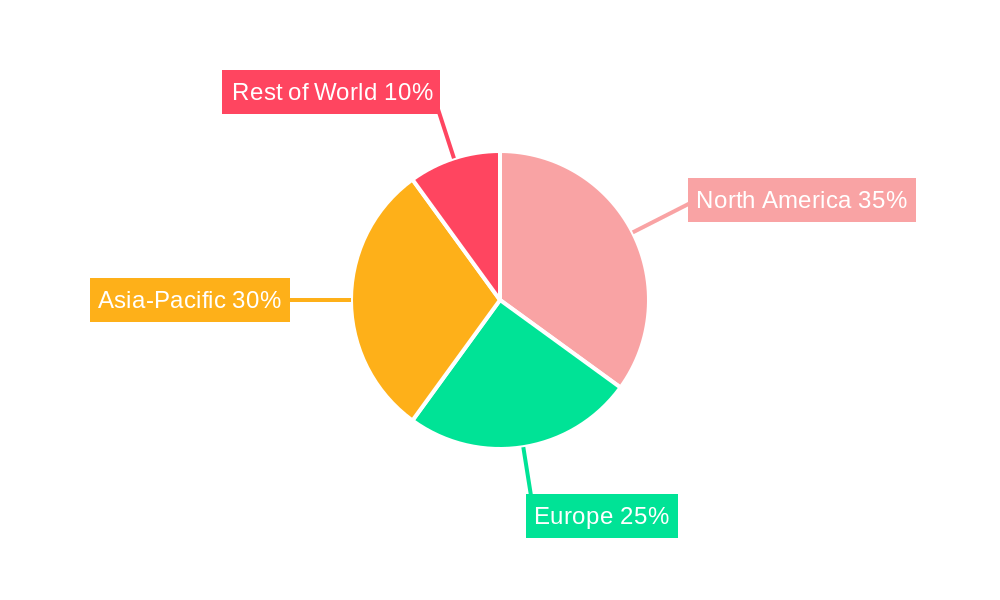
North America currently dominates the Pluggable I/O Connectors market, driven by strong technological advancements and high adoption rates in data centers and automotive industries. However, the Asia-Pacific region exhibits significant growth potential, fueled by expanding infrastructure and increasing investments in 5G networks. This section meticulously details the market share and growth potential of each key region, highlighting the underlying drivers.
- North America: Strong presence of major players, robust technological infrastructure, and high demand from data centers contribute to market leadership.
- Asia-Pacific: Rapid technological advancements, increasing investments in 5G infrastructure, and a growing automotive sector fuel significant growth potential.
- Europe: Steady growth driven by increasing adoption of high-speed data transmission in various sectors.
Pluggable I/O Connectors Product Landscape
The Pluggable I/O Connectors market features a diverse range of products, varying in terms of connector type, data speed, and application. Innovations include higher density connectors, miniaturized designs, and improved power handling capabilities. Key performance metrics include data transmission speed, signal integrity, and durability. Unique selling propositions often center on superior performance, smaller form factor, and enhanced reliability. Technological advancements focus on improving data rates, supporting higher power applications, and increasing connector density.
Key Drivers, Barriers & Challenges in Pluggable I/O Connectors
Key Drivers:
- Increased demand for high-speed data transmission across various industries.
- Miniaturization trends in electronics driving the need for smaller, more efficient connectors.
- Government investments in infrastructure projects such as 5G deployments.
Key Challenges:
- Supply chain disruptions impacting the availability of raw materials and components.
- Stringent regulatory requirements increasing compliance costs.
- Intense competition among established players and new entrants.
Emerging Opportunities in Pluggable I/O Connectors
Emerging trends include the increasing adoption of high-speed interfaces, like USB4 and Thunderbolt, alongside the expansion of applications in the automotive and industrial sectors. Untapped markets exist in developing economies where infrastructure development presents significant growth opportunities. The increasing demand for data center optimization also presents a key growth area.
Growth Accelerators in the Pluggable I/O Connectors Industry
Technological breakthroughs in connector design and materials science will accelerate market growth, alongside strategic partnerships among manufacturers and end-users to foster innovation. Furthermore, expansion into new markets and applications, such as the Internet of Things (IoT), will further fuel market expansion.
Key Players Shaping the Pluggable I/O Connectors Market
- TE Connectivity (TE)
- Amphenol
- Molex
- Airborn
- AICO
- Hirose
- Luxshare Tech
- Nextronics Engineering
- Shanxi Huada
Notable Milestones in Pluggable I/O Connectors Sector
- 2020: TE Connectivity launched a new line of high-speed pluggable connectors.
- 2022: Amphenol acquired a smaller connector manufacturer, expanding its product portfolio.
- 2023: Industry-wide adoption of a new standard for data transmission connectors. (Specific details of the standard would be inserted here in a full report)
In-Depth Pluggable I/O Connectors Market Outlook
The Pluggable I/O Connectors market is poised for continued growth, fueled by technological advancements, increased demand from various sectors, and expansion into emerging markets. Strategic partnerships and the development of innovative products will further shape the market trajectory. The market presents significant opportunities for existing players and new entrants to capitalize on the increasing demand for high-speed and reliable connectivity solutions.
Pluggable I/O Connectors Segmentation
-
1. Application
- 1.1. Data
- 1.2. Communications
- 1.3. Medical
-
2. Types
- 2.1. SFP
- 2.2. SFP+
- 2.3. QSFP+
- 2.4. Others
Pluggable I/O Connectors Segmentation By Geography
-
1. North America
- 1.1. United States
- 1.2. Canada
- 1.3. Mexico
-
2. South America
- 2.1. Brazil
- 2.2. Argentina
- 2.3. Rest of South America
-
3. Europe
- 3.1. United Kingdom
- 3.2. Germany
- 3.3. France
- 3.4. Italy
- 3.5. Spain
- 3.6. Russia
- 3.7. Benelux
- 3.8. Nordics
- 3.9. Rest of Europe
-
4. Middle East & Africa
- 4.1. Turkey
- 4.2. Israel
- 4.3. GCC
- 4.4. North Africa
- 4.5. South Africa
- 4.6. Rest of Middle East & Africa
-
5. Asia Pacific
- 5.1. China
- 5.2. India
- 5.3. Japan
- 5.4. South Korea
- 5.5. ASEAN
- 5.6. Oceania
- 5.7. Rest of Asia Pacific
Pluggable I/O Connectors Regional Market Share
Geographic Coverage of Pluggable I/O Connectors
Pluggable I/O Connectors REPORT HIGHLIGHTS
| Aspects | Details |
|---|---|
| Study Period | 2020-2034 |
| Base Year | 2025 |
| Estimated Year | 2026 |
| Forecast Period | 2026-2034 |
| Historical Period | 2020-2025 |
| Growth Rate | CAGR of 8.5% from 2020-2034 |
| Segmentation |
|
Table of Contents
- 1. Introduction
- 1.1. Research Scope
- 1.2. Market Segmentation
- 1.3. Research Objective
- 1.4. Definitions and Assumptions
- 2. Executive Summary
- 2.1. Market Snapshot
- 3. Market Dynamics
- 3.1. Market Drivers
- 3.2. Market Restrains
- 3.3. Market Trends
- 3.4. Market Opportunities
- 4. Market Factor Analysis
- 4.1. Porters Five Forces
- 4.1.1. Bargaining Power of Suppliers
- 4.1.2. Bargaining Power of Buyers
- 4.1.3. Threat of New Entrants
- 4.1.4. Threat of Substitutes
- 4.1.5. Competitive Rivalry
- 4.2. PESTEL analysis
- 4.3. BCG Analysis
- 4.3.1. Stars (High Growth, High Market Share)
- 4.3.2. Cash Cows (Low Growth, High Market Share)
- 4.3.3. Question Mark (High Growth, Low Market Share)
- 4.3.4. Dogs (Low Growth, Low Market Share)
- 4.4. Ansoff Matrix Analysis
- 4.5. Supply Chain Analysis
- 4.6. Regulatory Landscape
- 4.7. Current Market Potential and Opportunity Assessment (TAM–SAM–SOM Framework)
- 4.8. VDR Analyst Note
- 4.1. Porters Five Forces
- 5. Market Analysis, Insights and Forecast 2021-2033
- 5.1. Market Analysis, Insights and Forecast - by Application
- 5.1.1. Data
- 5.1.2. Communications
- 5.1.3. Medical
- 5.2. Market Analysis, Insights and Forecast - by Types
- 5.2.1. SFP
- 5.2.2. SFP+
- 5.2.3. QSFP+
- 5.2.4. Others
- 5.3. Market Analysis, Insights and Forecast - by Region
- 5.3.1. North America
- 5.3.2. South America
- 5.3.3. Europe
- 5.3.4. Middle East & Africa
- 5.3.5. Asia Pacific
- 5.1. Market Analysis, Insights and Forecast - by Application
- 6. Global Pluggable I/O Connectors Analysis, Insights and Forecast, 2021-2033
- 6.1. Market Analysis, Insights and Forecast - by Application
- 6.1.1. Data
- 6.1.2. Communications
- 6.1.3. Medical
- 6.2. Market Analysis, Insights and Forecast - by Types
- 6.2.1. SFP
- 6.2.2. SFP+
- 6.2.3. QSFP+
- 6.2.4. Others
- 6.1. Market Analysis, Insights and Forecast - by Application
- 7. North America Pluggable I/O Connectors Analysis, Insights and Forecast, 2021-2033
- 7.1. Market Analysis, Insights and Forecast - by Application
- 7.1.1. Data
- 7.1.2. Communications
- 7.1.3. Medical
- 7.2. Market Analysis, Insights and Forecast - by Types
- 7.2.1. SFP
- 7.2.2. SFP+
- 7.2.3. QSFP+
- 7.2.4. Others
- 7.1. Market Analysis, Insights and Forecast - by Application
- 8. South America Pluggable I/O Connectors Analysis, Insights and Forecast, 2021-2033
- 8.1. Market Analysis, Insights and Forecast - by Application
- 8.1.1. Data
- 8.1.2. Communications
- 8.1.3. Medical
- 8.2. Market Analysis, Insights and Forecast - by Types
- 8.2.1. SFP
- 8.2.2. SFP+
- 8.2.3. QSFP+
- 8.2.4. Others
- 8.1. Market Analysis, Insights and Forecast - by Application
- 9. Europe Pluggable I/O Connectors Analysis, Insights and Forecast, 2021-2033
- 9.1. Market Analysis, Insights and Forecast - by Application
- 9.1.1. Data
- 9.1.2. Communications
- 9.1.3. Medical
- 9.2. Market Analysis, Insights and Forecast - by Types
- 9.2.1. SFP
- 9.2.2. SFP+
- 9.2.3. QSFP+
- 9.2.4. Others
- 9.1. Market Analysis, Insights and Forecast - by Application
- 10. Middle East & Africa Pluggable I/O Connectors Analysis, Insights and Forecast, 2021-2033
- 10.1. Market Analysis, Insights and Forecast - by Application
- 10.1.1. Data
- 10.1.2. Communications
- 10.1.3. Medical
- 10.2. Market Analysis, Insights and Forecast - by Types
- 10.2.1. SFP
- 10.2.2. SFP+
- 10.2.3. QSFP+
- 10.2.4. Others
- 10.1. Market Analysis, Insights and Forecast - by Application
- 11. Asia Pacific Pluggable I/O Connectors Analysis, Insights and Forecast, 2021-2033
- 11.1. Market Analysis, Insights and Forecast - by Application
- 11.1.1. Data
- 11.1.2. Communications
- 11.1.3. Medical
- 11.2. Market Analysis, Insights and Forecast - by Types
- 11.2.1. SFP
- 11.2.2. SFP+
- 11.2.3. QSFP+
- 11.2.4. Others
- 11.1. Market Analysis, Insights and Forecast - by Application
- 12. Competitive Analysis
- 12.1. Company Profiles
- 12.1.1 TE Connectivity (TE)
- 12.1.1.1. Company Overview
- 12.1.1.2. Products
- 12.1.1.3. Company Financials
- 12.1.1.4. SWOT Analysis
- 12.1.2 Amphenol
- 12.1.2.1. Company Overview
- 12.1.2.2. Products
- 12.1.2.3. Company Financials
- 12.1.2.4. SWOT Analysis
- 12.1.3 Molex
- 12.1.3.1. Company Overview
- 12.1.3.2. Products
- 12.1.3.3. Company Financials
- 12.1.3.4. SWOT Analysis
- 12.1.4 Airborn
- 12.1.4.1. Company Overview
- 12.1.4.2. Products
- 12.1.4.3. Company Financials
- 12.1.4.4. SWOT Analysis
- 12.1.5 AICO
- 12.1.5.1. Company Overview
- 12.1.5.2. Products
- 12.1.5.3. Company Financials
- 12.1.5.4. SWOT Analysis
- 12.1.6 Hirose
- 12.1.6.1. Company Overview
- 12.1.6.2. Products
- 12.1.6.3. Company Financials
- 12.1.6.4. SWOT Analysis
- 12.1.7 Luxshare Tech
- 12.1.7.1. Company Overview
- 12.1.7.2. Products
- 12.1.7.3. Company Financials
- 12.1.7.4. SWOT Analysis
- 12.1.8 Nextronics Engineering
- 12.1.8.1. Company Overview
- 12.1.8.2. Products
- 12.1.8.3. Company Financials
- 12.1.8.4. SWOT Analysis
- 12.1.9 Shanxi Huada
- 12.1.9.1. Company Overview
- 12.1.9.2. Products
- 12.1.9.3. Company Financials
- 12.1.9.4. SWOT Analysis
- 12.1.1 TE Connectivity (TE)
- 12.2. Market Entropy
- 12.2.1 Company's Key Areas Served
- 12.2.2 Recent Developments
- 12.3. Company Market Share Analysis 2025
- 12.3.1 Top 5 Companies Market Share Analysis
- 12.3.2 Top 3 Companies Market Share Analysis
- 12.4. List of Potential Customers
- 13. Research Methodology
List of Figures
- Figure 1: Global Pluggable I/O Connectors Revenue Breakdown (undefined, %) by Region 2025 & 2033
- Figure 2: North America Pluggable I/O Connectors Revenue (undefined), by Application 2025 & 2033
- Figure 3: North America Pluggable I/O Connectors Revenue Share (%), by Application 2025 & 2033
- Figure 4: North America Pluggable I/O Connectors Revenue (undefined), by Types 2025 & 2033
- Figure 5: North America Pluggable I/O Connectors Revenue Share (%), by Types 2025 & 2033
- Figure 6: North America Pluggable I/O Connectors Revenue (undefined), by Country 2025 & 2033
- Figure 7: North America Pluggable I/O Connectors Revenue Share (%), by Country 2025 & 2033
- Figure 8: South America Pluggable I/O Connectors Revenue (undefined), by Application 2025 & 2033
- Figure 9: South America Pluggable I/O Connectors Revenue Share (%), by Application 2025 & 2033
- Figure 10: South America Pluggable I/O Connectors Revenue (undefined), by Types 2025 & 2033
- Figure 11: South America Pluggable I/O Connectors Revenue Share (%), by Types 2025 & 2033
- Figure 12: South America Pluggable I/O Connectors Revenue (undefined), by Country 2025 & 2033
- Figure 13: South America Pluggable I/O Connectors Revenue Share (%), by Country 2025 & 2033
- Figure 14: Europe Pluggable I/O Connectors Revenue (undefined), by Application 2025 & 2033
- Figure 15: Europe Pluggable I/O Connectors Revenue Share (%), by Application 2025 & 2033
- Figure 16: Europe Pluggable I/O Connectors Revenue (undefined), by Types 2025 & 2033
- Figure 17: Europe Pluggable I/O Connectors Revenue Share (%), by Types 2025 & 2033
- Figure 18: Europe Pluggable I/O Connectors Revenue (undefined), by Country 2025 & 2033
- Figure 19: Europe Pluggable I/O Connectors Revenue Share (%), by Country 2025 & 2033
- Figure 20: Middle East & Africa Pluggable I/O Connectors Revenue (undefined), by Application 2025 & 2033
- Figure 21: Middle East & Africa Pluggable I/O Connectors Revenue Share (%), by Application 2025 & 2033
- Figure 22: Middle East & Africa Pluggable I/O Connectors Revenue (undefined), by Types 2025 & 2033
- Figure 23: Middle East & Africa Pluggable I/O Connectors Revenue Share (%), by Types 2025 & 2033
- Figure 24: Middle East & Africa Pluggable I/O Connectors Revenue (undefined), by Country 2025 & 2033
- Figure 25: Middle East & Africa Pluggable I/O Connectors Revenue Share (%), by Country 2025 & 2033
- Figure 26: Asia Pacific Pluggable I/O Connectors Revenue (undefined), by Application 2025 & 2033
- Figure 27: Asia Pacific Pluggable I/O Connectors Revenue Share (%), by Application 2025 & 2033
- Figure 28: Asia Pacific Pluggable I/O Connectors Revenue (undefined), by Types 2025 & 2033
- Figure 29: Asia Pacific Pluggable I/O Connectors Revenue Share (%), by Types 2025 & 2033
- Figure 30: Asia Pacific Pluggable I/O Connectors Revenue (undefined), by Country 2025 & 2033
- Figure 31: Asia Pacific Pluggable I/O Connectors Revenue Share (%), by Country 2025 & 2033
List of Tables
- Table 1: Global Pluggable I/O Connectors Revenue undefined Forecast, by Application 2020 & 2033
- Table 2: Global Pluggable I/O Connectors Revenue undefined Forecast, by Types 2020 & 2033
- Table 3: Global Pluggable I/O Connectors Revenue undefined Forecast, by Region 2020 & 2033
- Table 4: Global Pluggable I/O Connectors Revenue undefined Forecast, by Application 2020 & 2033
- Table 5: Global Pluggable I/O Connectors Revenue undefined Forecast, by Types 2020 & 2033
- Table 6: Global Pluggable I/O Connectors Revenue undefined Forecast, by Country 2020 & 2033
- Table 7: United States Pluggable I/O Connectors Revenue (undefined) Forecast, by Application 2020 & 2033
- Table 8: Canada Pluggable I/O Connectors Revenue (undefined) Forecast, by Application 2020 & 2033
- Table 9: Mexico Pluggable I/O Connectors Revenue (undefined) Forecast, by Application 2020 & 2033
- Table 10: Global Pluggable I/O Connectors Revenue undefined Forecast, by Application 2020 & 2033
- Table 11: Global Pluggable I/O Connectors Revenue undefined Forecast, by Types 2020 & 2033
- Table 12: Global Pluggable I/O Connectors Revenue undefined Forecast, by Country 2020 & 2033
- Table 13: Brazil Pluggable I/O Connectors Revenue (undefined) Forecast, by Application 2020 & 2033
- Table 14: Argentina Pluggable I/O Connectors Revenue (undefined) Forecast, by Application 2020 & 2033
- Table 15: Rest of South America Pluggable I/O Connectors Revenue (undefined) Forecast, by Application 2020 & 2033
- Table 16: Global Pluggable I/O Connectors Revenue undefined Forecast, by Application 2020 & 2033
- Table 17: Global Pluggable I/O Connectors Revenue undefined Forecast, by Types 2020 & 2033
- Table 18: Global Pluggable I/O Connectors Revenue undefined Forecast, by Country 2020 & 2033
- Table 19: United Kingdom Pluggable I/O Connectors Revenue (undefined) Forecast, by Application 2020 & 2033
- Table 20: Germany Pluggable I/O Connectors Revenue (undefined) Forecast, by Application 2020 & 2033
- Table 21: France Pluggable I/O Connectors Revenue (undefined) Forecast, by Application 2020 & 2033
- Table 22: Italy Pluggable I/O Connectors Revenue (undefined) Forecast, by Application 2020 & 2033
- Table 23: Spain Pluggable I/O Connectors Revenue (undefined) Forecast, by Application 2020 & 2033
- Table 24: Russia Pluggable I/O Connectors Revenue (undefined) Forecast, by Application 2020 & 2033
- Table 25: Benelux Pluggable I/O Connectors Revenue (undefined) Forecast, by Application 2020 & 2033
- Table 26: Nordics Pluggable I/O Connectors Revenue (undefined) Forecast, by Application 2020 & 2033
- Table 27: Rest of Europe Pluggable I/O Connectors Revenue (undefined) Forecast, by Application 2020 & 2033
- Table 28: Global Pluggable I/O Connectors Revenue undefined Forecast, by Application 2020 & 2033
- Table 29: Global Pluggable I/O Connectors Revenue undefined Forecast, by Types 2020 & 2033
- Table 30: Global Pluggable I/O Connectors Revenue undefined Forecast, by Country 2020 & 2033
- Table 31: Turkey Pluggable I/O Connectors Revenue (undefined) Forecast, by Application 2020 & 2033
- Table 32: Israel Pluggable I/O Connectors Revenue (undefined) Forecast, by Application 2020 & 2033
- Table 33: GCC Pluggable I/O Connectors Revenue (undefined) Forecast, by Application 2020 & 2033
- Table 34: North Africa Pluggable I/O Connectors Revenue (undefined) Forecast, by Application 2020 & 2033
- Table 35: South Africa Pluggable I/O Connectors Revenue (undefined) Forecast, by Application 2020 & 2033
- Table 36: Rest of Middle East & Africa Pluggable I/O Connectors Revenue (undefined) Forecast, by Application 2020 & 2033
- Table 37: Global Pluggable I/O Connectors Revenue undefined Forecast, by Application 2020 & 2033
- Table 38: Global Pluggable I/O Connectors Revenue undefined Forecast, by Types 2020 & 2033
- Table 39: Global Pluggable I/O Connectors Revenue undefined Forecast, by Country 2020 & 2033
- Table 40: China Pluggable I/O Connectors Revenue (undefined) Forecast, by Application 2020 & 2033
- Table 41: India Pluggable I/O Connectors Revenue (undefined) Forecast, by Application 2020 & 2033
- Table 42: Japan Pluggable I/O Connectors Revenue (undefined) Forecast, by Application 2020 & 2033
- Table 43: South Korea Pluggable I/O Connectors Revenue (undefined) Forecast, by Application 2020 & 2033
- Table 44: ASEAN Pluggable I/O Connectors Revenue (undefined) Forecast, by Application 2020 & 2033
- Table 45: Oceania Pluggable I/O Connectors Revenue (undefined) Forecast, by Application 2020 & 2033
- Table 46: Rest of Asia Pacific Pluggable I/O Connectors Revenue (undefined) Forecast, by Application 2020 & 2033
Frequently Asked Questions
1. What is the projected Compound Annual Growth Rate (CAGR) of the Pluggable I/O Connectors?
The projected CAGR is approximately 8.5%.
2. Which companies are prominent players in the Pluggable I/O Connectors?
Key companies in the market include TE Connectivity (TE), Amphenol, Molex, Airborn, AICO, Hirose, Luxshare Tech, Nextronics Engineering, Shanxi Huada.
3. What are the main segments of the Pluggable I/O Connectors?
The market segments include Application, Types.
4. Can you provide details about the market size?
The market size is estimated to be USD XXX N/A as of 2022.
5. What are some drivers contributing to market growth?
N/A
6. What are the notable trends driving market growth?
N/A
7. Are there any restraints impacting market growth?
N/A
8. Can you provide examples of recent developments in the market?
N/A
9. What pricing options are available for accessing the report?
Pricing options include single-user, multi-user, and enterprise licenses priced at USD 4900.00, USD 7350.00, and USD 9800.00 respectively.
10. Is the market size provided in terms of value or volume?
The market size is provided in terms of value, measured in N/A.
11. Are there any specific market keywords associated with the report?
Yes, the market keyword associated with the report is "Pluggable I/O Connectors," which aids in identifying and referencing the specific market segment covered.
12. How do I determine which pricing option suits my needs best?
The pricing options vary based on user requirements and access needs. Individual users may opt for single-user licenses, while businesses requiring broader access may choose multi-user or enterprise licenses for cost-effective access to the report.
13. Are there any additional resources or data provided in the Pluggable I/O Connectors report?
While the report offers comprehensive insights, it's advisable to review the specific contents or supplementary materials provided to ascertain if additional resources or data are available.
14. How can I stay updated on further developments or reports in the Pluggable I/O Connectors?
To stay informed about further developments, trends, and reports in the Pluggable I/O Connectors, consider subscribing to industry newsletters, following relevant companies and organizations, or regularly checking reputable industry news sources and publications.
Methodology
Step 1 - Identification of Relevant Samples Size from Population Database


Step 2 - Approaches for Defining Global Market Size (Value, Volume* & Price*)

Note*: In applicable scenarios
Step 3 - Data Sources
Primary Research
- Web Analytics
- Survey Reports
- Research Institute
- Latest Research Reports
- Opinion Leaders
Secondary Research
- Annual Reports
- White Paper
- Latest Press Release
- Industry Association
- Paid Database
- Investor Presentations

Step 4 - Data Triangulation
Involves using different sources of information in order to increase the validity of a study
These sources are likely to be stakeholders in a program - participants, other researchers, program staff, other community members, and so on.
Then we put all data in single framework & apply various statistical tools to find out the dynamic on the market.
During the analysis stage, feedback from the stakeholder groups would be compared to determine areas of agreement as well as areas of divergence