
Key Insights
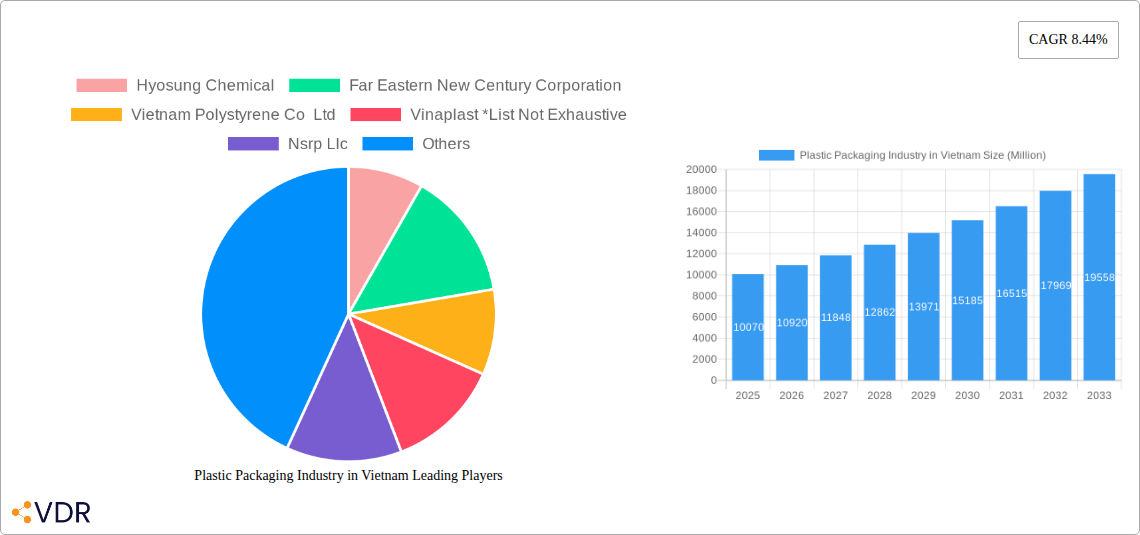
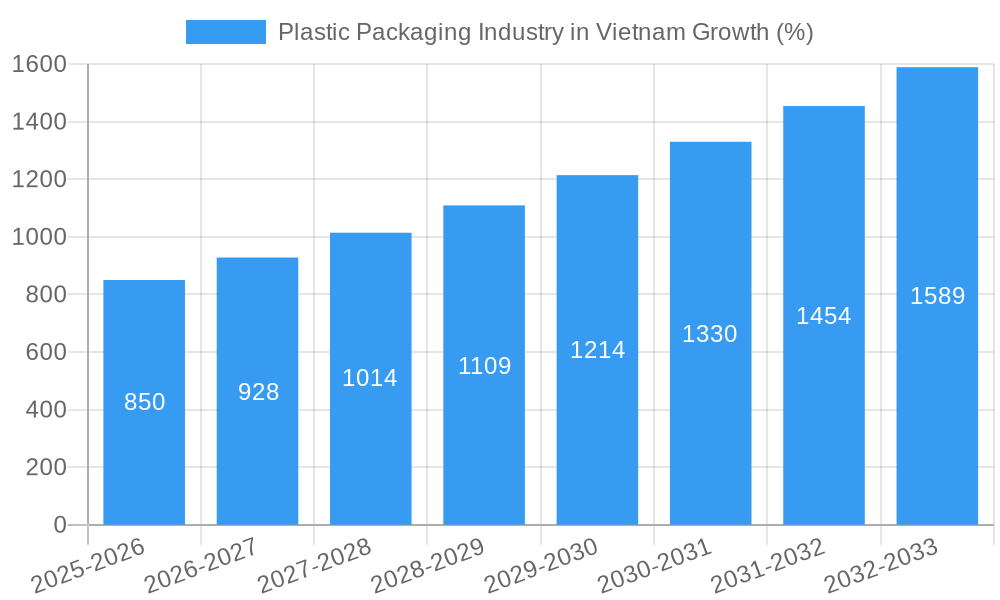
The Vietnamese plastic packaging market, valued at approximately $10.07 billion in 2025, is experiencing robust growth, projected to expand at a compound annual growth rate (CAGR) of 8.44% from 2025 to 2033. This surge is driven by several key factors. Firstly, Vietnam's burgeoning consumer goods sector, fueled by a rapidly expanding middle class and increasing urbanization, is significantly increasing demand for packaged goods. Secondly, the country's robust manufacturing and export-oriented economy necessitates extensive packaging solutions across various industries, including food and beverage, electronics, and construction. Thirdly, ongoing infrastructure development projects further stimulate demand for plastic packaging materials. However, the market faces challenges such as growing environmental concerns regarding plastic waste, leading to stricter regulations and a push towards sustainable alternatives like bioplastics. This trend presents both a challenge and an opportunity, prompting innovation in biodegradable and recyclable packaging solutions. The market segmentation reveals significant contributions from various types of plastics, including traditional plastics, PVC, and increasingly, bioplastics. Blow molding, extrusion, and injection molding remain dominant technologies, but the market is witnessing a gradual shift towards more advanced and efficient techniques.
The competitive landscape features both domestic and international players, including Hyosung Chemical, Far Eastern New Century Corporation, and Toray Industries Inc. These companies are strategically focusing on product diversification, technological advancements, and capacity expansion to maintain market share and capitalize on growth opportunities. The geographical distribution of the market is primarily concentrated in Vietnam, with potential for further regional expansion within Southeast Asia. While the current focus is on addressing environmental concerns, the overall outlook for the Vietnamese plastic packaging market remains positive, with significant growth potential driven by robust economic development and evolving consumer preferences. The market's future trajectory hinges on the successful adoption of sustainable practices and innovations to mitigate environmental impact while meeting the growing demands of a dynamic economy.
Plastic Packaging Industry in Vietnam: Market Report 2019-2033
This comprehensive report provides a detailed analysis of the dynamic plastic packaging industry in Vietnam, covering market size, growth trends, key players, and future outlook. The study period spans from 2019 to 2033, with 2025 serving as the base and estimated year. This report is essential for industry professionals, investors, and strategic decision-makers seeking to understand and capitalize on opportunities within this rapidly evolving market.
Plastic Packaging Industry in Vietnam Market Dynamics & Structure
The Vietnamese plastic packaging market exhibits moderate concentration, with several large domestic and international players competing alongside numerous smaller enterprises. Technological innovation, driven by increasing demand for sustainable and lightweight packaging solutions, is a key dynamic. Vietnam’s regulatory framework, while evolving, is increasingly focused on environmental sustainability and waste management, presenting both challenges and opportunities for industry players. Importantly, bioplastics are emerging as a key substitute for traditional plastics, fueled by growing environmental concerns. The end-user demographic skews towards a rapidly expanding middle class with increasing consumption patterns, driving demand across various application segments. M&A activity has been moderate, primarily focused on capacity expansion and strategic partnerships.
- Market Concentration: Moderately concentrated, with a few dominant players holding xx% market share.
- Technological Innovation: Strong focus on lightweighting, improved barrier properties, and bioplastics.
- Regulatory Framework: Shifting towards stricter environmental regulations impacting material choices and waste management.
- Competitive Substitutes: Growing adoption of bioplastics and alternative packaging materials.
- End-User Demographics: Rising middle class driving increased consumption across various segments.
- M&A Trends: Moderate activity, driven by expansion and strategic alliances (xx deals in the last 5 years).
Plastic Packaging Industry in Vietnam Growth Trends & Insights
The Vietnamese plastic packaging market has witnessed robust growth over the historical period (2019-2024), driven by factors such as rising consumer spending, expanding manufacturing sector, and increased demand across diverse end-use applications. The market size, valued at xx million units in 2024, is projected to grow at a CAGR of xx% during the forecast period (2025-2033), reaching xx million units by 2033. This growth is further propelled by technological advancements such as the adoption of flexible packaging materials, improved barrier technologies, and the increasing use of bioplastics. Shifting consumer preferences towards convenience and enhanced product preservation also contribute to the expansion of the market. Furthermore, the government's focus on infrastructure development is creating further opportunities for plastic packaging solutions within the construction and transportation sectors. Market penetration of advanced packaging technologies remains relatively low, indicating substantial scope for future growth.
Dominant Regions, Countries, or Segments in Plastic Packaging Industry in Vietnam
Southern Vietnam dominates the plastic packaging market due to its concentrated industrial base and proximity to major ports. Within the segmentation, packaging applications account for the lion's share (xx%), followed by electrical & electronics (xx%) and building & construction (xx%). Traditional plastics continue to dominate the type segment (xx%), however, polyvinyl chloride (PVC) displays strong growth potential due to its versatility in various applications. Blow molding remains the leading technology segment (xx%), but injection molding is also experiencing significant growth due to the increasing demand for complex packaging designs.
- Key Growth Drivers: Rapid urbanization, rising disposable incomes, and robust economic growth.
- Dominance Factors: Strong manufacturing base in Southern Vietnam, proximity to ports, and government support.
- Growth Potential: High potential for expansion in specialized packaging and bioplastic adoption.
Plastic Packaging Industry in Vietnam Product Landscape
The Vietnamese plastic packaging market offers a wide array of products, including flexible films, rigid containers, bottles, and specialized packaging solutions. Recent innovations focus on lightweighting, improved barrier properties, and enhanced recyclability to address sustainability concerns. Product differentiation is driven by material type, design, and functionality, meeting the specific needs of diverse end-use industries. Key advancements include the increasing adoption of advanced barrier films for food packaging and innovative designs tailored to meet e-commerce requirements. The introduction of bio-based and compostable materials is also reshaping the product landscape, providing sustainable alternatives to traditional plastics.
Key Drivers, Barriers & Challenges in Plastic Packaging Industry in Vietnam
Key Drivers:
- Growing consumerism and urbanization.
- Expanding manufacturing and industrial sectors.
- Government initiatives promoting economic development.
- Increasing demand for convenience and food preservation.
Key Challenges and Restraints:
- Increasing environmental concerns and regulations on plastic waste.
- Fluctuations in raw material prices (e.g., crude oil).
- Competition from alternative packaging materials.
- Dependence on imported raw materials in some segments. This results in an annual impact of xx million units in reduced production capacity.
Emerging Opportunities in Plastic Packaging Industry in Vietnam
- Growing demand for sustainable and eco-friendly packaging.
- Expansion of e-commerce driving demand for specialized packaging solutions.
- Increasing adoption of advanced packaging technologies for enhanced product preservation.
- Opportunities in niche segments like pharmaceutical and healthcare packaging.
Growth Accelerators in the Plastic Packaging Industry in Vietnam Industry
Strategic partnerships between domestic and international companies are driving technological advancements and market expansion. Investments in advanced manufacturing facilities and improved infrastructure are further supporting long-term growth. The increasing focus on sustainable packaging solutions is creating new opportunities for innovative companies. Government policies promoting industrial development and waste management are also critical catalysts for market expansion.
Key Players Shaping the Plastic Packaging Industry in Vietnam Market
- Hyosung Chemical
- Far Eastern New Century Corporation
- Vietnam Polystyrene Co Ltd
- Vinaplast
- Nsrp Llc
- Toray Industries Inc
- Nan Ya Plastics Corporation
- AGC Inc
- Vietnam Oil And Gas Group
- SCG Chemicals Public Company Limited
- Lyondellbasell Industries Holdings Bv
- Billion Industrial Holdings Limited
Notable Milestones in Plastic Packaging Industry in Vietnam Sector
- September 2022: Billion Industrial Holdings Limited announced the expansion of its polyester bottle chip manufacturing facility in Vietnam, adding 300,000 tons of polyethylene terephthalate resin production capacity.
- August 2022: SCG Chemicals Co. Ltd invested USD 22.7 million in the AJ Plast project to produce biaxially oriented polyethylene terephthalate (BOPET), expanding its product portfolio and meeting growing consumer demand.
In-Depth Plastic Packaging Industry in Vietnam Market Outlook
The Vietnamese plastic packaging market is poised for continued expansion, driven by sustained economic growth, increasing consumer spending, and a growing focus on sustainable packaging solutions. Strategic investments in advanced technologies, coupled with supportive government policies, will further accelerate market growth. Opportunities exist for companies offering innovative, sustainable, and cost-effective packaging solutions to cater to the evolving needs of diverse end-use industries. The long-term outlook remains positive, indicating significant potential for both domestic and international players.
Plastic Packaging Industry in Vietnam Segmentation
-
1. Type
-
1.1. Traditional Plastics
- 1.1.1. Polyethylene
- 1.1.2. Polypropylene
- 1.1.3. Polystyrene
- 1.1.4. Polyvinyl Chloride
-
1.2. Engineering Plastics
- 1.2.1. Polyurethanes
- 1.2.2. Fluoropolymers
- 1.2.3. Polyamides
- 1.2.4. Polycarbonates
- 1.2.5. Styrene Copolymers (ABS and SAN)
- 1.2.6. Thermoplastic Polyesters
- 1.2.7. Other Engineering Plastics
- 1.3. Bioplastics
-
1.1. Traditional Plastics
-
2. Technology
- 2.1. Blow Molding
- 2.2. Extrusion
- 2.3. Injection Molding
- 2.4. Other Technologies
-
3. Application
- 3.1. Packaging
- 3.2. Electrical and Electronics
- 3.3. Building and Construction
- 3.4. Automotive and Transportation
- 3.5. Housewares
- 3.6. Furniture and Bedding
- 3.7. Other Applications
Plastic Packaging Industry in Vietnam Segmentation By Geography
-
1. North America
- 1.1. United States
- 1.2. Canada
- 1.3. Mexico
-
2. South America
- 2.1. Brazil
- 2.2. Argentina
- 2.3. Rest of South America
-
3. Europe
- 3.1. United Kingdom
- 3.2. Germany
- 3.3. France
- 3.4. Italy
- 3.5. Spain
- 3.6. Russia
- 3.7. Benelux
- 3.8. Nordics
- 3.9. Rest of Europe
-
4. Middle East & Africa
- 4.1. Turkey
- 4.2. Israel
- 4.3. GCC
- 4.4. North Africa
- 4.5. South Africa
- 4.6. Rest of Middle East & Africa
-
5. Asia Pacific
- 5.1. China
- 5.2. India
- 5.3. Japan
- 5.4. South Korea
- 5.5. ASEAN
- 5.6. Oceania
- 5.7. Rest of Asia Pacific
Plastic Packaging Industry in Vietnam REPORT HIGHLIGHTS
| Aspects | Details |
|---|---|
| Study Period | 2019-2033 |
| Base Year | 2024 |
| Estimated Year | 2025 |
| Forecast Period | 2025-2033 |
| Historical Period | 2019-2024 |
| Growth Rate | CAGR of 8.44% from 2019-2033 |
| Segmentation |
|
Table of Contents
- 1. Introduction
- 1.1. Research Scope
- 1.2. Market Segmentation
- 1.3. Research Methodology
- 1.4. Definitions and Assumptions
- 2. Executive Summary
- 2.1. Introduction
- 3. Market Dynamics
- 3.1. Introduction
- 3.2. Market Drivers
- 3.2.1. Growing Demand from the Construction Sector; Other Drivers
- 3.3. Market Restrains
- 3.3.1. Over-reliance on Imports of Raw Materials and Finished Plastics; Environmental Concerns of Plastics and the Availability of New Substitutes
- 3.4. Market Trends
- 3.4.1. Extrusion Technology to Dominate the Market
- 4. Market Factor Analysis
- 4.1. Porters Five Forces
- 4.2. Supply/Value Chain
- 4.3. PESTEL analysis
- 4.4. Market Entropy
- 4.5. Patent/Trademark Analysis
- 5. Global Plastic Packaging Industry in Vietnam Analysis, Insights and Forecast, 2019-2031
- 5.1. Market Analysis, Insights and Forecast - by Type
- 5.1.1. Traditional Plastics
- 5.1.1.1. Polyethylene
- 5.1.1.2. Polypropylene
- 5.1.1.3. Polystyrene
- 5.1.1.4. Polyvinyl Chloride
- 5.1.2. Engineering Plastics
- 5.1.2.1. Polyurethanes
- 5.1.2.2. Fluoropolymers
- 5.1.2.3. Polyamides
- 5.1.2.4. Polycarbonates
- 5.1.2.5. Styrene Copolymers (ABS and SAN)
- 5.1.2.6. Thermoplastic Polyesters
- 5.1.2.7. Other Engineering Plastics
- 5.1.3. Bioplastics
- 5.1.1. Traditional Plastics
- 5.2. Market Analysis, Insights and Forecast - by Technology
- 5.2.1. Blow Molding
- 5.2.2. Extrusion
- 5.2.3. Injection Molding
- 5.2.4. Other Technologies
- 5.3. Market Analysis, Insights and Forecast - by Application
- 5.3.1. Packaging
- 5.3.2. Electrical and Electronics
- 5.3.3. Building and Construction
- 5.3.4. Automotive and Transportation
- 5.3.5. Housewares
- 5.3.6. Furniture and Bedding
- 5.3.7. Other Applications
- 5.4. Market Analysis, Insights and Forecast - by Region
- 5.4.1. North America
- 5.4.2. South America
- 5.4.3. Europe
- 5.4.4. Middle East & Africa
- 5.4.5. Asia Pacific
- 5.1. Market Analysis, Insights and Forecast - by Type
- 6. North America Plastic Packaging Industry in Vietnam Analysis, Insights and Forecast, 2019-2031
- 6.1. Market Analysis, Insights and Forecast - by Type
- 6.1.1. Traditional Plastics
- 6.1.1.1. Polyethylene
- 6.1.1.2. Polypropylene
- 6.1.1.3. Polystyrene
- 6.1.1.4. Polyvinyl Chloride
- 6.1.2. Engineering Plastics
- 6.1.2.1. Polyurethanes
- 6.1.2.2. Fluoropolymers
- 6.1.2.3. Polyamides
- 6.1.2.4. Polycarbonates
- 6.1.2.5. Styrene Copolymers (ABS and SAN)
- 6.1.2.6. Thermoplastic Polyesters
- 6.1.2.7. Other Engineering Plastics
- 6.1.3. Bioplastics
- 6.1.1. Traditional Plastics
- 6.2. Market Analysis, Insights and Forecast - by Technology
- 6.2.1. Blow Molding
- 6.2.2. Extrusion
- 6.2.3. Injection Molding
- 6.2.4. Other Technologies
- 6.3. Market Analysis, Insights and Forecast - by Application
- 6.3.1. Packaging
- 6.3.2. Electrical and Electronics
- 6.3.3. Building and Construction
- 6.3.4. Automotive and Transportation
- 6.3.5. Housewares
- 6.3.6. Furniture and Bedding
- 6.3.7. Other Applications
- 6.1. Market Analysis, Insights and Forecast - by Type
- 7. South America Plastic Packaging Industry in Vietnam Analysis, Insights and Forecast, 2019-2031
- 7.1. Market Analysis, Insights and Forecast - by Type
- 7.1.1. Traditional Plastics
- 7.1.1.1. Polyethylene
- 7.1.1.2. Polypropylene
- 7.1.1.3. Polystyrene
- 7.1.1.4. Polyvinyl Chloride
- 7.1.2. Engineering Plastics
- 7.1.2.1. Polyurethanes
- 7.1.2.2. Fluoropolymers
- 7.1.2.3. Polyamides
- 7.1.2.4. Polycarbonates
- 7.1.2.5. Styrene Copolymers (ABS and SAN)
- 7.1.2.6. Thermoplastic Polyesters
- 7.1.2.7. Other Engineering Plastics
- 7.1.3. Bioplastics
- 7.1.1. Traditional Plastics
- 7.2. Market Analysis, Insights and Forecast - by Technology
- 7.2.1. Blow Molding
- 7.2.2. Extrusion
- 7.2.3. Injection Molding
- 7.2.4. Other Technologies
- 7.3. Market Analysis, Insights and Forecast - by Application
- 7.3.1. Packaging
- 7.3.2. Electrical and Electronics
- 7.3.3. Building and Construction
- 7.3.4. Automotive and Transportation
- 7.3.5. Housewares
- 7.3.6. Furniture and Bedding
- 7.3.7. Other Applications
- 7.1. Market Analysis, Insights and Forecast - by Type
- 8. Europe Plastic Packaging Industry in Vietnam Analysis, Insights and Forecast, 2019-2031
- 8.1. Market Analysis, Insights and Forecast - by Type
- 8.1.1. Traditional Plastics
- 8.1.1.1. Polyethylene
- 8.1.1.2. Polypropylene
- 8.1.1.3. Polystyrene
- 8.1.1.4. Polyvinyl Chloride
- 8.1.2. Engineering Plastics
- 8.1.2.1. Polyurethanes
- 8.1.2.2. Fluoropolymers
- 8.1.2.3. Polyamides
- 8.1.2.4. Polycarbonates
- 8.1.2.5. Styrene Copolymers (ABS and SAN)
- 8.1.2.6. Thermoplastic Polyesters
- 8.1.2.7. Other Engineering Plastics
- 8.1.3. Bioplastics
- 8.1.1. Traditional Plastics
- 8.2. Market Analysis, Insights and Forecast - by Technology
- 8.2.1. Blow Molding
- 8.2.2. Extrusion
- 8.2.3. Injection Molding
- 8.2.4. Other Technologies
- 8.3. Market Analysis, Insights and Forecast - by Application
- 8.3.1. Packaging
- 8.3.2. Electrical and Electronics
- 8.3.3. Building and Construction
- 8.3.4. Automotive and Transportation
- 8.3.5. Housewares
- 8.3.6. Furniture and Bedding
- 8.3.7. Other Applications
- 8.1. Market Analysis, Insights and Forecast - by Type
- 9. Middle East & Africa Plastic Packaging Industry in Vietnam Analysis, Insights and Forecast, 2019-2031
- 9.1. Market Analysis, Insights and Forecast - by Type
- 9.1.1. Traditional Plastics
- 9.1.1.1. Polyethylene
- 9.1.1.2. Polypropylene
- 9.1.1.3. Polystyrene
- 9.1.1.4. Polyvinyl Chloride
- 9.1.2. Engineering Plastics
- 9.1.2.1. Polyurethanes
- 9.1.2.2. Fluoropolymers
- 9.1.2.3. Polyamides
- 9.1.2.4. Polycarbonates
- 9.1.2.5. Styrene Copolymers (ABS and SAN)
- 9.1.2.6. Thermoplastic Polyesters
- 9.1.2.7. Other Engineering Plastics
- 9.1.3. Bioplastics
- 9.1.1. Traditional Plastics
- 9.2. Market Analysis, Insights and Forecast - by Technology
- 9.2.1. Blow Molding
- 9.2.2. Extrusion
- 9.2.3. Injection Molding
- 9.2.4. Other Technologies
- 9.3. Market Analysis, Insights and Forecast - by Application
- 9.3.1. Packaging
- 9.3.2. Electrical and Electronics
- 9.3.3. Building and Construction
- 9.3.4. Automotive and Transportation
- 9.3.5. Housewares
- 9.3.6. Furniture and Bedding
- 9.3.7. Other Applications
- 9.1. Market Analysis, Insights and Forecast - by Type
- 10. Asia Pacific Plastic Packaging Industry in Vietnam Analysis, Insights and Forecast, 2019-2031
- 10.1. Market Analysis, Insights and Forecast - by Type
- 10.1.1. Traditional Plastics
- 10.1.1.1. Polyethylene
- 10.1.1.2. Polypropylene
- 10.1.1.3. Polystyrene
- 10.1.1.4. Polyvinyl Chloride
- 10.1.2. Engineering Plastics
- 10.1.2.1. Polyurethanes
- 10.1.2.2. Fluoropolymers
- 10.1.2.3. Polyamides
- 10.1.2.4. Polycarbonates
- 10.1.2.5. Styrene Copolymers (ABS and SAN)
- 10.1.2.6. Thermoplastic Polyesters
- 10.1.2.7. Other Engineering Plastics
- 10.1.3. Bioplastics
- 10.1.1. Traditional Plastics
- 10.2. Market Analysis, Insights and Forecast - by Technology
- 10.2.1. Blow Molding
- 10.2.2. Extrusion
- 10.2.3. Injection Molding
- 10.2.4. Other Technologies
- 10.3. Market Analysis, Insights and Forecast - by Application
- 10.3.1. Packaging
- 10.3.2. Electrical and Electronics
- 10.3.3. Building and Construction
- 10.3.4. Automotive and Transportation
- 10.3.5. Housewares
- 10.3.6. Furniture and Bedding
- 10.3.7. Other Applications
- 10.1. Market Analysis, Insights and Forecast - by Type
- 11. Competitive Analysis
- 11.1. Global Market Share Analysis 2024
- 11.2. Company Profiles
- 11.2.1 Hyosung Chemical
- 11.2.1.1. Overview
- 11.2.1.2. Products
- 11.2.1.3. SWOT Analysis
- 11.2.1.4. Recent Developments
- 11.2.1.5. Financials (Based on Availability)
- 11.2.2 Far Eastern New Century Corporation
- 11.2.2.1. Overview
- 11.2.2.2. Products
- 11.2.2.3. SWOT Analysis
- 11.2.2.4. Recent Developments
- 11.2.2.5. Financials (Based on Availability)
- 11.2.3 Vietnam Polystyrene Co Ltd
- 11.2.3.1. Overview
- 11.2.3.2. Products
- 11.2.3.3. SWOT Analysis
- 11.2.3.4. Recent Developments
- 11.2.3.5. Financials (Based on Availability)
- 11.2.4 Vinaplast *List Not Exhaustive
- 11.2.4.1. Overview
- 11.2.4.2. Products
- 11.2.4.3. SWOT Analysis
- 11.2.4.4. Recent Developments
- 11.2.4.5. Financials (Based on Availability)
- 11.2.5 Nsrp Llc
- 11.2.5.1. Overview
- 11.2.5.2. Products
- 11.2.5.3. SWOT Analysis
- 11.2.5.4. Recent Developments
- 11.2.5.5. Financials (Based on Availability)
- 11.2.6 Toray Industries Inc
- 11.2.6.1. Overview
- 11.2.6.2. Products
- 11.2.6.3. SWOT Analysis
- 11.2.6.4. Recent Developments
- 11.2.6.5. Financials (Based on Availability)
- 11.2.7 Nan Ya Plastics Corporation
- 11.2.7.1. Overview
- 11.2.7.2. Products
- 11.2.7.3. SWOT Analysis
- 11.2.7.4. Recent Developments
- 11.2.7.5. Financials (Based on Availability)
- 11.2.8 Agc Inc
- 11.2.8.1. Overview
- 11.2.8.2. Products
- 11.2.8.3. SWOT Analysis
- 11.2.8.4. Recent Developments
- 11.2.8.5. Financials (Based on Availability)
- 11.2.9 Vietnam Oil And Gas Group
- 11.2.9.1. Overview
- 11.2.9.2. Products
- 11.2.9.3. SWOT Analysis
- 11.2.9.4. Recent Developments
- 11.2.9.5. Financials (Based on Availability)
- 11.2.10 Scg Chemicals Public Company Limited
- 11.2.10.1. Overview
- 11.2.10.2. Products
- 11.2.10.3. SWOT Analysis
- 11.2.10.4. Recent Developments
- 11.2.10.5. Financials (Based on Availability)
- 11.2.11 Lyondellbasell Industries Holdings Bv
- 11.2.11.1. Overview
- 11.2.11.2. Products
- 11.2.11.3. SWOT Analysis
- 11.2.11.4. Recent Developments
- 11.2.11.5. Financials (Based on Availability)
- 11.2.12 Billion Industrial Holdings Limited
- 11.2.12.1. Overview
- 11.2.12.2. Products
- 11.2.12.3. SWOT Analysis
- 11.2.12.4. Recent Developments
- 11.2.12.5. Financials (Based on Availability)
- 11.2.1 Hyosung Chemical
List of Figures
- Figure 1: Global Plastic Packaging Industry in Vietnam Revenue Breakdown (Million, %) by Region 2024 & 2032
- Figure 2: Global Plastic Packaging Industry in Vietnam Volume Breakdown (Million, %) by Region 2024 & 2032
- Figure 3: Vietnam Plastic Packaging Industry in Vietnam Revenue (Million), by Country 2024 & 2032
- Figure 4: Vietnam Plastic Packaging Industry in Vietnam Volume (Million), by Country 2024 & 2032
- Figure 5: Vietnam Plastic Packaging Industry in Vietnam Revenue Share (%), by Country 2024 & 2032
- Figure 6: Vietnam Plastic Packaging Industry in Vietnam Volume Share (%), by Country 2024 & 2032
- Figure 7: North America Plastic Packaging Industry in Vietnam Revenue (Million), by Type 2024 & 2032
- Figure 8: North America Plastic Packaging Industry in Vietnam Volume (Million), by Type 2024 & 2032
- Figure 9: North America Plastic Packaging Industry in Vietnam Revenue Share (%), by Type 2024 & 2032
- Figure 10: North America Plastic Packaging Industry in Vietnam Volume Share (%), by Type 2024 & 2032
- Figure 11: North America Plastic Packaging Industry in Vietnam Revenue (Million), by Technology 2024 & 2032
- Figure 12: North America Plastic Packaging Industry in Vietnam Volume (Million), by Technology 2024 & 2032
- Figure 13: North America Plastic Packaging Industry in Vietnam Revenue Share (%), by Technology 2024 & 2032
- Figure 14: North America Plastic Packaging Industry in Vietnam Volume Share (%), by Technology 2024 & 2032
- Figure 15: North America Plastic Packaging Industry in Vietnam Revenue (Million), by Application 2024 & 2032
- Figure 16: North America Plastic Packaging Industry in Vietnam Volume (Million), by Application 2024 & 2032
- Figure 17: North America Plastic Packaging Industry in Vietnam Revenue Share (%), by Application 2024 & 2032
- Figure 18: North America Plastic Packaging Industry in Vietnam Volume Share (%), by Application 2024 & 2032
- Figure 19: North America Plastic Packaging Industry in Vietnam Revenue (Million), by Country 2024 & 2032
- Figure 20: North America Plastic Packaging Industry in Vietnam Volume (Million), by Country 2024 & 2032
- Figure 21: North America Plastic Packaging Industry in Vietnam Revenue Share (%), by Country 2024 & 2032
- Figure 22: North America Plastic Packaging Industry in Vietnam Volume Share (%), by Country 2024 & 2032
- Figure 23: South America Plastic Packaging Industry in Vietnam Revenue (Million), by Type 2024 & 2032
- Figure 24: South America Plastic Packaging Industry in Vietnam Volume (Million), by Type 2024 & 2032
- Figure 25: South America Plastic Packaging Industry in Vietnam Revenue Share (%), by Type 2024 & 2032
- Figure 26: South America Plastic Packaging Industry in Vietnam Volume Share (%), by Type 2024 & 2032
- Figure 27: South America Plastic Packaging Industry in Vietnam Revenue (Million), by Technology 2024 & 2032
- Figure 28: South America Plastic Packaging Industry in Vietnam Volume (Million), by Technology 2024 & 2032
- Figure 29: South America Plastic Packaging Industry in Vietnam Revenue Share (%), by Technology 2024 & 2032
- Figure 30: South America Plastic Packaging Industry in Vietnam Volume Share (%), by Technology 2024 & 2032
- Figure 31: South America Plastic Packaging Industry in Vietnam Revenue (Million), by Application 2024 & 2032
- Figure 32: South America Plastic Packaging Industry in Vietnam Volume (Million), by Application 2024 & 2032
- Figure 33: South America Plastic Packaging Industry in Vietnam Revenue Share (%), by Application 2024 & 2032
- Figure 34: South America Plastic Packaging Industry in Vietnam Volume Share (%), by Application 2024 & 2032
- Figure 35: South America Plastic Packaging Industry in Vietnam Revenue (Million), by Country 2024 & 2032
- Figure 36: South America Plastic Packaging Industry in Vietnam Volume (Million), by Country 2024 & 2032
- Figure 37: South America Plastic Packaging Industry in Vietnam Revenue Share (%), by Country 2024 & 2032
- Figure 38: South America Plastic Packaging Industry in Vietnam Volume Share (%), by Country 2024 & 2032
- Figure 39: Europe Plastic Packaging Industry in Vietnam Revenue (Million), by Type 2024 & 2032
- Figure 40: Europe Plastic Packaging Industry in Vietnam Volume (Million), by Type 2024 & 2032
- Figure 41: Europe Plastic Packaging Industry in Vietnam Revenue Share (%), by Type 2024 & 2032
- Figure 42: Europe Plastic Packaging Industry in Vietnam Volume Share (%), by Type 2024 & 2032
- Figure 43: Europe Plastic Packaging Industry in Vietnam Revenue (Million), by Technology 2024 & 2032
- Figure 44: Europe Plastic Packaging Industry in Vietnam Volume (Million), by Technology 2024 & 2032
- Figure 45: Europe Plastic Packaging Industry in Vietnam Revenue Share (%), by Technology 2024 & 2032
- Figure 46: Europe Plastic Packaging Industry in Vietnam Volume Share (%), by Technology 2024 & 2032
- Figure 47: Europe Plastic Packaging Industry in Vietnam Revenue (Million), by Application 2024 & 2032
- Figure 48: Europe Plastic Packaging Industry in Vietnam Volume (Million), by Application 2024 & 2032
- Figure 49: Europe Plastic Packaging Industry in Vietnam Revenue Share (%), by Application 2024 & 2032
- Figure 50: Europe Plastic Packaging Industry in Vietnam Volume Share (%), by Application 2024 & 2032
- Figure 51: Europe Plastic Packaging Industry in Vietnam Revenue (Million), by Country 2024 & 2032
- Figure 52: Europe Plastic Packaging Industry in Vietnam Volume (Million), by Country 2024 & 2032
- Figure 53: Europe Plastic Packaging Industry in Vietnam Revenue Share (%), by Country 2024 & 2032
- Figure 54: Europe Plastic Packaging Industry in Vietnam Volume Share (%), by Country 2024 & 2032
- Figure 55: Middle East & Africa Plastic Packaging Industry in Vietnam Revenue (Million), by Type 2024 & 2032
- Figure 56: Middle East & Africa Plastic Packaging Industry in Vietnam Volume (Million), by Type 2024 & 2032
- Figure 57: Middle East & Africa Plastic Packaging Industry in Vietnam Revenue Share (%), by Type 2024 & 2032
- Figure 58: Middle East & Africa Plastic Packaging Industry in Vietnam Volume Share (%), by Type 2024 & 2032
- Figure 59: Middle East & Africa Plastic Packaging Industry in Vietnam Revenue (Million), by Technology 2024 & 2032
- Figure 60: Middle East & Africa Plastic Packaging Industry in Vietnam Volume (Million), by Technology 2024 & 2032
- Figure 61: Middle East & Africa Plastic Packaging Industry in Vietnam Revenue Share (%), by Technology 2024 & 2032
- Figure 62: Middle East & Africa Plastic Packaging Industry in Vietnam Volume Share (%), by Technology 2024 & 2032
- Figure 63: Middle East & Africa Plastic Packaging Industry in Vietnam Revenue (Million), by Application 2024 & 2032
- Figure 64: Middle East & Africa Plastic Packaging Industry in Vietnam Volume (Million), by Application 2024 & 2032
- Figure 65: Middle East & Africa Plastic Packaging Industry in Vietnam Revenue Share (%), by Application 2024 & 2032
- Figure 66: Middle East & Africa Plastic Packaging Industry in Vietnam Volume Share (%), by Application 2024 & 2032
- Figure 67: Middle East & Africa Plastic Packaging Industry in Vietnam Revenue (Million), by Country 2024 & 2032
- Figure 68: Middle East & Africa Plastic Packaging Industry in Vietnam Volume (Million), by Country 2024 & 2032
- Figure 69: Middle East & Africa Plastic Packaging Industry in Vietnam Revenue Share (%), by Country 2024 & 2032
- Figure 70: Middle East & Africa Plastic Packaging Industry in Vietnam Volume Share (%), by Country 2024 & 2032
- Figure 71: Asia Pacific Plastic Packaging Industry in Vietnam Revenue (Million), by Type 2024 & 2032
- Figure 72: Asia Pacific Plastic Packaging Industry in Vietnam Volume (Million), by Type 2024 & 2032
- Figure 73: Asia Pacific Plastic Packaging Industry in Vietnam Revenue Share (%), by Type 2024 & 2032
- Figure 74: Asia Pacific Plastic Packaging Industry in Vietnam Volume Share (%), by Type 2024 & 2032
- Figure 75: Asia Pacific Plastic Packaging Industry in Vietnam Revenue (Million), by Technology 2024 & 2032
- Figure 76: Asia Pacific Plastic Packaging Industry in Vietnam Volume (Million), by Technology 2024 & 2032
- Figure 77: Asia Pacific Plastic Packaging Industry in Vietnam Revenue Share (%), by Technology 2024 & 2032
- Figure 78: Asia Pacific Plastic Packaging Industry in Vietnam Volume Share (%), by Technology 2024 & 2032
- Figure 79: Asia Pacific Plastic Packaging Industry in Vietnam Revenue (Million), by Application 2024 & 2032
- Figure 80: Asia Pacific Plastic Packaging Industry in Vietnam Volume (Million), by Application 2024 & 2032
- Figure 81: Asia Pacific Plastic Packaging Industry in Vietnam Revenue Share (%), by Application 2024 & 2032
- Figure 82: Asia Pacific Plastic Packaging Industry in Vietnam Volume Share (%), by Application 2024 & 2032
- Figure 83: Asia Pacific Plastic Packaging Industry in Vietnam Revenue (Million), by Country 2024 & 2032
- Figure 84: Asia Pacific Plastic Packaging Industry in Vietnam Volume (Million), by Country 2024 & 2032
- Figure 85: Asia Pacific Plastic Packaging Industry in Vietnam Revenue Share (%), by Country 2024 & 2032
- Figure 86: Asia Pacific Plastic Packaging Industry in Vietnam Volume Share (%), by Country 2024 & 2032
List of Tables
- Table 1: Global Plastic Packaging Industry in Vietnam Revenue Million Forecast, by Region 2019 & 2032
- Table 2: Global Plastic Packaging Industry in Vietnam Volume Million Forecast, by Region 2019 & 2032
- Table 3: Global Plastic Packaging Industry in Vietnam Revenue Million Forecast, by Type 2019 & 2032
- Table 4: Global Plastic Packaging Industry in Vietnam Volume Million Forecast, by Type 2019 & 2032
- Table 5: Global Plastic Packaging Industry in Vietnam Revenue Million Forecast, by Technology 2019 & 2032
- Table 6: Global Plastic Packaging Industry in Vietnam Volume Million Forecast, by Technology 2019 & 2032
- Table 7: Global Plastic Packaging Industry in Vietnam Revenue Million Forecast, by Application 2019 & 2032
- Table 8: Global Plastic Packaging Industry in Vietnam Volume Million Forecast, by Application 2019 & 2032
- Table 9: Global Plastic Packaging Industry in Vietnam Revenue Million Forecast, by Region 2019 & 2032
- Table 10: Global Plastic Packaging Industry in Vietnam Volume Million Forecast, by Region 2019 & 2032
- Table 11: Global Plastic Packaging Industry in Vietnam Revenue Million Forecast, by Country 2019 & 2032
- Table 12: Global Plastic Packaging Industry in Vietnam Volume Million Forecast, by Country 2019 & 2032
- Table 13: Global Plastic Packaging Industry in Vietnam Revenue Million Forecast, by Type 2019 & 2032
- Table 14: Global Plastic Packaging Industry in Vietnam Volume Million Forecast, by Type 2019 & 2032
- Table 15: Global Plastic Packaging Industry in Vietnam Revenue Million Forecast, by Technology 2019 & 2032
- Table 16: Global Plastic Packaging Industry in Vietnam Volume Million Forecast, by Technology 2019 & 2032
- Table 17: Global Plastic Packaging Industry in Vietnam Revenue Million Forecast, by Application 2019 & 2032
- Table 18: Global Plastic Packaging Industry in Vietnam Volume Million Forecast, by Application 2019 & 2032
- Table 19: Global Plastic Packaging Industry in Vietnam Revenue Million Forecast, by Country 2019 & 2032
- Table 20: Global Plastic Packaging Industry in Vietnam Volume Million Forecast, by Country 2019 & 2032
- Table 21: United States Plastic Packaging Industry in Vietnam Revenue (Million) Forecast, by Application 2019 & 2032
- Table 22: United States Plastic Packaging Industry in Vietnam Volume (Million) Forecast, by Application 2019 & 2032
- Table 23: Canada Plastic Packaging Industry in Vietnam Revenue (Million) Forecast, by Application 2019 & 2032
- Table 24: Canada Plastic Packaging Industry in Vietnam Volume (Million) Forecast, by Application 2019 & 2032
- Table 25: Mexico Plastic Packaging Industry in Vietnam Revenue (Million) Forecast, by Application 2019 & 2032
- Table 26: Mexico Plastic Packaging Industry in Vietnam Volume (Million) Forecast, by Application 2019 & 2032
- Table 27: Global Plastic Packaging Industry in Vietnam Revenue Million Forecast, by Type 2019 & 2032
- Table 28: Global Plastic Packaging Industry in Vietnam Volume Million Forecast, by Type 2019 & 2032
- Table 29: Global Plastic Packaging Industry in Vietnam Revenue Million Forecast, by Technology 2019 & 2032
- Table 30: Global Plastic Packaging Industry in Vietnam Volume Million Forecast, by Technology 2019 & 2032
- Table 31: Global Plastic Packaging Industry in Vietnam Revenue Million Forecast, by Application 2019 & 2032
- Table 32: Global Plastic Packaging Industry in Vietnam Volume Million Forecast, by Application 2019 & 2032
- Table 33: Global Plastic Packaging Industry in Vietnam Revenue Million Forecast, by Country 2019 & 2032
- Table 34: Global Plastic Packaging Industry in Vietnam Volume Million Forecast, by Country 2019 & 2032
- Table 35: Brazil Plastic Packaging Industry in Vietnam Revenue (Million) Forecast, by Application 2019 & 2032
- Table 36: Brazil Plastic Packaging Industry in Vietnam Volume (Million) Forecast, by Application 2019 & 2032
- Table 37: Argentina Plastic Packaging Industry in Vietnam Revenue (Million) Forecast, by Application 2019 & 2032
- Table 38: Argentina Plastic Packaging Industry in Vietnam Volume (Million) Forecast, by Application 2019 & 2032
- Table 39: Rest of South America Plastic Packaging Industry in Vietnam Revenue (Million) Forecast, by Application 2019 & 2032
- Table 40: Rest of South America Plastic Packaging Industry in Vietnam Volume (Million) Forecast, by Application 2019 & 2032
- Table 41: Global Plastic Packaging Industry in Vietnam Revenue Million Forecast, by Type 2019 & 2032
- Table 42: Global Plastic Packaging Industry in Vietnam Volume Million Forecast, by Type 2019 & 2032
- Table 43: Global Plastic Packaging Industry in Vietnam Revenue Million Forecast, by Technology 2019 & 2032
- Table 44: Global Plastic Packaging Industry in Vietnam Volume Million Forecast, by Technology 2019 & 2032
- Table 45: Global Plastic Packaging Industry in Vietnam Revenue Million Forecast, by Application 2019 & 2032
- Table 46: Global Plastic Packaging Industry in Vietnam Volume Million Forecast, by Application 2019 & 2032
- Table 47: Global Plastic Packaging Industry in Vietnam Revenue Million Forecast, by Country 2019 & 2032
- Table 48: Global Plastic Packaging Industry in Vietnam Volume Million Forecast, by Country 2019 & 2032
- Table 49: United Kingdom Plastic Packaging Industry in Vietnam Revenue (Million) Forecast, by Application 2019 & 2032
- Table 50: United Kingdom Plastic Packaging Industry in Vietnam Volume (Million) Forecast, by Application 2019 & 2032
- Table 51: Germany Plastic Packaging Industry in Vietnam Revenue (Million) Forecast, by Application 2019 & 2032
- Table 52: Germany Plastic Packaging Industry in Vietnam Volume (Million) Forecast, by Application 2019 & 2032
- Table 53: France Plastic Packaging Industry in Vietnam Revenue (Million) Forecast, by Application 2019 & 2032
- Table 54: France Plastic Packaging Industry in Vietnam Volume (Million) Forecast, by Application 2019 & 2032
- Table 55: Italy Plastic Packaging Industry in Vietnam Revenue (Million) Forecast, by Application 2019 & 2032
- Table 56: Italy Plastic Packaging Industry in Vietnam Volume (Million) Forecast, by Application 2019 & 2032
- Table 57: Spain Plastic Packaging Industry in Vietnam Revenue (Million) Forecast, by Application 2019 & 2032
- Table 58: Spain Plastic Packaging Industry in Vietnam Volume (Million) Forecast, by Application 2019 & 2032
- Table 59: Russia Plastic Packaging Industry in Vietnam Revenue (Million) Forecast, by Application 2019 & 2032
- Table 60: Russia Plastic Packaging Industry in Vietnam Volume (Million) Forecast, by Application 2019 & 2032
- Table 61: Benelux Plastic Packaging Industry in Vietnam Revenue (Million) Forecast, by Application 2019 & 2032
- Table 62: Benelux Plastic Packaging Industry in Vietnam Volume (Million) Forecast, by Application 2019 & 2032
- Table 63: Nordics Plastic Packaging Industry in Vietnam Revenue (Million) Forecast, by Application 2019 & 2032
- Table 64: Nordics Plastic Packaging Industry in Vietnam Volume (Million) Forecast, by Application 2019 & 2032
- Table 65: Rest of Europe Plastic Packaging Industry in Vietnam Revenue (Million) Forecast, by Application 2019 & 2032
- Table 66: Rest of Europe Plastic Packaging Industry in Vietnam Volume (Million) Forecast, by Application 2019 & 2032
- Table 67: Global Plastic Packaging Industry in Vietnam Revenue Million Forecast, by Type 2019 & 2032
- Table 68: Global Plastic Packaging Industry in Vietnam Volume Million Forecast, by Type 2019 & 2032
- Table 69: Global Plastic Packaging Industry in Vietnam Revenue Million Forecast, by Technology 2019 & 2032
- Table 70: Global Plastic Packaging Industry in Vietnam Volume Million Forecast, by Technology 2019 & 2032
- Table 71: Global Plastic Packaging Industry in Vietnam Revenue Million Forecast, by Application 2019 & 2032
- Table 72: Global Plastic Packaging Industry in Vietnam Volume Million Forecast, by Application 2019 & 2032
- Table 73: Global Plastic Packaging Industry in Vietnam Revenue Million Forecast, by Country 2019 & 2032
- Table 74: Global Plastic Packaging Industry in Vietnam Volume Million Forecast, by Country 2019 & 2032
- Table 75: Turkey Plastic Packaging Industry in Vietnam Revenue (Million) Forecast, by Application 2019 & 2032
- Table 76: Turkey Plastic Packaging Industry in Vietnam Volume (Million) Forecast, by Application 2019 & 2032
- Table 77: Israel Plastic Packaging Industry in Vietnam Revenue (Million) Forecast, by Application 2019 & 2032
- Table 78: Israel Plastic Packaging Industry in Vietnam Volume (Million) Forecast, by Application 2019 & 2032
- Table 79: GCC Plastic Packaging Industry in Vietnam Revenue (Million) Forecast, by Application 2019 & 2032
- Table 80: GCC Plastic Packaging Industry in Vietnam Volume (Million) Forecast, by Application 2019 & 2032
- Table 81: North Africa Plastic Packaging Industry in Vietnam Revenue (Million) Forecast, by Application 2019 & 2032
- Table 82: North Africa Plastic Packaging Industry in Vietnam Volume (Million) Forecast, by Application 2019 & 2032
- Table 83: South Africa Plastic Packaging Industry in Vietnam Revenue (Million) Forecast, by Application 2019 & 2032
- Table 84: South Africa Plastic Packaging Industry in Vietnam Volume (Million) Forecast, by Application 2019 & 2032
- Table 85: Rest of Middle East & Africa Plastic Packaging Industry in Vietnam Revenue (Million) Forecast, by Application 2019 & 2032
- Table 86: Rest of Middle East & Africa Plastic Packaging Industry in Vietnam Volume (Million) Forecast, by Application 2019 & 2032
- Table 87: Global Plastic Packaging Industry in Vietnam Revenue Million Forecast, by Type 2019 & 2032
- Table 88: Global Plastic Packaging Industry in Vietnam Volume Million Forecast, by Type 2019 & 2032
- Table 89: Global Plastic Packaging Industry in Vietnam Revenue Million Forecast, by Technology 2019 & 2032
- Table 90: Global Plastic Packaging Industry in Vietnam Volume Million Forecast, by Technology 2019 & 2032
- Table 91: Global Plastic Packaging Industry in Vietnam Revenue Million Forecast, by Application 2019 & 2032
- Table 92: Global Plastic Packaging Industry in Vietnam Volume Million Forecast, by Application 2019 & 2032
- Table 93: Global Plastic Packaging Industry in Vietnam Revenue Million Forecast, by Country 2019 & 2032
- Table 94: Global Plastic Packaging Industry in Vietnam Volume Million Forecast, by Country 2019 & 2032
- Table 95: China Plastic Packaging Industry in Vietnam Revenue (Million) Forecast, by Application 2019 & 2032
- Table 96: China Plastic Packaging Industry in Vietnam Volume (Million) Forecast, by Application 2019 & 2032
- Table 97: India Plastic Packaging Industry in Vietnam Revenue (Million) Forecast, by Application 2019 & 2032
- Table 98: India Plastic Packaging Industry in Vietnam Volume (Million) Forecast, by Application 2019 & 2032
- Table 99: Japan Plastic Packaging Industry in Vietnam Revenue (Million) Forecast, by Application 2019 & 2032
- Table 100: Japan Plastic Packaging Industry in Vietnam Volume (Million) Forecast, by Application 2019 & 2032
- Table 101: South Korea Plastic Packaging Industry in Vietnam Revenue (Million) Forecast, by Application 2019 & 2032
- Table 102: South Korea Plastic Packaging Industry in Vietnam Volume (Million) Forecast, by Application 2019 & 2032
- Table 103: ASEAN Plastic Packaging Industry in Vietnam Revenue (Million) Forecast, by Application 2019 & 2032
- Table 104: ASEAN Plastic Packaging Industry in Vietnam Volume (Million) Forecast, by Application 2019 & 2032
- Table 105: Oceania Plastic Packaging Industry in Vietnam Revenue (Million) Forecast, by Application 2019 & 2032
- Table 106: Oceania Plastic Packaging Industry in Vietnam Volume (Million) Forecast, by Application 2019 & 2032
- Table 107: Rest of Asia Pacific Plastic Packaging Industry in Vietnam Revenue (Million) Forecast, by Application 2019 & 2032
- Table 108: Rest of Asia Pacific Plastic Packaging Industry in Vietnam Volume (Million) Forecast, by Application 2019 & 2032
Frequently Asked Questions
1. What is the projected Compound Annual Growth Rate (CAGR) of the Plastic Packaging Industry in Vietnam?
The projected CAGR is approximately 8.44%.
2. Which companies are prominent players in the Plastic Packaging Industry in Vietnam?
Key companies in the market include Hyosung Chemical, Far Eastern New Century Corporation, Vietnam Polystyrene Co Ltd, Vinaplast *List Not Exhaustive, Nsrp Llc, Toray Industries Inc, Nan Ya Plastics Corporation, Agc Inc, Vietnam Oil And Gas Group, Scg Chemicals Public Company Limited, Lyondellbasell Industries Holdings Bv, Billion Industrial Holdings Limited.
3. What are the main segments of the Plastic Packaging Industry in Vietnam?
The market segments include Type, Technology, Application.
4. Can you provide details about the market size?
The market size is estimated to be USD 10.07 Million as of 2022.
5. What are some drivers contributing to market growth?
Growing Demand from the Construction Sector; Other Drivers.
6. What are the notable trends driving market growth?
Extrusion Technology to Dominate the Market.
7. Are there any restraints impacting market growth?
Over-reliance on Imports of Raw Materials and Finished Plastics; Environmental Concerns of Plastics and the Availability of New Substitutes.
8. Can you provide examples of recent developments in the market?
In September 2022, Billion Industrial Holdings Limited announced the expansion of the manufacturing facilities for polyester bottle chips in Vietnam. This manufacturing facility will have a production capacity of 300,000 tons of polyethylene terephthalate resin.
9. What pricing options are available for accessing the report?
Pricing options include single-user, multi-user, and enterprise licenses priced at USD 3800, USD 4500, and USD 5800 respectively.
10. Is the market size provided in terms of value or volume?
The market size is provided in terms of value, measured in Million and volume, measured in Million.
11. Are there any specific market keywords associated with the report?
Yes, the market keyword associated with the report is "Plastic Packaging Industry in Vietnam," which aids in identifying and referencing the specific market segment covered.
12. How do I determine which pricing option suits my needs best?
The pricing options vary based on user requirements and access needs. Individual users may opt for single-user licenses, while businesses requiring broader access may choose multi-user or enterprise licenses for cost-effective access to the report.
13. Are there any additional resources or data provided in the Plastic Packaging Industry in Vietnam report?
While the report offers comprehensive insights, it's advisable to review the specific contents or supplementary materials provided to ascertain if additional resources or data are available.
14. How can I stay updated on further developments or reports in the Plastic Packaging Industry in Vietnam?
To stay informed about further developments, trends, and reports in the Plastic Packaging Industry in Vietnam, consider subscribing to industry newsletters, following relevant companies and organizations, or regularly checking reputable industry news sources and publications.
Methodology
Step 1 - Identification of Relevant Samples Size from Population Database


Step 2 - Approaches for Defining Global Market Size (Value, Volume* & Price*)

Note*: In applicable scenarios
Step 3 - Data Sources
Primary Research
- Web Analytics
- Survey Reports
- Research Institute
- Latest Research Reports
- Opinion Leaders
Secondary Research
- Annual Reports
- White Paper
- Latest Press Release
- Industry Association
- Paid Database
- Investor Presentations

Step 4 - Data Triangulation
Involves using different sources of information in order to increase the validity of a study
These sources are likely to be stakeholders in a program - participants, other researchers, program staff, other community members, and so on.
Then we put all data in single framework & apply various statistical tools to find out the dynamic on the market.
During the analysis stage, feedback from the stakeholder groups would be compared to determine areas of agreement as well as areas of divergence


