
Key Insights
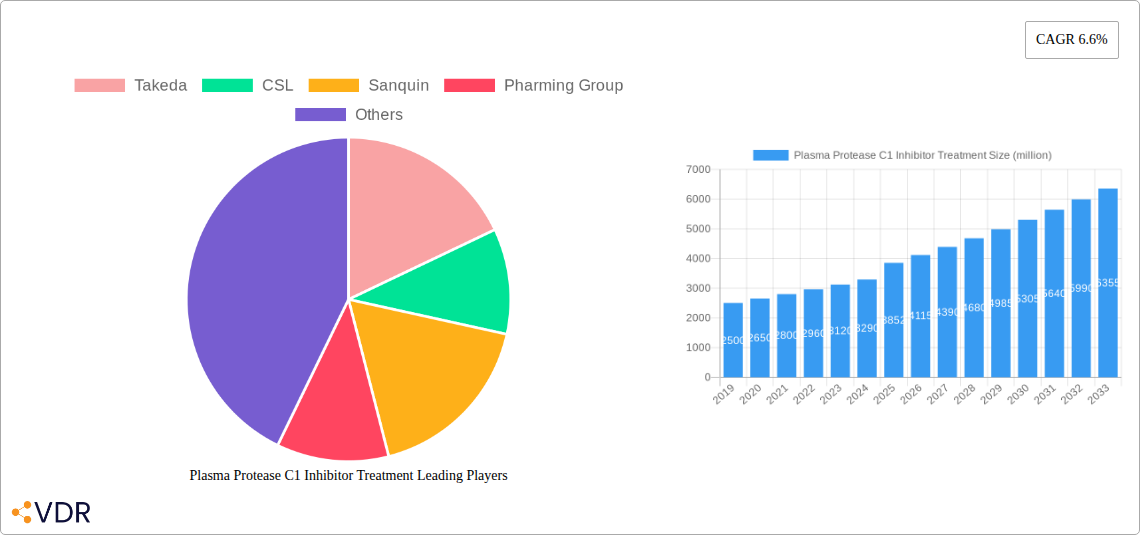
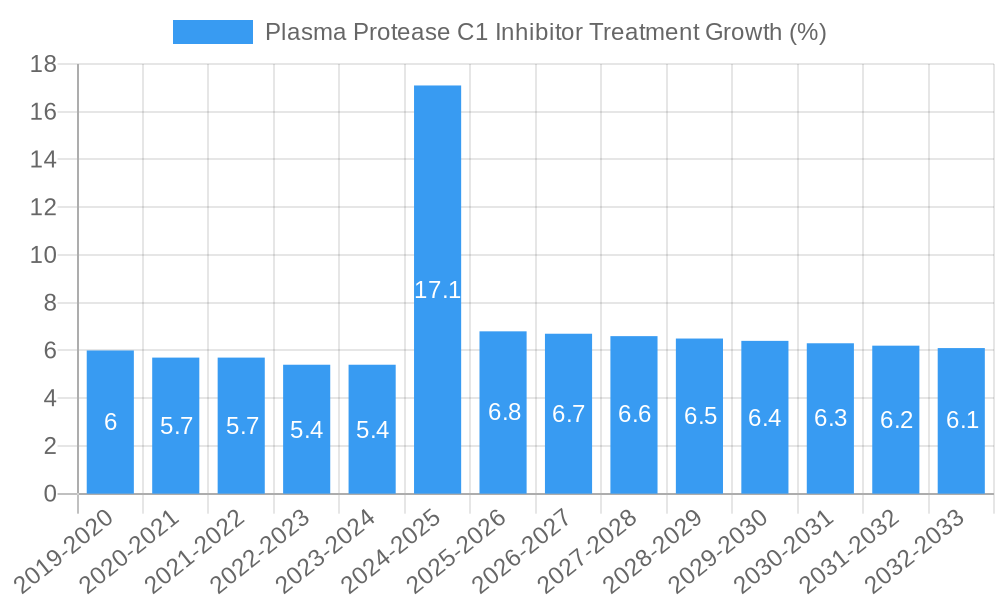
The global Plasma Protease C1 Inhibitor Treatment market is poised for significant expansion, projected to reach a substantial market size of $3,852 million by the base year of 2025. This growth is underpinned by a healthy Compound Annual Growth Rate (CAGR) of 6.6% throughout the forecast period of 2025-2033. This robust expansion is primarily driven by increasing awareness and diagnosis of hereditary angioedema (HAE) and other rare complement-mediated disorders where C1 inhibitor deficiency is a critical factor. Advancements in therapeutic development, including the introduction of novel C1-inhibitor concentrates and the emerging class of kallikrein inhibitors, are directly contributing to this market's momentum. Furthermore, improved healthcare infrastructure and expanded access to specialized treatment centers globally are facilitating greater patient reach and treatment adoption. The market's dynamic nature is also shaped by a growing emphasis on preventative and prophylactic treatment strategies, particularly for individuals with severe or frequent HAE attacks.
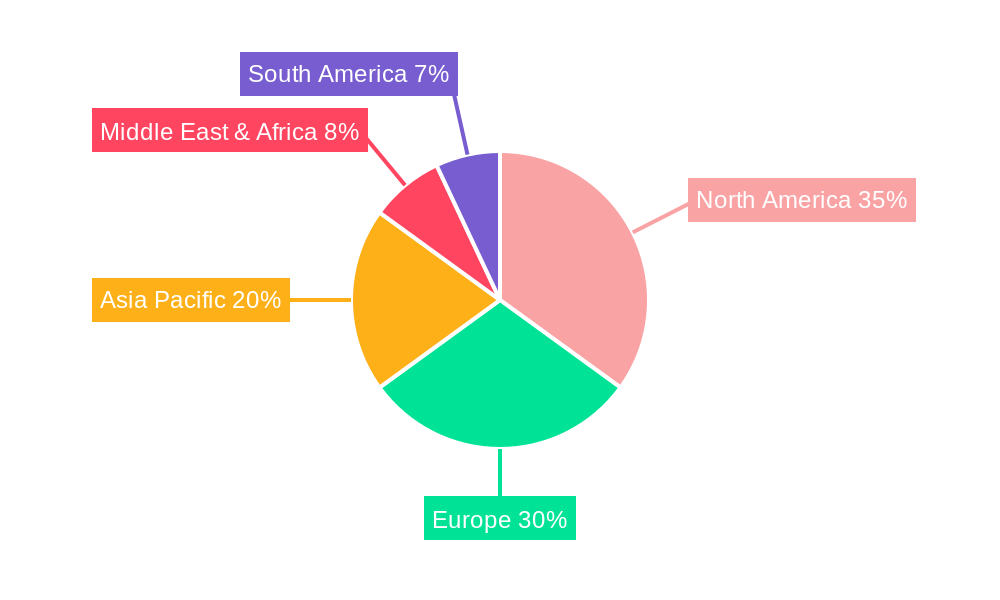
The market segmentation reveals key areas of focus. In terms of type, C1-inhibitors are expected to maintain a dominant share due to established efficacy and widespread clinical use. However, Kallikrein inhibitors (like Kalbitor) are anticipated to witness rapid growth, driven by their targeted mechanism of action and potential to offer alternative or adjunctive treatment options for specific patient profiles. Distribution channels are largely dominated by hospital pharmacies, reflecting the complexity of treatment and the need for specialized medical supervision. Independent pharmacies and outlets are also contributing to market accessibility. Geographically, North America and Europe are expected to remain leading regions, owing to advanced healthcare systems, higher disposable incomes, and well-established diagnostic pathways. The Asia Pacific region, particularly China and India, presents a significant opportunity for growth, fueled by an expanding patient pool, increasing healthcare expenditure, and a burgeoning pharmaceutical industry. Major players like Takeda, CSL, Sanquin, and Pharming Group are actively investing in research and development, strategic partnerships, and market expansion to capitalize on these growth opportunities.
Report Description: Plasma Protease C1 Inhibitor Treatment Market: Dynamics, Trends, and Future Outlook (2019–2033)
This comprehensive report offers an in-depth analysis of the global Plasma Protease C1 Inhibitor Treatment market, a critical segment within the broader rare disease therapeutics landscape. Focusing on C1-inhibitors and the emerging Kallikrein Inhibitor (Kalbitor) type, this study meticulously examines market dynamics, growth trends, regional dominance, and the competitive environment from 2019 to 2033. With a base year of 2025, the report provides crucial insights into the market's current state and forecasts its trajectory through 2033. This research is essential for pharmaceutical companies, biotechnology firms, investors, and healthcare providers seeking to understand the opportunities and challenges within this high-value therapeutic area.
Plasma Protease C1 Inhibitor Treatment Market Dynamics & Structure
The Plasma Protease C1 Inhibitor Treatment market is characterized by a moderately concentrated structure, with a few key players holding significant market share. Technological innovation remains a primary driver, particularly in the development of more effective and convenient administration methods for C1-inhibitors, and the introduction of novel kallikrein inhibitors. Regulatory frameworks, while stringent, are evolving to accommodate orphan drug designations and expedited review processes, fostering market entry and innovation. Competitive product substitutes are limited, primarily revolving around symptomatic treatments or other enzyme replacement therapies for specific indications like Hereditary Angioedema (HAE). End-user demographics are largely defined by patients with rare genetic disorders, necessitating specialized treatment approaches. Mergers and acquisitions (M&A) activity has been observed as companies seek to expand their portfolios in rare diseases and leverage synergistic research and development capabilities.
- Market Concentration: Dominated by a few key players, indicating a mature yet dynamic competitive landscape.
- Technological Innovation: Focus on improved drug delivery, longer half-life formulations, and novel therapeutic mechanisms.
- Regulatory Frameworks: Orphan drug incentives and accelerated approval pathways are crucial for market growth.
- Competitive Landscape: Primarily limited to direct C1-inhibitor replacements and alternative HAE management strategies.
- End-User Demographics: Predominantly patients with Hereditary Angioedema (HAE) and other rare complement-mediated disorders.
- M&A Trends: Strategic acquisitions to consolidate market position and acquire innovative pipeline assets.
Plasma Protease C1 Inhibitor Treatment Growth Trends & Insights
The global Plasma Protease C1 Inhibitor Treatment market has witnessed substantial growth over the historical period (2019-2024), with the base year of 2025 estimated to represent a market value of approximately $X,XXX million units. This expansion is propelled by an increasing prevalence of diagnosed rare diseases, particularly Hereditary Angioedema (HAE), coupled with a growing awareness and improved diagnostic capabilities among healthcare professionals and patients. The forecast period (2025–2033) is projected to exhibit a robust Compound Annual Growth Rate (CAGR) of approximately X.X%, driven by advancements in therapeutic efficacy, patient convenience, and broader market penetration in both developed and emerging economies. Adoption rates for plasma-derived and recombinant C1-inhibitors have steadily increased, transitioning from emergency treatments to prophylactic strategies, thereby enhancing patient quality of life and reducing healthcare burdens. Technological disruptions, such as the development of oral kallikrein inhibitors like Kalbitor (ecallantide), are poised to significantly alter treatment paradigms, offering non-injectable alternatives and potentially expanding the patient pool. Consumer behavior shifts are also influencing the market, with patients actively seeking more proactive and less invasive treatment options, and a greater emphasis on personalized medicine approaches. The increasing investment in rare disease research and development by major pharmaceutical entities further fuels innovation and market expansion. The estimated market size for 2025 is projected to reach $X,XXX million units, with a forecast of $XX,XXX million units by 2033. The overall market penetration, currently estimated at XX% for diagnosed HAE patients, is expected to rise significantly as new therapies become available and diagnostic rates improve globally.
Dominant Regions, Countries, or Segments in Plasma Protease C1 Inhibitor Treatment
Within the Plasma Protease C1 Inhibitor Treatment market, Hospital Pharmacies represent the dominant application segment, accounting for an estimated XX% of market share in 2025. This dominance stems from the critical need for immediate and in-hospital administration of C1-inhibitors for acute angioedema attacks, as well as the centralized procurement and dispensing of these high-value, often life-saving medications. The ability of hospital pharmacies to manage complex dosing regimens, maintain cold chain integrity for plasma-derived products, and coordinate care with specialized HAE centers underpins their leading role.
Regionally, North America is projected to remain the leading market, estimated at $X,XXX million units in 2025, with a forecasted growth to $XX,XXX million units by 2033. This leadership is attributed to several key drivers:
- Advanced Healthcare Infrastructure: A well-established healthcare system with high diagnostic rates for rare diseases and widespread access to specialized treatment centers.
- Favorable Reimbursement Policies: Robust insurance coverage and government support for orphan drugs, facilitating patient access to expensive C1-inhibitor treatments.
- Strong R&D Ecosystem: A high concentration of leading pharmaceutical companies and research institutions dedicated to rare disease therapeutics, fostering innovation and product development.
- High Patient Awareness and Advocacy: Active patient advocacy groups in North America play a crucial role in raising awareness, driving research, and advocating for improved patient access and care.
The C1-inhibitors type segment continues to be the largest by market share, estimated at XX% in 2025, comprising both plasma-derived and recombinant therapies. However, the Kallikrein Inhibitor (Kalbitor) segment is experiencing rapid growth, projected to grow at a CAGR of XX.X% from 2025 to 2033, driven by its therapeutic advantages and increasing adoption for HAE management.
Plasma Protease C1 Inhibitor Treatment Product Landscape
The Plasma Protease C1 Inhibitor Treatment product landscape is defined by innovative advancements aimed at improving therapeutic efficacy and patient convenience. Key products include established plasma-derived C1-inhibitors and newer recombinant alternatives offering consistent supply and purity. The introduction of novel orally administered kallikrein inhibitors, such as Kalbitor, represents a significant technological advancement, providing a non-invasive treatment option that enhances patient adherence and quality of life. These innovations address unmet needs in managing acute attacks and prophylaxis for conditions like Hereditary Angioedema.
Key Drivers, Barriers & Challenges in Plasma Protease C1 Inhibitor Treatment
Key Drivers:
- Increasing prevalence of Hereditary Angioedema (HAE): Rising diagnosis rates and improved understanding of HAE pathogenesis.
- Technological advancements: Development of recombinant C1-inhibitors and oral kallikrein inhibitors offering better efficacy and convenience.
- Growing awareness and diagnosis rates: Enhanced diagnostic tools and patient advocacy leading to earlier detection.
- Supportive regulatory environments: Orphan drug designations and expedited approval pathways for rare disease therapies.
Key Barriers & Challenges:
- High cost of treatment: Plasma-derived and recombinant C1-inhibitors are expensive, posing significant financial burdens on healthcare systems and patients.
- Limited patient pool for rare diseases: The niche nature of these conditions can limit market size for individual therapies.
- Complex supply chain and manufacturing: Maintaining the quality and availability of plasma-derived products presents logistical challenges.
- Competition from alternative therapies: While direct substitutes are few, the emergence of novel treatment modalities could impact market share.
- Regulatory hurdles for new market entrants: Stringent clinical trial requirements and lengthy approval processes.
Emerging Opportunities in Plasma Protease C1 Inhibitor Treatment
Emerging opportunities in the Plasma Protease C1 Inhibitor Treatment market lie in expanding the therapeutic applications beyond Hereditary Angioedema, exploring novel delivery systems for enhanced patient compliance, and penetrating underserved emerging markets. The development of gene therapies or gene-editing technologies for primary C1 inhibitor deficiency presents a long-term curative potential. Furthermore, advancements in diagnostic technologies could identify a larger undiagnosed patient population, thus expanding the addressable market. The increasing focus on personalized medicine also offers opportunities for targeted therapies based on individual patient profiles and disease severity.
Growth Accelerators in the Plasma Protease C1 Inhibitor Treatment Industry
Growth in the Plasma Protease C1 Inhibitor Treatment industry is being significantly accelerated by ongoing technological breakthroughs in protein engineering and drug delivery systems. The development of longer-acting formulations, reducing the frequency of injections, is a key catalyst. Strategic partnerships between pharmaceutical giants and smaller biotech firms specializing in rare diseases are fostering collaborative research and development, leading to a faster pipeline of innovative therapies. Furthermore, market expansion strategies targeting emerging economies, where the prevalence of rare diseases is often underdiagnosed, represent a significant avenue for future growth.
Key Players Shaping the Plasma Protease C1 Inhibitor Treatment Market
- Takeda
- CSL
- Sanquin
- Pharming Group
Notable Milestones in Plasma Protease C1 Inhibitor Treatment Sector
- 2019: Continued strong performance of existing C1-inhibitor therapies for Hereditary Angioedema (HAE).
- 2020: Increased focus on recombinant C1-inhibitor development to ensure consistent supply and reduce reliance on plasma-derived products.
- 2021: Significant advancements in clinical trials for novel oral kallikrein inhibitors, showing promise for improved patient convenience.
- 2022: Regulatory approvals for new indications or expanded use of existing C1-inhibitor treatments.
- 2023: Strategic collaborations and partnerships aimed at accelerating R&D and market penetration for C1-inhibitor therapies.
- 2024: Growing patient advocacy and awareness campaigns contributing to earlier diagnosis and demand for advanced treatments.
In-Depth Plasma Protease C1 Inhibitor Treatment Market Outlook
The Plasma Protease C1 Inhibitor Treatment market is poised for robust future growth, driven by a confluence of factors including an expanding patient population, ongoing therapeutic innovation, and favorable market dynamics. The continuous evolution of recombinant C1-inhibitors and the anticipated market penetration of novel oral kallikrein inhibitors are expected to redefine treatment standards and improve patient outcomes. Strategic investments in research and development, coupled with expanding access in emerging markets, will further catalyze this growth. The increasing emphasis on proactive disease management and personalized medicine will create opportunities for tailored therapeutic solutions, solidifying the positive outlook for this critical segment of the rare disease therapeutics market.
Plasma Protease C1 Inhibitor Treatment Segmentation
-
1. Application
- 1.1. Hospital Pharmacies
- 1.2. Independent Pharmacies and Outlets
-
2. Type
- 2.1. C1-inhibitors
- 2.2. Kallikrein Inhibitor (Kalbitor)
Plasma Protease C1 Inhibitor Treatment Segmentation By Geography
-
1. North America
- 1.1. United States
- 1.2. Canada
- 1.3. Mexico
-
2. South America
- 2.1. Brazil
- 2.2. Argentina
- 2.3. Rest of South America
-
3. Europe
- 3.1. United Kingdom
- 3.2. Germany
- 3.3. France
- 3.4. Italy
- 3.5. Spain
- 3.6. Russia
- 3.7. Benelux
- 3.8. Nordics
- 3.9. Rest of Europe
-
4. Middle East & Africa
- 4.1. Turkey
- 4.2. Israel
- 4.3. GCC
- 4.4. North Africa
- 4.5. South Africa
- 4.6. Rest of Middle East & Africa
-
5. Asia Pacific
- 5.1. China
- 5.2. India
- 5.3. Japan
- 5.4. South Korea
- 5.5. ASEAN
- 5.6. Oceania
- 5.7. Rest of Asia Pacific
Plasma Protease C1 Inhibitor Treatment REPORT HIGHLIGHTS
| Aspects | Details |
|---|---|
| Study Period | 2019-2033 |
| Base Year | 2024 |
| Estimated Year | 2025 |
| Forecast Period | 2025-2033 |
| Historical Period | 2019-2024 |
| Growth Rate | CAGR of 6.6% from 2019-2033 |
| Segmentation |
|
Table of Contents
- 1. Introduction
- 1.1. Research Scope
- 1.2. Market Segmentation
- 1.3. Research Methodology
- 1.4. Definitions and Assumptions
- 2. Executive Summary
- 2.1. Introduction
- 3. Market Dynamics
- 3.1. Introduction
- 3.2. Market Drivers
- 3.3. Market Restrains
- 3.4. Market Trends
- 4. Market Factor Analysis
- 4.1. Porters Five Forces
- 4.2. Supply/Value Chain
- 4.3. PESTEL analysis
- 4.4. Market Entropy
- 4.5. Patent/Trademark Analysis
- 5. Global Plasma Protease C1 Inhibitor Treatment Analysis, Insights and Forecast, 2019-2031
- 5.1. Market Analysis, Insights and Forecast - by Application
- 5.1.1. Hospital Pharmacies
- 5.1.2. Independent Pharmacies and Outlets
- 5.2. Market Analysis, Insights and Forecast - by Type
- 5.2.1. C1-inhibitors
- 5.2.2. Kallikrein Inhibitor (Kalbitor)
- 5.3. Market Analysis, Insights and Forecast - by Region
- 5.3.1. North America
- 5.3.2. South America
- 5.3.3. Europe
- 5.3.4. Middle East & Africa
- 5.3.5. Asia Pacific
- 5.1. Market Analysis, Insights and Forecast - by Application
- 6. North America Plasma Protease C1 Inhibitor Treatment Analysis, Insights and Forecast, 2019-2031
- 6.1. Market Analysis, Insights and Forecast - by Application
- 6.1.1. Hospital Pharmacies
- 6.1.2. Independent Pharmacies and Outlets
- 6.2. Market Analysis, Insights and Forecast - by Type
- 6.2.1. C1-inhibitors
- 6.2.2. Kallikrein Inhibitor (Kalbitor)
- 6.1. Market Analysis, Insights and Forecast - by Application
- 7. South America Plasma Protease C1 Inhibitor Treatment Analysis, Insights and Forecast, 2019-2031
- 7.1. Market Analysis, Insights and Forecast - by Application
- 7.1.1. Hospital Pharmacies
- 7.1.2. Independent Pharmacies and Outlets
- 7.2. Market Analysis, Insights and Forecast - by Type
- 7.2.1. C1-inhibitors
- 7.2.2. Kallikrein Inhibitor (Kalbitor)
- 7.1. Market Analysis, Insights and Forecast - by Application
- 8. Europe Plasma Protease C1 Inhibitor Treatment Analysis, Insights and Forecast, 2019-2031
- 8.1. Market Analysis, Insights and Forecast - by Application
- 8.1.1. Hospital Pharmacies
- 8.1.2. Independent Pharmacies and Outlets
- 8.2. Market Analysis, Insights and Forecast - by Type
- 8.2.1. C1-inhibitors
- 8.2.2. Kallikrein Inhibitor (Kalbitor)
- 8.1. Market Analysis, Insights and Forecast - by Application
- 9. Middle East & Africa Plasma Protease C1 Inhibitor Treatment Analysis, Insights and Forecast, 2019-2031
- 9.1. Market Analysis, Insights and Forecast - by Application
- 9.1.1. Hospital Pharmacies
- 9.1.2. Independent Pharmacies and Outlets
- 9.2. Market Analysis, Insights and Forecast - by Type
- 9.2.1. C1-inhibitors
- 9.2.2. Kallikrein Inhibitor (Kalbitor)
- 9.1. Market Analysis, Insights and Forecast - by Application
- 10. Asia Pacific Plasma Protease C1 Inhibitor Treatment Analysis, Insights and Forecast, 2019-2031
- 10.1. Market Analysis, Insights and Forecast - by Application
- 10.1.1. Hospital Pharmacies
- 10.1.2. Independent Pharmacies and Outlets
- 10.2. Market Analysis, Insights and Forecast - by Type
- 10.2.1. C1-inhibitors
- 10.2.2. Kallikrein Inhibitor (Kalbitor)
- 10.1. Market Analysis, Insights and Forecast - by Application
- 11. Competitive Analysis
- 11.1. Global Market Share Analysis 2024
- 11.2. Company Profiles
- 11.2.1 Takeda
- 11.2.1.1. Overview
- 11.2.1.2. Products
- 11.2.1.3. SWOT Analysis
- 11.2.1.4. Recent Developments
- 11.2.1.5. Financials (Based on Availability)
- 11.2.2 CSL
- 11.2.2.1. Overview
- 11.2.2.2. Products
- 11.2.2.3. SWOT Analysis
- 11.2.2.4. Recent Developments
- 11.2.2.5. Financials (Based on Availability)
- 11.2.3 Sanquin
- 11.2.3.1. Overview
- 11.2.3.2. Products
- 11.2.3.3. SWOT Analysis
- 11.2.3.4. Recent Developments
- 11.2.3.5. Financials (Based on Availability)
- 11.2.4 Pharming Group
- 11.2.4.1. Overview
- 11.2.4.2. Products
- 11.2.4.3. SWOT Analysis
- 11.2.4.4. Recent Developments
- 11.2.4.5. Financials (Based on Availability)
- 11.2.1 Takeda
List of Figures
- Figure 1: Global Plasma Protease C1 Inhibitor Treatment Revenue Breakdown (million, %) by Region 2024 & 2032
- Figure 2: North America Plasma Protease C1 Inhibitor Treatment Revenue (million), by Application 2024 & 2032
- Figure 3: North America Plasma Protease C1 Inhibitor Treatment Revenue Share (%), by Application 2024 & 2032
- Figure 4: North America Plasma Protease C1 Inhibitor Treatment Revenue (million), by Type 2024 & 2032
- Figure 5: North America Plasma Protease C1 Inhibitor Treatment Revenue Share (%), by Type 2024 & 2032
- Figure 6: North America Plasma Protease C1 Inhibitor Treatment Revenue (million), by Country 2024 & 2032
- Figure 7: North America Plasma Protease C1 Inhibitor Treatment Revenue Share (%), by Country 2024 & 2032
- Figure 8: South America Plasma Protease C1 Inhibitor Treatment Revenue (million), by Application 2024 & 2032
- Figure 9: South America Plasma Protease C1 Inhibitor Treatment Revenue Share (%), by Application 2024 & 2032
- Figure 10: South America Plasma Protease C1 Inhibitor Treatment Revenue (million), by Type 2024 & 2032
- Figure 11: South America Plasma Protease C1 Inhibitor Treatment Revenue Share (%), by Type 2024 & 2032
- Figure 12: South America Plasma Protease C1 Inhibitor Treatment Revenue (million), by Country 2024 & 2032
- Figure 13: South America Plasma Protease C1 Inhibitor Treatment Revenue Share (%), by Country 2024 & 2032
- Figure 14: Europe Plasma Protease C1 Inhibitor Treatment Revenue (million), by Application 2024 & 2032
- Figure 15: Europe Plasma Protease C1 Inhibitor Treatment Revenue Share (%), by Application 2024 & 2032
- Figure 16: Europe Plasma Protease C1 Inhibitor Treatment Revenue (million), by Type 2024 & 2032
- Figure 17: Europe Plasma Protease C1 Inhibitor Treatment Revenue Share (%), by Type 2024 & 2032
- Figure 18: Europe Plasma Protease C1 Inhibitor Treatment Revenue (million), by Country 2024 & 2032
- Figure 19: Europe Plasma Protease C1 Inhibitor Treatment Revenue Share (%), by Country 2024 & 2032
- Figure 20: Middle East & Africa Plasma Protease C1 Inhibitor Treatment Revenue (million), by Application 2024 & 2032
- Figure 21: Middle East & Africa Plasma Protease C1 Inhibitor Treatment Revenue Share (%), by Application 2024 & 2032
- Figure 22: Middle East & Africa Plasma Protease C1 Inhibitor Treatment Revenue (million), by Type 2024 & 2032
- Figure 23: Middle East & Africa Plasma Protease C1 Inhibitor Treatment Revenue Share (%), by Type 2024 & 2032
- Figure 24: Middle East & Africa Plasma Protease C1 Inhibitor Treatment Revenue (million), by Country 2024 & 2032
- Figure 25: Middle East & Africa Plasma Protease C1 Inhibitor Treatment Revenue Share (%), by Country 2024 & 2032
- Figure 26: Asia Pacific Plasma Protease C1 Inhibitor Treatment Revenue (million), by Application 2024 & 2032
- Figure 27: Asia Pacific Plasma Protease C1 Inhibitor Treatment Revenue Share (%), by Application 2024 & 2032
- Figure 28: Asia Pacific Plasma Protease C1 Inhibitor Treatment Revenue (million), by Type 2024 & 2032
- Figure 29: Asia Pacific Plasma Protease C1 Inhibitor Treatment Revenue Share (%), by Type 2024 & 2032
- Figure 30: Asia Pacific Plasma Protease C1 Inhibitor Treatment Revenue (million), by Country 2024 & 2032
- Figure 31: Asia Pacific Plasma Protease C1 Inhibitor Treatment Revenue Share (%), by Country 2024 & 2032
List of Tables
- Table 1: Global Plasma Protease C1 Inhibitor Treatment Revenue million Forecast, by Region 2019 & 2032
- Table 2: Global Plasma Protease C1 Inhibitor Treatment Revenue million Forecast, by Application 2019 & 2032
- Table 3: Global Plasma Protease C1 Inhibitor Treatment Revenue million Forecast, by Type 2019 & 2032
- Table 4: Global Plasma Protease C1 Inhibitor Treatment Revenue million Forecast, by Region 2019 & 2032
- Table 5: Global Plasma Protease C1 Inhibitor Treatment Revenue million Forecast, by Application 2019 & 2032
- Table 6: Global Plasma Protease C1 Inhibitor Treatment Revenue million Forecast, by Type 2019 & 2032
- Table 7: Global Plasma Protease C1 Inhibitor Treatment Revenue million Forecast, by Country 2019 & 2032
- Table 8: United States Plasma Protease C1 Inhibitor Treatment Revenue (million) Forecast, by Application 2019 & 2032
- Table 9: Canada Plasma Protease C1 Inhibitor Treatment Revenue (million) Forecast, by Application 2019 & 2032
- Table 10: Mexico Plasma Protease C1 Inhibitor Treatment Revenue (million) Forecast, by Application 2019 & 2032
- Table 11: Global Plasma Protease C1 Inhibitor Treatment Revenue million Forecast, by Application 2019 & 2032
- Table 12: Global Plasma Protease C1 Inhibitor Treatment Revenue million Forecast, by Type 2019 & 2032
- Table 13: Global Plasma Protease C1 Inhibitor Treatment Revenue million Forecast, by Country 2019 & 2032
- Table 14: Brazil Plasma Protease C1 Inhibitor Treatment Revenue (million) Forecast, by Application 2019 & 2032
- Table 15: Argentina Plasma Protease C1 Inhibitor Treatment Revenue (million) Forecast, by Application 2019 & 2032
- Table 16: Rest of South America Plasma Protease C1 Inhibitor Treatment Revenue (million) Forecast, by Application 2019 & 2032
- Table 17: Global Plasma Protease C1 Inhibitor Treatment Revenue million Forecast, by Application 2019 & 2032
- Table 18: Global Plasma Protease C1 Inhibitor Treatment Revenue million Forecast, by Type 2019 & 2032
- Table 19: Global Plasma Protease C1 Inhibitor Treatment Revenue million Forecast, by Country 2019 & 2032
- Table 20: United Kingdom Plasma Protease C1 Inhibitor Treatment Revenue (million) Forecast, by Application 2019 & 2032
- Table 21: Germany Plasma Protease C1 Inhibitor Treatment Revenue (million) Forecast, by Application 2019 & 2032
- Table 22: France Plasma Protease C1 Inhibitor Treatment Revenue (million) Forecast, by Application 2019 & 2032
- Table 23: Italy Plasma Protease C1 Inhibitor Treatment Revenue (million) Forecast, by Application 2019 & 2032
- Table 24: Spain Plasma Protease C1 Inhibitor Treatment Revenue (million) Forecast, by Application 2019 & 2032
- Table 25: Russia Plasma Protease C1 Inhibitor Treatment Revenue (million) Forecast, by Application 2019 & 2032
- Table 26: Benelux Plasma Protease C1 Inhibitor Treatment Revenue (million) Forecast, by Application 2019 & 2032
- Table 27: Nordics Plasma Protease C1 Inhibitor Treatment Revenue (million) Forecast, by Application 2019 & 2032
- Table 28: Rest of Europe Plasma Protease C1 Inhibitor Treatment Revenue (million) Forecast, by Application 2019 & 2032
- Table 29: Global Plasma Protease C1 Inhibitor Treatment Revenue million Forecast, by Application 2019 & 2032
- Table 30: Global Plasma Protease C1 Inhibitor Treatment Revenue million Forecast, by Type 2019 & 2032
- Table 31: Global Plasma Protease C1 Inhibitor Treatment Revenue million Forecast, by Country 2019 & 2032
- Table 32: Turkey Plasma Protease C1 Inhibitor Treatment Revenue (million) Forecast, by Application 2019 & 2032
- Table 33: Israel Plasma Protease C1 Inhibitor Treatment Revenue (million) Forecast, by Application 2019 & 2032
- Table 34: GCC Plasma Protease C1 Inhibitor Treatment Revenue (million) Forecast, by Application 2019 & 2032
- Table 35: North Africa Plasma Protease C1 Inhibitor Treatment Revenue (million) Forecast, by Application 2019 & 2032
- Table 36: South Africa Plasma Protease C1 Inhibitor Treatment Revenue (million) Forecast, by Application 2019 & 2032
- Table 37: Rest of Middle East & Africa Plasma Protease C1 Inhibitor Treatment Revenue (million) Forecast, by Application 2019 & 2032
- Table 38: Global Plasma Protease C1 Inhibitor Treatment Revenue million Forecast, by Application 2019 & 2032
- Table 39: Global Plasma Protease C1 Inhibitor Treatment Revenue million Forecast, by Type 2019 & 2032
- Table 40: Global Plasma Protease C1 Inhibitor Treatment Revenue million Forecast, by Country 2019 & 2032
- Table 41: China Plasma Protease C1 Inhibitor Treatment Revenue (million) Forecast, by Application 2019 & 2032
- Table 42: India Plasma Protease C1 Inhibitor Treatment Revenue (million) Forecast, by Application 2019 & 2032
- Table 43: Japan Plasma Protease C1 Inhibitor Treatment Revenue (million) Forecast, by Application 2019 & 2032
- Table 44: South Korea Plasma Protease C1 Inhibitor Treatment Revenue (million) Forecast, by Application 2019 & 2032
- Table 45: ASEAN Plasma Protease C1 Inhibitor Treatment Revenue (million) Forecast, by Application 2019 & 2032
- Table 46: Oceania Plasma Protease C1 Inhibitor Treatment Revenue (million) Forecast, by Application 2019 & 2032
- Table 47: Rest of Asia Pacific Plasma Protease C1 Inhibitor Treatment Revenue (million) Forecast, by Application 2019 & 2032
Frequently Asked Questions
1. What is the projected Compound Annual Growth Rate (CAGR) of the Plasma Protease C1 Inhibitor Treatment?
The projected CAGR is approximately 6.6%.
2. Which companies are prominent players in the Plasma Protease C1 Inhibitor Treatment?
Key companies in the market include Takeda, CSL, Sanquin, Pharming Group.
3. What are the main segments of the Plasma Protease C1 Inhibitor Treatment?
The market segments include Application, Type.
4. Can you provide details about the market size?
The market size is estimated to be USD 3852 million as of 2022.
5. What are some drivers contributing to market growth?
N/A
6. What are the notable trends driving market growth?
N/A
7. Are there any restraints impacting market growth?
N/A
8. Can you provide examples of recent developments in the market?
N/A
9. What pricing options are available for accessing the report?
Pricing options include single-user, multi-user, and enterprise licenses priced at USD 3950.00, USD 5925.00, and USD 7900.00 respectively.
10. Is the market size provided in terms of value or volume?
The market size is provided in terms of value, measured in million.
11. Are there any specific market keywords associated with the report?
Yes, the market keyword associated with the report is "Plasma Protease C1 Inhibitor Treatment," which aids in identifying and referencing the specific market segment covered.
12. How do I determine which pricing option suits my needs best?
The pricing options vary based on user requirements and access needs. Individual users may opt for single-user licenses, while businesses requiring broader access may choose multi-user or enterprise licenses for cost-effective access to the report.
13. Are there any additional resources or data provided in the Plasma Protease C1 Inhibitor Treatment report?
While the report offers comprehensive insights, it's advisable to review the specific contents or supplementary materials provided to ascertain if additional resources or data are available.
14. How can I stay updated on further developments or reports in the Plasma Protease C1 Inhibitor Treatment?
To stay informed about further developments, trends, and reports in the Plasma Protease C1 Inhibitor Treatment, consider subscribing to industry newsletters, following relevant companies and organizations, or regularly checking reputable industry news sources and publications.
Methodology
Step 1 - Identification of Relevant Samples Size from Population Database


Step 2 - Approaches for Defining Global Market Size (Value, Volume* & Price*)

Note*: In applicable scenarios
Step 3 - Data Sources
Primary Research
- Web Analytics
- Survey Reports
- Research Institute
- Latest Research Reports
- Opinion Leaders
Secondary Research
- Annual Reports
- White Paper
- Latest Press Release
- Industry Association
- Paid Database
- Investor Presentations

Step 4 - Data Triangulation
Involves using different sources of information in order to increase the validity of a study
These sources are likely to be stakeholders in a program - participants, other researchers, program staff, other community members, and so on.
Then we put all data in single framework & apply various statistical tools to find out the dynamic on the market.
During the analysis stage, feedback from the stakeholder groups would be compared to determine areas of agreement as well as areas of divergence


