Key Insights
The Planar Inverted-F Antenna (PIFA) market is experiencing robust growth, projected to reach a substantial market size of approximately $4,500 million by 2025, with a compound annual growth rate (CAGR) of around 8.5% anticipated through 2033. This expansion is primarily fueled by the ever-increasing demand for miniaturized and high-performance antennas across a spectrum of electronic devices. The ubiquitous presence of smartphones, the rapid adoption of Near Field Communication (NFC) technology for contactless payments and data transfer, and the continuous evolution of the Internet of Things (IoT) ecosystem are significant drivers. The intricate integration of multiple antennas within compact device form factors necessitates advanced antenna solutions like PIFAs, which offer excellent performance, radiation efficiency, and miniaturization capabilities essential for these applications. Furthermore, the expanding use of PIFAs in non-mobile applications, such as automotive electronics and wearable technology, is also contributing to this upward trajectory, creating new avenues for market penetration and revenue generation.
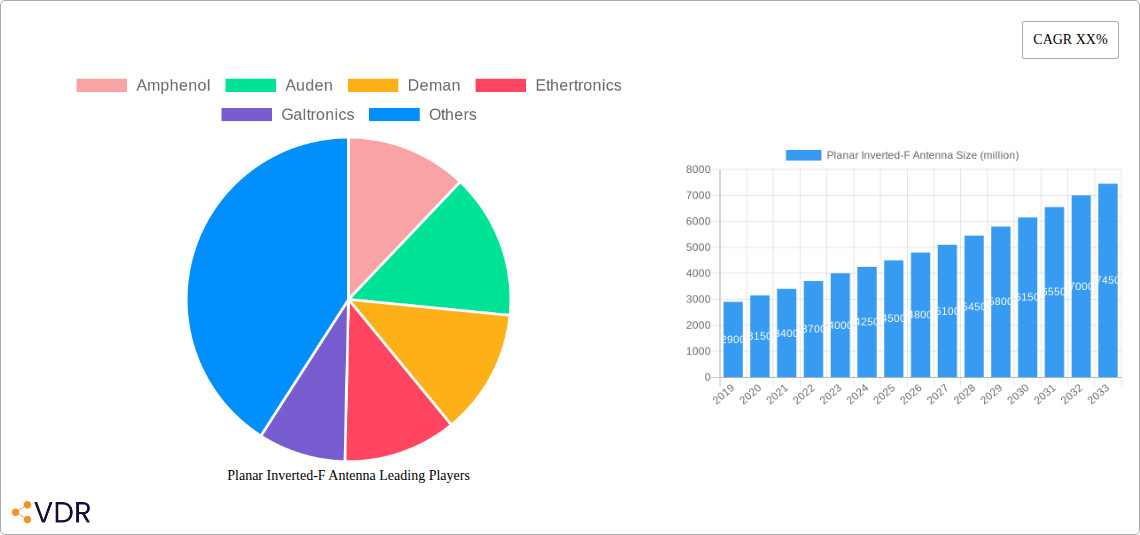
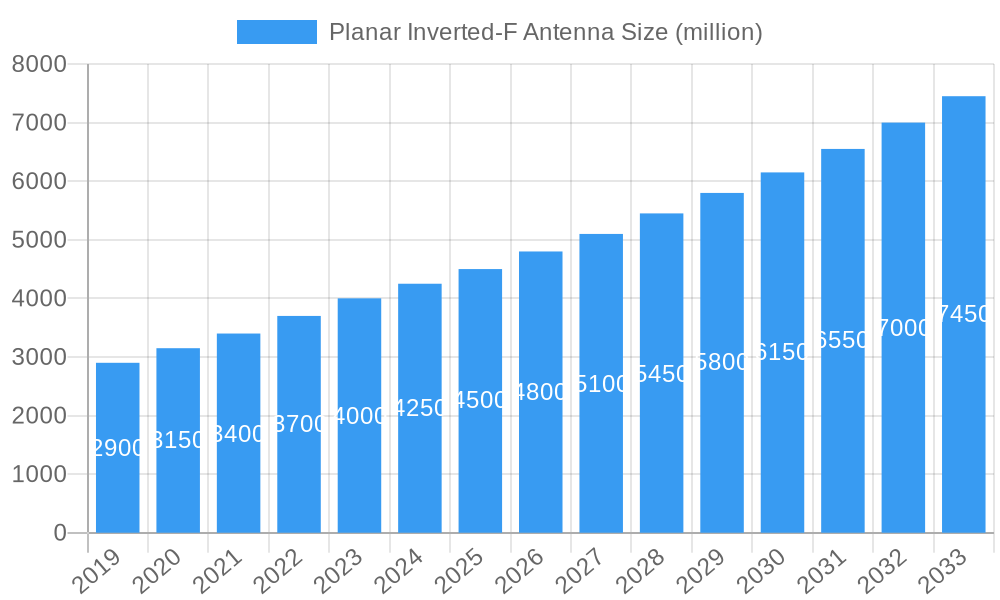
Planar Inverted-F Antenna Market Size (In Billion)
Despite the promising outlook, certain factors could temper the market's full potential. The increasing complexity of antenna design and manufacturing, coupled with the need for specialized expertise and advanced equipment, can represent a significant capital investment for manufacturers. Moreover, the persistent drive towards even more integrated solutions and the emergence of alternative antenna technologies could pose competitive challenges. However, the inherent advantages of PIFAs, including their planar structure, ease of integration onto PCBs, and cost-effectiveness in mass production, are expected to outweigh these restraints. The market is characterized by a dynamic competitive landscape, with key players such as Amphenol, Molex, and Pulse continuously investing in research and development to innovate and expand their product portfolios, catering to the evolving needs of the consumer electronics, telecommunications, and automotive industries. The Asia Pacific region is expected to dominate the market due to its strong manufacturing base and burgeoning consumer electronics sector.
Planar Inverted-F Antenna Company Market Share
Planar Inverted-F Antenna Market Dynamics & Structure
The Planar Inverted-F Antenna (PIFA) market is characterized by a moderately consolidated structure, with key players such as Amphenol, Molex, Pulse, and Luxshare Precision holding significant market share. Technological innovation is the primary driver, fueled by the relentless demand for smaller, more efficient, and multi-band antennas in an array of connected devices. Robust regulatory frameworks governing electromagnetic compatibility (EMC) and radio frequency (RF) emissions indirectly shape antenna design and performance standards. Competitive product substitutes, while present in niche applications, are largely outpaced by the versatility and cost-effectiveness of PIFAs in mainstream mobile and IoT devices. End-user demographics are increasingly shifting towards a digitally connected global population, driving demand across consumer electronics and emerging industrial applications. Mergers and acquisitions (M&A) trends, though not dominant, are observed as companies seek to expand their product portfolios and geographical reach, particularly in high-growth regions.
- Market Concentration: Moderate, with a few leading players dominating a substantial portion of the market.
- Technological Innovation: Driven by miniaturization, multi-band capabilities, and improved efficiency for 5G and IoT.
- Regulatory Influence: EMC and RF emission standards play a crucial role in antenna design validation.
- Competitive Landscape: PIFAs maintain a strong position against alternative antenna technologies in most core applications.
- End-User Demographics: Growing adoption by younger demographics and increasing penetration in developing economies.
- M&A Activity: Strategic acquisitions aimed at consolidating market presence and expanding technological expertise.
Planar Inverted-F Antenna Growth Trends & Insights
The global Planar Inverted-F Antenna (PIFA) market is poised for significant expansion, projected to reach an estimated $10.5 billion in 2025, with a robust Compound Annual Growth Rate (CAGR) of 7.8% from 2025 to 2033. This growth trajectory is underpinned by the insatiable demand for wireless connectivity across a diverse range of applications. The Mobile Phone segment remains the cornerstone of the PIFA market, expected to account for approximately 45% of the total market revenue by 2025. The escalating adoption of smartphones, coupled with the transition to 5G networks, necessitates more sophisticated and integrated antenna solutions, which PIFAs effectively provide due to their compact form factor and broad frequency coverage.
Beyond mobile devices, the Near Field Communication (NFC) segment is emerging as a critical growth avenue. With the proliferation of contactless payment systems, smart access controls, and wearable technology, the demand for efficient and miniaturized NFC antennas is surging. This segment is anticipated to witness a CAGR of 9.5% during the forecast period. "Others" application segment, encompassing IoT devices, wearables, automotive infotainment systems, and smart home devices, will also contribute substantially to market growth, driven by the ever-expanding ecosystem of connected devices. The market penetration of PIFAs in these nascent yet rapidly growing sectors is expected to increase considerably.
Technological disruptions are continually reshaping the PIFA landscape. Innovations in material science, such as the development of flexible and conductive substrates, are enabling the integration of PIFAs into even more intricate product designs. Furthermore, advancements in antenna simulation and optimization software are allowing for faster development cycles and improved performance characteristics, such as enhanced bandwidth, reduced interference, and higher efficiency. Consumer behavior shifts, particularly the growing preference for sleeker, more portable, and feature-rich electronic devices, directly translate into a higher demand for compact and high-performance antennas like PIFAs. The increasing reliance on mobile devices for daily tasks, entertainment, and communication further solidifies the market's growth prospects. The overall market size evolution, from an estimated $6.9 billion in 2019 to the projected $10.5 billion in 2025, highlights the sustained and accelerating demand for PIFA technology.
Dominant Regions, Countries, or Segments in Planar Inverted-F Antenna
The Mobile Phone application segment stands as the undisputed leader in the Planar Inverted-F Antenna (PIFA) market, driving significant growth and innovation. This dominance is intrinsically linked to the global ubiquity of smartphones, which serve as the primary platform for wireless communication and a vast array of connected services. By 2025, the mobile phone application segment is projected to command an estimated 45% market share, translating to a market value of approximately $4.73 billion. The continuous evolution of smartphone technology, including the widespread adoption of 5G connectivity, the integration of multiple antennas for diverse functionalities (e.g., Wi-Fi, Bluetooth, GPS, NFC), and the increasing demand for sleeker device designs, all contribute to the sustained need for advanced PIFA solutions.
Within the PIFA market, the Main Antenna type, crucial for primary cellular communication, is intrinsically tied to the mobile phone segment's leadership. This type of antenna is essential for voice calls, data transmission, and overall network connectivity. The ongoing demand for enhanced data speeds and improved signal integrity in smartphones directly fuels the growth of main antenna shipments. While other antenna types like Bluetooth and Wi-Fi antennas are integral to mobile devices, the core functionality of the mobile phone relies heavily on the main antenna. The growth potential for the main antenna segment remains exceptionally strong due to the sheer volume of mobile devices manufactured globally.
Geographically, Asia Pacific is the dominant region in the PIFA market, driven by its status as the world's largest hub for consumer electronics manufacturing and its rapidly expanding consumer base. Countries like China, South Korea, and Taiwan are at the forefront of smartphone production, supplying a significant portion of global demand. Furthermore, the burgeoning middle class in these regions, coupled with increasing disposable incomes, fuels the adoption of advanced mobile devices, thereby boosting the demand for PIFAs. Economic policies in these nations, often geared towards supporting manufacturing and technological advancements, further accelerate the growth of the PIFA market. The robust supply chain infrastructure and the presence of major antenna manufacturers in the region also contribute to its leadership. The market share of the Asia Pacific region is estimated to be around 60% of the global PIFA market by 2025.
- Dominant Application Segment: Mobile Phone (estimated 45% market share by 2025).
- Key Drivers for Mobile Phone Dominance: Smartphone proliferation, 5G adoption, demand for multi-band functionality, and miniaturization trends.
- Dominant Antenna Type: Main Antenna, directly supporting core mobile communication.
- Dominant Region: Asia Pacific (estimated 60% market share by 2025).
- Key Drivers for Asia Pacific Dominance: Manufacturing hub for electronics, growing consumer base, supportive economic policies, and established supply chains.
Planar Inverted-F Antenna Product Landscape
The Planar Inverted-F Antenna (PIFA) product landscape is continuously evolving with an emphasis on miniaturization, enhanced bandwidth, and multi-frequency support. Innovations include the development of compact PIFAs capable of operating across multiple cellular bands (e.g., sub-6 GHz 5G, LTE), Wi-Fi standards (e.g., Wi-Fi 6/6E), and Bluetooth frequencies. Advanced material science is enabling the integration of PIFAs into flexible substrates, allowing for their incorporation into curved surfaces and increasingly intricate device designs. Performance metrics such as antenna efficiency, radiation patterns, and impedance matching are paramount, with manufacturers striving to optimize these for demanding applications like smartphones and IoT devices. Unique selling propositions often revolve around superior integration capabilities, minimal impact on device aesthetics, and cost-effectiveness for mass production. Technological advancements are enabling PIFAs to achieve higher gain and better isolation between antenna elements, crucial for the performance of modern connected devices.
Key Drivers, Barriers & Challenges in Planar Inverted-F Antenna
The Planar Inverted-F Antenna (PIFA) market is propelled by several key drivers. The exponential growth of the Internet of Things (IoT) ecosystem, demanding ubiquitous wireless connectivity for a myriad of devices, is a primary catalyst. The relentless innovation in the mobile phone industry, particularly the rollout of 5G technology and the increasing need for multiple antenna functionalities within a single device, also significantly fuels demand. Furthermore, the widespread adoption of wireless charging technologies, where antenna placement and efficiency are critical, contributes to market expansion. Advancements in antenna design software and manufacturing techniques enable the creation of smaller, more efficient, and cost-effective PIFAs.
However, the market faces several barriers and challenges. Intense competition among manufacturers can lead to price erosion, impacting profit margins. The stringent regulatory requirements for RF emissions and electromagnetic compatibility (EMC) in different regions necessitate rigorous testing and certification processes, adding to development costs and timeframes. Supply chain disruptions, particularly for critical components and raw materials, can lead to production delays and increased costs. The development of novel antenna technologies that offer superior performance or unique advantages could pose a competitive threat, although PIFAs currently hold a dominant position. Additionally, the miniaturization push, while a driver, also presents engineering challenges in maintaining antenna performance within extremely confined spaces.
Emerging Opportunities in Planar Inverted-F Antenna
Emerging opportunities within the Planar Inverted-F Antenna (PIFA) market lie in the burgeoning fields of wearable technology, augmented and virtual reality (AR/VR) devices, and advanced automotive connectivity. The increasing demand for seamless data transfer and reliable communication in smartwatches, fitness trackers, and AR/VR headsets presents a significant avenue for PIFA innovation. Furthermore, the integration of PIFAs into in-cabin automotive systems for Wi-Fi, Bluetooth, and cellular connectivity, as well as for V2X (Vehicle-to-Everything) communication, offers substantial growth potential. The expansion of smart grid technologies and industrial IoT applications also presents untapped markets for specialized PIFA solutions.
Growth Accelerators in the Planar Inverted-F Antenna Industry
The long-term growth of the Planar Inverted-F Antenna (PIFA) industry is significantly accelerated by ongoing technological breakthroughs in materials science and antenna design. Innovations in metamaterials and reconfigurable antennas are paving the way for PIFAs with unprecedented performance characteristics, including adaptive beamforming and enhanced spectral efficiency. Strategic partnerships between antenna manufacturers and leading device OEMs are crucial for co-design and optimization, ensuring seamless integration and superior performance in next-generation products. The expanding global adoption of 5G infrastructure and the subsequent proliferation of 5G-enabled devices across various sectors, from consumer electronics to industrial automation, serve as a major growth catalyst. Furthermore, the increasing consumer demand for more connected experiences and the relentless drive towards greater device functionality will continue to fuel the need for compact, high-performance PIFA solutions.
Key Players Shaping the Planar Inverted-F Antenna Market
- Amphenol
- Auden
- Deman
- Ethertronics
- Galtronics
- JESONcom
- Luxshare Precision
- Molex
- Pulse
- Shanghai Shenxun Communication Technology
- Skycross
- Sky-wave
- Southstar
- Speed
- Sunway
Notable Milestones in Planar Inverted-F Antenna Sector
- 2019: Significant advancements in compact, multi-band PIFA designs to support burgeoning 5G deployments in mobile devices.
- 2020: Increased integration of PIFAs in wearables, driven by the growing popularity of smartwatches and fitness trackers.
- 2021: Development of higher efficiency PIFAs for improved battery life in IoT devices.
- 2022: Focus on miniaturization and integration of PIFAs for foldable smartphones and other flexible electronic devices.
- 2023: Enhanced PIFA designs for improved performance in crowded RF environments, crucial for dense urban deployments.
- 2024: Growing research and development into PIFAs for emerging applications such as augmented reality (AR) and virtual reality (VR) headsets.
In-Depth Planar Inverted-F Antenna Market Outlook
The Planar Inverted-F Antenna (PIFA) market is poised for sustained growth, driven by the pervasive expansion of wireless connectivity across all facets of life. Future market potential is exceptionally bright, fueled by the continued evolution of 5G and the impending widespread adoption of 6G technologies, which will necessitate even more sophisticated antenna solutions. Strategic opportunities abound in niche and emerging markets such as advanced automotive telematics, industrial IoT, and medical devices, where reliable and compact wireless communication is paramount. The ongoing pursuit of miniaturization and enhanced performance will continue to drive innovation, with PIFAs expected to remain a cornerstone technology in meeting these evolving demands.
Planar Inverted-F Antenna Segmentation
-
1. Application
- 1.1. Mobile Phone
- 1.2. Near Field Communication (NFC)
- 1.3. Others
-
2. Types
- 2.1. Main Antenna
- 2.2. Bluetooth Antenna
- 2.3. WIFI Antenna
- 2.4. GPS Antenna
- 2.5. Others
Planar Inverted-F Antenna Segmentation By Geography
-
1. North America
- 1.1. United States
- 1.2. Canada
- 1.3. Mexico
-
2. South America
- 2.1. Brazil
- 2.2. Argentina
- 2.3. Rest of South America
-
3. Europe
- 3.1. United Kingdom
- 3.2. Germany
- 3.3. France
- 3.4. Italy
- 3.5. Spain
- 3.6. Russia
- 3.7. Benelux
- 3.8. Nordics
- 3.9. Rest of Europe
-
4. Middle East & Africa
- 4.1. Turkey
- 4.2. Israel
- 4.3. GCC
- 4.4. North Africa
- 4.5. South Africa
- 4.6. Rest of Middle East & Africa
-
5. Asia Pacific
- 5.1. China
- 5.2. India
- 5.3. Japan
- 5.4. South Korea
- 5.5. ASEAN
- 5.6. Oceania
- 5.7. Rest of Asia Pacific
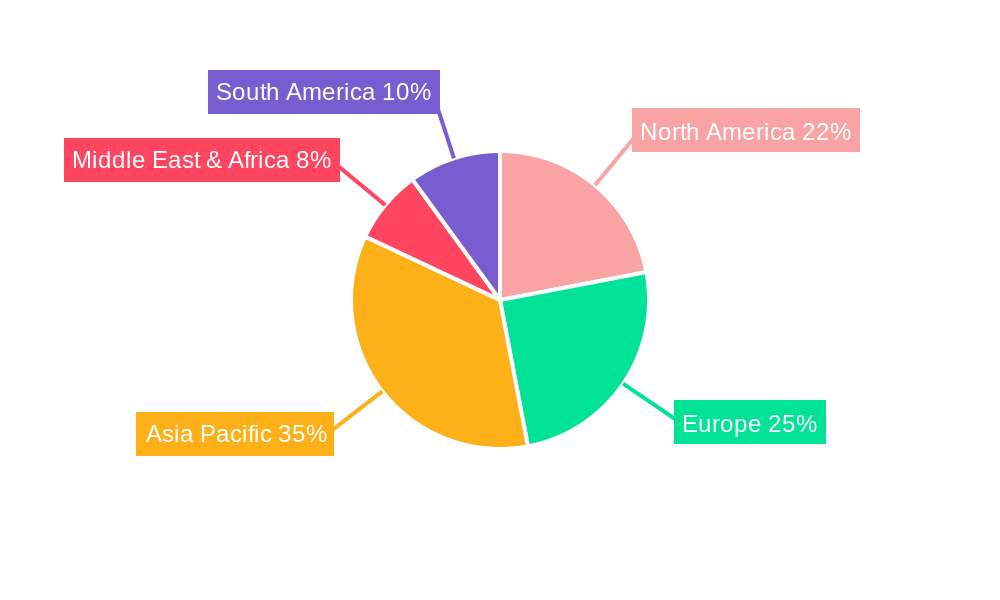
Planar Inverted-F Antenna Regional Market Share
Geographic Coverage of Planar Inverted-F Antenna
Planar Inverted-F Antenna REPORT HIGHLIGHTS
| Aspects | Details |
|---|---|
| Study Period | 2020-2034 |
| Base Year | 2025 |
| Estimated Year | 2026 |
| Forecast Period | 2026-2034 |
| Historical Period | 2020-2025 |
| Growth Rate | CAGR of 14.1% from 2020-2034 |
| Segmentation |
|
Table of Contents
- 1. Introduction
- 1.1. Research Scope
- 1.2. Market Segmentation
- 1.3. Research Objective
- 1.4. Definitions and Assumptions
- 2. Executive Summary
- 2.1. Market Snapshot
- 3. Market Dynamics
- 3.1. Market Drivers
- 3.2. Market Restrains
- 3.3. Market Trends
- 3.4. Market Opportunities
- 4. Market Factor Analysis
- 4.1. Porters Five Forces
- 4.1.1. Bargaining Power of Suppliers
- 4.1.2. Bargaining Power of Buyers
- 4.1.3. Threat of New Entrants
- 4.1.4. Threat of Substitutes
- 4.1.5. Competitive Rivalry
- 4.2. PESTEL analysis
- 4.3. BCG Analysis
- 4.3.1. Stars (High Growth, High Market Share)
- 4.3.2. Cash Cows (Low Growth, High Market Share)
- 4.3.3. Question Mark (High Growth, Low Market Share)
- 4.3.4. Dogs (Low Growth, Low Market Share)
- 4.4. Ansoff Matrix Analysis
- 4.5. Supply Chain Analysis
- 4.6. Regulatory Landscape
- 4.7. Current Market Potential and Opportunity Assessment (TAM–SAM–SOM Framework)
- 4.8. VDR Analyst Note
- 4.1. Porters Five Forces
- 5. Market Analysis, Insights and Forecast 2021-2033
- 5.1. Market Analysis, Insights and Forecast - by Application
- 5.1.1. Mobile Phone
- 5.1.2. Near Field Communication (NFC)
- 5.1.3. Others
- 5.2. Market Analysis, Insights and Forecast - by Types
- 5.2.1. Main Antenna
- 5.2.2. Bluetooth Antenna
- 5.2.3. WIFI Antenna
- 5.2.4. GPS Antenna
- 5.2.5. Others
- 5.3. Market Analysis, Insights and Forecast - by Region
- 5.3.1. North America
- 5.3.2. South America
- 5.3.3. Europe
- 5.3.4. Middle East & Africa
- 5.3.5. Asia Pacific
- 5.1. Market Analysis, Insights and Forecast - by Application
- 6. Global Planar Inverted-F Antenna Analysis, Insights and Forecast, 2021-2033
- 6.1. Market Analysis, Insights and Forecast - by Application
- 6.1.1. Mobile Phone
- 6.1.2. Near Field Communication (NFC)
- 6.1.3. Others
- 6.2. Market Analysis, Insights and Forecast - by Types
- 6.2.1. Main Antenna
- 6.2.2. Bluetooth Antenna
- 6.2.3. WIFI Antenna
- 6.2.4. GPS Antenna
- 6.2.5. Others
- 6.1. Market Analysis, Insights and Forecast - by Application
- 7. North America Planar Inverted-F Antenna Analysis, Insights and Forecast, 2021-2033
- 7.1. Market Analysis, Insights and Forecast - by Application
- 7.1.1. Mobile Phone
- 7.1.2. Near Field Communication (NFC)
- 7.1.3. Others
- 7.2. Market Analysis, Insights and Forecast - by Types
- 7.2.1. Main Antenna
- 7.2.2. Bluetooth Antenna
- 7.2.3. WIFI Antenna
- 7.2.4. GPS Antenna
- 7.2.5. Others
- 7.1. Market Analysis, Insights and Forecast - by Application
- 8. South America Planar Inverted-F Antenna Analysis, Insights and Forecast, 2021-2033
- 8.1. Market Analysis, Insights and Forecast - by Application
- 8.1.1. Mobile Phone
- 8.1.2. Near Field Communication (NFC)
- 8.1.3. Others
- 8.2. Market Analysis, Insights and Forecast - by Types
- 8.2.1. Main Antenna
- 8.2.2. Bluetooth Antenna
- 8.2.3. WIFI Antenna
- 8.2.4. GPS Antenna
- 8.2.5. Others
- 8.1. Market Analysis, Insights and Forecast - by Application
- 9. Europe Planar Inverted-F Antenna Analysis, Insights and Forecast, 2021-2033
- 9.1. Market Analysis, Insights and Forecast - by Application
- 9.1.1. Mobile Phone
- 9.1.2. Near Field Communication (NFC)
- 9.1.3. Others
- 9.2. Market Analysis, Insights and Forecast - by Types
- 9.2.1. Main Antenna
- 9.2.2. Bluetooth Antenna
- 9.2.3. WIFI Antenna
- 9.2.4. GPS Antenna
- 9.2.5. Others
- 9.1. Market Analysis, Insights and Forecast - by Application
- 10. Middle East & Africa Planar Inverted-F Antenna Analysis, Insights and Forecast, 2021-2033
- 10.1. Market Analysis, Insights and Forecast - by Application
- 10.1.1. Mobile Phone
- 10.1.2. Near Field Communication (NFC)
- 10.1.3. Others
- 10.2. Market Analysis, Insights and Forecast - by Types
- 10.2.1. Main Antenna
- 10.2.2. Bluetooth Antenna
- 10.2.3. WIFI Antenna
- 10.2.4. GPS Antenna
- 10.2.5. Others
- 10.1. Market Analysis, Insights and Forecast - by Application
- 11. Asia Pacific Planar Inverted-F Antenna Analysis, Insights and Forecast, 2021-2033
- 11.1. Market Analysis, Insights and Forecast - by Application
- 11.1.1. Mobile Phone
- 11.1.2. Near Field Communication (NFC)
- 11.1.3. Others
- 11.2. Market Analysis, Insights and Forecast - by Types
- 11.2.1. Main Antenna
- 11.2.2. Bluetooth Antenna
- 11.2.3. WIFI Antenna
- 11.2.4. GPS Antenna
- 11.2.5. Others
- 11.1. Market Analysis, Insights and Forecast - by Application
- 12. Competitive Analysis
- 12.1. Company Profiles
- 12.1.1 Amphenol
- 12.1.1.1. Company Overview
- 12.1.1.2. Products
- 12.1.1.3. Company Financials
- 12.1.1.4. SWOT Analysis
- 12.1.2 Auden
- 12.1.2.1. Company Overview
- 12.1.2.2. Products
- 12.1.2.3. Company Financials
- 12.1.2.4. SWOT Analysis
- 12.1.3 Deman
- 12.1.3.1. Company Overview
- 12.1.3.2. Products
- 12.1.3.3. Company Financials
- 12.1.3.4. SWOT Analysis
- 12.1.4 Ethertronics
- 12.1.4.1. Company Overview
- 12.1.4.2. Products
- 12.1.4.3. Company Financials
- 12.1.4.4. SWOT Analysis
- 12.1.5 Galtronics
- 12.1.5.1. Company Overview
- 12.1.5.2. Products
- 12.1.5.3. Company Financials
- 12.1.5.4. SWOT Analysis
- 12.1.6 JESONcom
- 12.1.6.1. Company Overview
- 12.1.6.2. Products
- 12.1.6.3. Company Financials
- 12.1.6.4. SWOT Analysis
- 12.1.7 Luxshare Precision
- 12.1.7.1. Company Overview
- 12.1.7.2. Products
- 12.1.7.3. Company Financials
- 12.1.7.4. SWOT Analysis
- 12.1.8 Molex
- 12.1.8.1. Company Overview
- 12.1.8.2. Products
- 12.1.8.3. Company Financials
- 12.1.8.4. SWOT Analysis
- 12.1.9 Pulse
- 12.1.9.1. Company Overview
- 12.1.9.2. Products
- 12.1.9.3. Company Financials
- 12.1.9.4. SWOT Analysis
- 12.1.10 Shanghai Shenxun Communication Technology
- 12.1.10.1. Company Overview
- 12.1.10.2. Products
- 12.1.10.3. Company Financials
- 12.1.10.4. SWOT Analysis
- 12.1.11 Skycross
- 12.1.11.1. Company Overview
- 12.1.11.2. Products
- 12.1.11.3. Company Financials
- 12.1.11.4. SWOT Analysis
- 12.1.12 Sky-wave
- 12.1.12.1. Company Overview
- 12.1.12.2. Products
- 12.1.12.3. Company Financials
- 12.1.12.4. SWOT Analysis
- 12.1.13 Southstar
- 12.1.13.1. Company Overview
- 12.1.13.2. Products
- 12.1.13.3. Company Financials
- 12.1.13.4. SWOT Analysis
- 12.1.14 Speed
- 12.1.14.1. Company Overview
- 12.1.14.2. Products
- 12.1.14.3. Company Financials
- 12.1.14.4. SWOT Analysis
- 12.1.15 Sunway
- 12.1.15.1. Company Overview
- 12.1.15.2. Products
- 12.1.15.3. Company Financials
- 12.1.15.4. SWOT Analysis
- 12.1.1 Amphenol
- 12.2. Market Entropy
- 12.2.1 Company's Key Areas Served
- 12.2.2 Recent Developments
- 12.3. Company Market Share Analysis 2025
- 12.3.1 Top 5 Companies Market Share Analysis
- 12.3.2 Top 3 Companies Market Share Analysis
- 12.4. List of Potential Customers
- 13. Research Methodology
List of Figures
- Figure 1: Global Planar Inverted-F Antenna Revenue Breakdown (million, %) by Region 2025 & 2033
- Figure 2: North America Planar Inverted-F Antenna Revenue (million), by Application 2025 & 2033
- Figure 3: North America Planar Inverted-F Antenna Revenue Share (%), by Application 2025 & 2033
- Figure 4: North America Planar Inverted-F Antenna Revenue (million), by Types 2025 & 2033
- Figure 5: North America Planar Inverted-F Antenna Revenue Share (%), by Types 2025 & 2033
- Figure 6: North America Planar Inverted-F Antenna Revenue (million), by Country 2025 & 2033
- Figure 7: North America Planar Inverted-F Antenna Revenue Share (%), by Country 2025 & 2033
- Figure 8: South America Planar Inverted-F Antenna Revenue (million), by Application 2025 & 2033
- Figure 9: South America Planar Inverted-F Antenna Revenue Share (%), by Application 2025 & 2033
- Figure 10: South America Planar Inverted-F Antenna Revenue (million), by Types 2025 & 2033
- Figure 11: South America Planar Inverted-F Antenna Revenue Share (%), by Types 2025 & 2033
- Figure 12: South America Planar Inverted-F Antenna Revenue (million), by Country 2025 & 2033
- Figure 13: South America Planar Inverted-F Antenna Revenue Share (%), by Country 2025 & 2033
- Figure 14: Europe Planar Inverted-F Antenna Revenue (million), by Application 2025 & 2033
- Figure 15: Europe Planar Inverted-F Antenna Revenue Share (%), by Application 2025 & 2033
- Figure 16: Europe Planar Inverted-F Antenna Revenue (million), by Types 2025 & 2033
- Figure 17: Europe Planar Inverted-F Antenna Revenue Share (%), by Types 2025 & 2033
- Figure 18: Europe Planar Inverted-F Antenna Revenue (million), by Country 2025 & 2033
- Figure 19: Europe Planar Inverted-F Antenna Revenue Share (%), by Country 2025 & 2033
- Figure 20: Middle East & Africa Planar Inverted-F Antenna Revenue (million), by Application 2025 & 2033
- Figure 21: Middle East & Africa Planar Inverted-F Antenna Revenue Share (%), by Application 2025 & 2033
- Figure 22: Middle East & Africa Planar Inverted-F Antenna Revenue (million), by Types 2025 & 2033
- Figure 23: Middle East & Africa Planar Inverted-F Antenna Revenue Share (%), by Types 2025 & 2033
- Figure 24: Middle East & Africa Planar Inverted-F Antenna Revenue (million), by Country 2025 & 2033
- Figure 25: Middle East & Africa Planar Inverted-F Antenna Revenue Share (%), by Country 2025 & 2033
- Figure 26: Asia Pacific Planar Inverted-F Antenna Revenue (million), by Application 2025 & 2033
- Figure 27: Asia Pacific Planar Inverted-F Antenna Revenue Share (%), by Application 2025 & 2033
- Figure 28: Asia Pacific Planar Inverted-F Antenna Revenue (million), by Types 2025 & 2033
- Figure 29: Asia Pacific Planar Inverted-F Antenna Revenue Share (%), by Types 2025 & 2033
- Figure 30: Asia Pacific Planar Inverted-F Antenna Revenue (million), by Country 2025 & 2033
- Figure 31: Asia Pacific Planar Inverted-F Antenna Revenue Share (%), by Country 2025 & 2033
List of Tables
- Table 1: Global Planar Inverted-F Antenna Revenue million Forecast, by Application 2020 & 2033
- Table 2: Global Planar Inverted-F Antenna Revenue million Forecast, by Types 2020 & 2033
- Table 3: Global Planar Inverted-F Antenna Revenue million Forecast, by Region 2020 & 2033
- Table 4: Global Planar Inverted-F Antenna Revenue million Forecast, by Application 2020 & 2033
- Table 5: Global Planar Inverted-F Antenna Revenue million Forecast, by Types 2020 & 2033
- Table 6: Global Planar Inverted-F Antenna Revenue million Forecast, by Country 2020 & 2033
- Table 7: United States Planar Inverted-F Antenna Revenue (million) Forecast, by Application 2020 & 2033
- Table 8: Canada Planar Inverted-F Antenna Revenue (million) Forecast, by Application 2020 & 2033
- Table 9: Mexico Planar Inverted-F Antenna Revenue (million) Forecast, by Application 2020 & 2033
- Table 10: Global Planar Inverted-F Antenna Revenue million Forecast, by Application 2020 & 2033
- Table 11: Global Planar Inverted-F Antenna Revenue million Forecast, by Types 2020 & 2033
- Table 12: Global Planar Inverted-F Antenna Revenue million Forecast, by Country 2020 & 2033
- Table 13: Brazil Planar Inverted-F Antenna Revenue (million) Forecast, by Application 2020 & 2033
- Table 14: Argentina Planar Inverted-F Antenna Revenue (million) Forecast, by Application 2020 & 2033
- Table 15: Rest of South America Planar Inverted-F Antenna Revenue (million) Forecast, by Application 2020 & 2033
- Table 16: Global Planar Inverted-F Antenna Revenue million Forecast, by Application 2020 & 2033
- Table 17: Global Planar Inverted-F Antenna Revenue million Forecast, by Types 2020 & 2033
- Table 18: Global Planar Inverted-F Antenna Revenue million Forecast, by Country 2020 & 2033
- Table 19: United Kingdom Planar Inverted-F Antenna Revenue (million) Forecast, by Application 2020 & 2033
- Table 20: Germany Planar Inverted-F Antenna Revenue (million) Forecast, by Application 2020 & 2033
- Table 21: France Planar Inverted-F Antenna Revenue (million) Forecast, by Application 2020 & 2033
- Table 22: Italy Planar Inverted-F Antenna Revenue (million) Forecast, by Application 2020 & 2033
- Table 23: Spain Planar Inverted-F Antenna Revenue (million) Forecast, by Application 2020 & 2033
- Table 24: Russia Planar Inverted-F Antenna Revenue (million) Forecast, by Application 2020 & 2033
- Table 25: Benelux Planar Inverted-F Antenna Revenue (million) Forecast, by Application 2020 & 2033
- Table 26: Nordics Planar Inverted-F Antenna Revenue (million) Forecast, by Application 2020 & 2033
- Table 27: Rest of Europe Planar Inverted-F Antenna Revenue (million) Forecast, by Application 2020 & 2033
- Table 28: Global Planar Inverted-F Antenna Revenue million Forecast, by Application 2020 & 2033
- Table 29: Global Planar Inverted-F Antenna Revenue million Forecast, by Types 2020 & 2033
- Table 30: Global Planar Inverted-F Antenna Revenue million Forecast, by Country 2020 & 2033
- Table 31: Turkey Planar Inverted-F Antenna Revenue (million) Forecast, by Application 2020 & 2033
- Table 32: Israel Planar Inverted-F Antenna Revenue (million) Forecast, by Application 2020 & 2033
- Table 33: GCC Planar Inverted-F Antenna Revenue (million) Forecast, by Application 2020 & 2033
- Table 34: North Africa Planar Inverted-F Antenna Revenue (million) Forecast, by Application 2020 & 2033
- Table 35: South Africa Planar Inverted-F Antenna Revenue (million) Forecast, by Application 2020 & 2033
- Table 36: Rest of Middle East & Africa Planar Inverted-F Antenna Revenue (million) Forecast, by Application 2020 & 2033
- Table 37: Global Planar Inverted-F Antenna Revenue million Forecast, by Application 2020 & 2033
- Table 38: Global Planar Inverted-F Antenna Revenue million Forecast, by Types 2020 & 2033
- Table 39: Global Planar Inverted-F Antenna Revenue million Forecast, by Country 2020 & 2033
- Table 40: China Planar Inverted-F Antenna Revenue (million) Forecast, by Application 2020 & 2033
- Table 41: India Planar Inverted-F Antenna Revenue (million) Forecast, by Application 2020 & 2033
- Table 42: Japan Planar Inverted-F Antenna Revenue (million) Forecast, by Application 2020 & 2033
- Table 43: South Korea Planar Inverted-F Antenna Revenue (million) Forecast, by Application 2020 & 2033
- Table 44: ASEAN Planar Inverted-F Antenna Revenue (million) Forecast, by Application 2020 & 2033
- Table 45: Oceania Planar Inverted-F Antenna Revenue (million) Forecast, by Application 2020 & 2033
- Table 46: Rest of Asia Pacific Planar Inverted-F Antenna Revenue (million) Forecast, by Application 2020 & 2033
Frequently Asked Questions
1. What is the projected Compound Annual Growth Rate (CAGR) of the Planar Inverted-F Antenna?
The projected CAGR is approximately 14.1%.
2. Which companies are prominent players in the Planar Inverted-F Antenna?
Key companies in the market include Amphenol, Auden, Deman, Ethertronics, Galtronics, JESONcom, Luxshare Precision, Molex, Pulse, Shanghai Shenxun Communication Technology, Skycross, Sky-wave, Southstar, Speed, Sunway.
3. What are the main segments of the Planar Inverted-F Antenna?
The market segments include Application, Types.
4. Can you provide details about the market size?
The market size is estimated to be USD 1270.8 million as of 2022.
5. What are some drivers contributing to market growth?
N/A
6. What are the notable trends driving market growth?
N/A
7. Are there any restraints impacting market growth?
N/A
8. Can you provide examples of recent developments in the market?
N/A
9. What pricing options are available for accessing the report?
Pricing options include single-user, multi-user, and enterprise licenses priced at USD 4900.00, USD 7350.00, and USD 9800.00 respectively.
10. Is the market size provided in terms of value or volume?
The market size is provided in terms of value, measured in million.
11. Are there any specific market keywords associated with the report?
Yes, the market keyword associated with the report is "Planar Inverted-F Antenna," which aids in identifying and referencing the specific market segment covered.
12. How do I determine which pricing option suits my needs best?
The pricing options vary based on user requirements and access needs. Individual users may opt for single-user licenses, while businesses requiring broader access may choose multi-user or enterprise licenses for cost-effective access to the report.
13. Are there any additional resources or data provided in the Planar Inverted-F Antenna report?
While the report offers comprehensive insights, it's advisable to review the specific contents or supplementary materials provided to ascertain if additional resources or data are available.
14. How can I stay updated on further developments or reports in the Planar Inverted-F Antenna?
To stay informed about further developments, trends, and reports in the Planar Inverted-F Antenna, consider subscribing to industry newsletters, following relevant companies and organizations, or regularly checking reputable industry news sources and publications.
Methodology
Step 1 - Identification of Relevant Samples Size from Population Database


Step 2 - Approaches for Defining Global Market Size (Value, Volume* & Price*)

Note*: In applicable scenarios
Step 3 - Data Sources
Primary Research
- Web Analytics
- Survey Reports
- Research Institute
- Latest Research Reports
- Opinion Leaders
Secondary Research
- Annual Reports
- White Paper
- Latest Press Release
- Industry Association
- Paid Database
- Investor Presentations

Step 4 - Data Triangulation
Involves using different sources of information in order to increase the validity of a study
These sources are likely to be stakeholders in a program - participants, other researchers, program staff, other community members, and so on.
Then we put all data in single framework & apply various statistical tools to find out the dynamic on the market.
During the analysis stage, feedback from the stakeholder groups would be compared to determine areas of agreement as well as areas of divergence

