
Key Insights
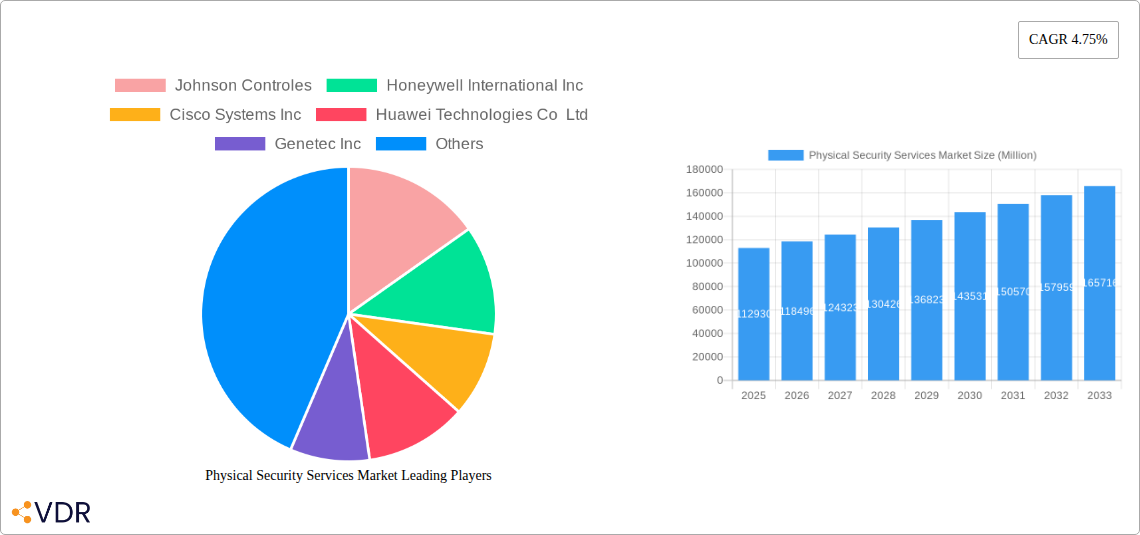
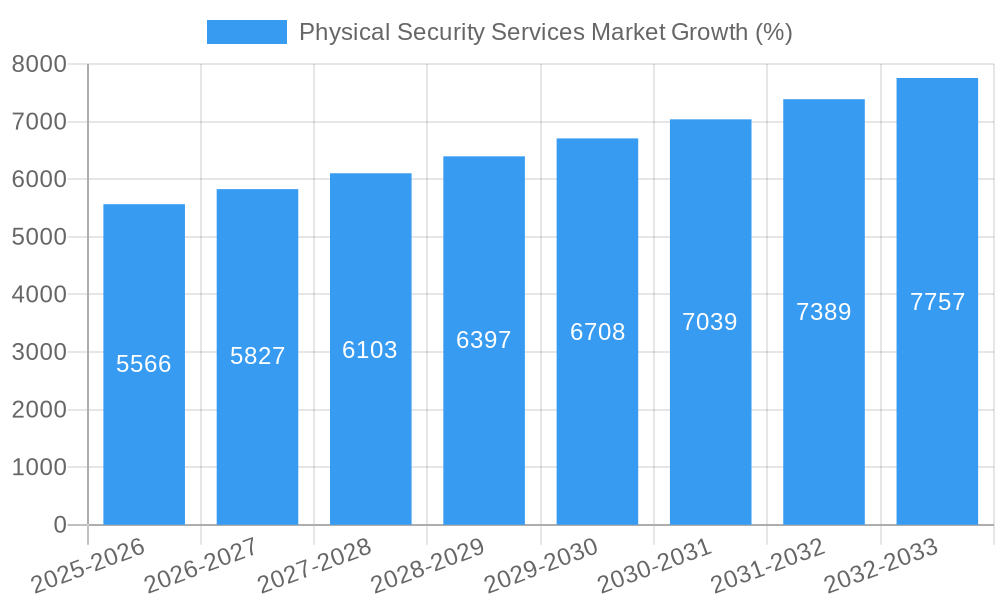
The global Physical Security Services market, valued at $112.93 billion in 2025, is projected to experience robust growth, driven by increasing concerns about security threats across various sectors. The compound annual growth rate (CAGR) of 4.75% from 2025 to 2033 indicates a substantial market expansion, reaching an estimated $165 billion by 2033. This growth is fueled by several key factors, including the rising adoption of advanced security technologies like video surveillance, access control systems, and intrusion detection systems. Furthermore, the increasing demand for integrated security solutions that combine various technologies and services is significantly boosting market expansion. Government initiatives promoting cybersecurity and public safety also contribute to market growth, particularly in regions with high crime rates or geopolitical instability. The market is segmented by service type (e.g., guarding, surveillance, consulting), technology (e.g., CCTV, biometric access control), and end-user (e.g., commercial, residential, government). Major players like Johnson Controls, Honeywell International Inc., and Cisco Systems Inc. are driving innovation and competition, leading to the development of more sophisticated and cost-effective solutions.
The market's growth, however, faces certain challenges. High implementation and maintenance costs of advanced security systems can be a barrier for smaller businesses. Concerns over data privacy and cybersecurity breaches also pose a significant restrain on market growth. Furthermore, the availability of skilled professionals to manage and maintain these complex systems remains a constraint in several regions. Despite these challenges, the long-term outlook for the Physical Security Services market remains positive. The ongoing digital transformation across all sectors and the increasing reliance on technology for security solutions are expected to drive sustained market expansion throughout the forecast period. The market will witness significant technological advancements, including the integration of artificial intelligence and machine learning to improve efficiency and effectiveness of security systems.
Physical Security Services Market: A Comprehensive Report (2019-2033)
This in-depth report provides a comprehensive analysis of the Physical Security Services Market, encompassing market dynamics, growth trends, regional dominance, product landscape, key players, and future outlook. The study period covers 2019-2033, with 2025 as the base and estimated year. The report segments the market into various categories to offer granular insights for strategic decision-making. The parent market is Security Services and the child market is Physical Security Services. This report is invaluable for investors, industry professionals, and anyone seeking to understand this rapidly evolving market. Market size is presented in Million USD.
Physical Security Services Market Dynamics & Structure
The Physical Security Services market is characterized by a moderately concentrated structure, with key players like Johnson Controls, Honeywell International Inc, and Cisco Systems Inc holding significant market share. However, the market also features numerous smaller, specialized providers. Technological innovation, particularly in areas like AI-powered surveillance, biometric access control, and integrated security platforms, is a major driver of growth. Stringent regulatory frameworks concerning data privacy and security compliance significantly influence market dynamics. The market experiences competitive pressure from product substitutes, such as cloud-based security solutions and open-source software. End-user demographics are diverse, encompassing government agencies, commercial businesses, and residential properties. Market consolidation is evident through mergers and acquisitions (M&A), with an estimated xx M&A deals completed in the historical period (2019-2024). The average deal size was approximately xx million USD.
- Market Concentration: Moderately concentrated, with top 5 players holding approximately xx% market share in 2024.
- Technological Innovation: AI, IoT, and biometric technologies are driving market growth and innovation.
- Regulatory Landscape: Compliance with data privacy regulations (GDPR, CCPA) is a key factor.
- Competitive Substitutes: Cloud-based security and open-source software pose a competitive threat.
- End-User Demographics: Government, commercial, and residential sectors represent major end-user segments.
- M&A Activity: Significant M&A activity observed, with xx deals recorded between 2019 and 2024, leading to increased market consolidation.
Physical Security Services Market Growth Trends & Insights
The global Physical Security Services market experienced robust growth during the historical period (2019-2024), with a Compound Annual Growth Rate (CAGR) of xx%. This growth is attributed to factors such as increasing security concerns across various sectors, rising adoption of advanced security technologies, and government initiatives promoting security infrastructure development. Market size reached xx million USD in 2024. Technological disruptions, such as the integration of Artificial Intelligence (AI) and the Internet of Things (IoT) into physical security systems, have significantly impacted market adoption rates and consumer behavior. Consumers are increasingly demanding more integrated and intelligent security solutions, leading to higher adoption rates for sophisticated security systems. The market is expected to continue its growth trajectory, with a projected CAGR of xx% during the forecast period (2025-2033), reaching an estimated market value of xx million USD by 2033. Market penetration is expected to increase from xx% in 2024 to xx% by 2033.
Dominant Regions, Countries, or Segments in Physical Security Services Market
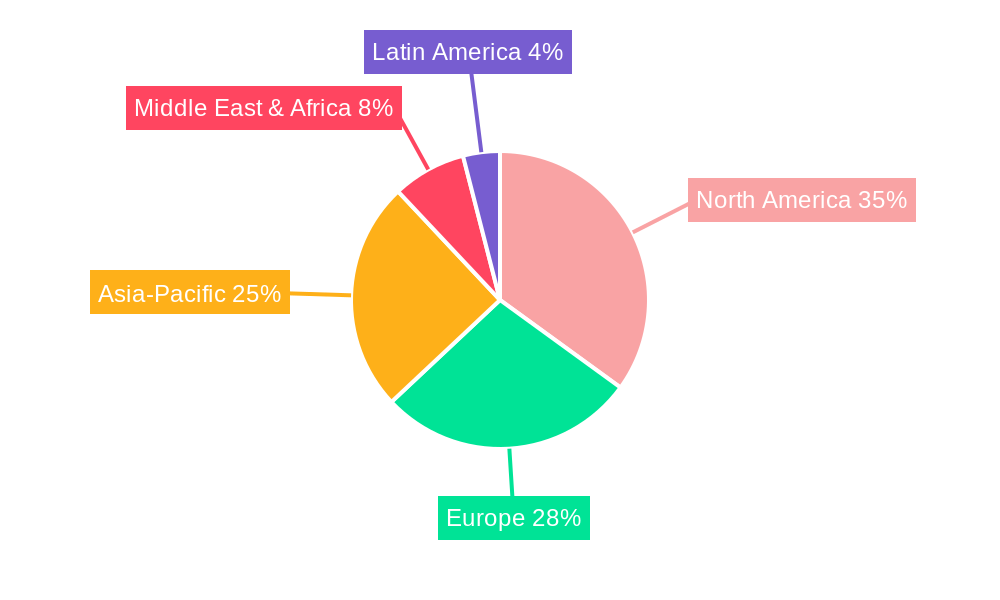
North America currently holds the largest market share in the Physical Security Services market, driven by robust economic growth, advanced technological infrastructure, and stringent security regulations. Europe follows as a significant market, exhibiting strong growth potential due to increasing adoption of advanced security technologies across various sectors. The Asia-Pacific region is anticipated to witness the fastest growth in the forecast period, fueled by rapid urbanization, expanding industrialization, and rising investments in security infrastructure.
- North America: High market share due to strong economic growth and high technological adoption.
- Europe: Significant market with growth driven by increasing security concerns and regulatory compliance needs.
- Asia-Pacific: Fastest-growing region, driven by urbanization, industrialization, and rising investments in security.
- Key Drivers: Government initiatives promoting infrastructure development, increasing security awareness, and rising disposable incomes.
Physical Security Services Market Product Landscape
The Physical Security Services market offers a diverse range of products, including video surveillance systems, access control systems, intrusion detection systems, and integrated security management platforms. Recent product innovations focus on enhancing functionalities through AI, IoT, and cloud integration, improving efficiency and effectiveness. These advancements offer enhanced features like real-time threat detection, predictive analytics, and remote monitoring capabilities. The market also witnesses continuous improvements in performance metrics, such as response times, accuracy, and reliability. Unique selling propositions often center on ease of use, scalability, and cost-effectiveness.
Key Drivers, Barriers & Challenges in Physical Security Services Market
Key Drivers:
- Increasing security threats across various sectors (cyberattacks, terrorism).
- Growing adoption of advanced security technologies (AI, IoT).
- Stringent government regulations and compliance requirements.
Key Challenges & Restraints:
- High initial investment costs for advanced security systems.
- Integration complexities with existing legacy systems.
- Skilled labor shortage in the security technology sector. This shortage impacts implementation and maintenance leading to a xx% increase in service costs in 2024.
- Data privacy concerns and regulatory compliance burdens.
Emerging Opportunities in Physical Security Services Market
- Growth in Smart Cities: Expanding smart city initiatives are creating opportunities for integrated security solutions.
- Rise of Cybersecurity Convergence: Increasing integration of physical and cybersecurity solutions.
- Advancements in Biometric Authentication: Improved accuracy and reliability of biometric technologies.
- Demand for Predictive Analytics: Adoption of AI for predictive security risk management.
Growth Accelerators in the Physical Security Services Market Industry
Technological advancements, especially in AI and IoT-driven security solutions, are major catalysts for long-term growth. Strategic partnerships and collaborations among technology providers and system integrators are expanding market reach and enhancing product offerings. Market expansion strategies targeting underserved sectors, such as healthcare and critical infrastructure, are creating significant growth opportunities.
Key Players Shaping the Physical Security Services Market Market
- Johnson Controls
- Honeywell International Inc
- Cisco Systems Inc
- Huawei Technologies Co Ltd
- Genetec Inc
- G4S
- Securitas
- Secom
- Prosegur
- Brinks
- Loomis
- Allied Barton
- Garda
- Relianc
Notable Milestones in Physical Security Services Market Sector
- May 2024: ZKTeco East Africa partners with Mart Networks Group Ltd, showcasing new products in time and attendance, access control, smart locks, and video surveillance. This partnership expands ZKTeco's market reach in East Africa.
- February 2024: ENSCO Inc. launches the Center for Critical Infrastructure Protection (CCIP), aiming to provide comprehensive cyber and physical security solutions to the Department of Defense (DoD). This initiative signals increasing demand for integrated security solutions within critical infrastructure.
In-Depth Physical Security Services Market Market Outlook
The Physical Security Services market is poised for continued robust growth, driven by technological innovation, increasing security awareness, and rising demand for advanced security solutions across various sectors. Strategic opportunities lie in developing innovative, integrated security platforms that address the evolving needs of diverse end-users. Expansion into emerging markets and strategic partnerships will be crucial for capturing market share and maximizing growth potential. The market's future is bright, with significant potential for expansion and technological advancements.
Physical Security Services Market Segmentation
-
1. Component
-
1.1. By Solution
- 1.1.1. Access Control System
- 1.1.2. Video Surveillance System
- 1.1.3. Security Scanning, Metal Detection, and Imaging
- 1.1.4. Fire and Life Safety
- 1.1.5. Others
-
1.2. By Service Type
- 1.2.1. Professional Services
- 1.2.2. Managed Services
-
1.1. By Solution
-
2. End User Industry
- 2.1. Manufacturing and Industrial
- 2.2. IT and Telecom
- 2.3. BFSI
- 2.4. Retail
- 2.5. Residential
- 2.6. Public Infrastructure (Airports, etc.)
- 2.7. Other End Users
Physical Security Services Market Segmentation By Geography
- 1. North America
- 2. Europe
- 3. Asia
- 4. Australia and New Zealand
- 5. Latin America
- 6. Middle East and Africa
Physical Security Services Market REPORT HIGHLIGHTS
| Aspects | Details |
|---|---|
| Study Period | 2019-2033 |
| Base Year | 2024 |
| Estimated Year | 2025 |
| Forecast Period | 2025-2033 |
| Historical Period | 2019-2024 |
| Growth Rate | CAGR of 4.75% from 2019-2033 |
| Segmentation |
|
Table of Contents
- 1. Introduction
- 1.1. Research Scope
- 1.2. Market Segmentation
- 1.3. Research Methodology
- 1.4. Definitions and Assumptions
- 2. Executive Summary
- 2.1. Introduction
- 3. Market Dynamics
- 3.1. Introduction
- 3.2. Market Drivers
- 3.2.1 Favorable Changes in Regulatory Standards have Prompted the Use of Security Services from the Organized Sector; Dynamic Nature of the Security Threats
- 3.2.2 Especially
- 3.2.3 has Contributed the Demand for Cash Services to Safeguard Cash Transit
- 3.3. Market Restrains
- 3.3.1 Favorable Changes in Regulatory Standards have Prompted the Use of Security Services from the Organized Sector; Dynamic Nature of the Security Threats
- 3.3.2 Especially
- 3.3.3 has Contributed the Demand for Cash Services to Safeguard Cash Transit
- 3.4. Market Trends
- 3.4.1. The Demand for Physical Security Services is Growing in the BSFI Sector
- 4. Market Factor Analysis
- 4.1. Porters Five Forces
- 4.2. Supply/Value Chain
- 4.3. PESTEL analysis
- 4.4. Market Entropy
- 4.5. Patent/Trademark Analysis
- 5. Global Physical Security Services Market Analysis, Insights and Forecast, 2019-2031
- 5.1. Market Analysis, Insights and Forecast - by Component
- 5.1.1. By Solution
- 5.1.1.1. Access Control System
- 5.1.1.2. Video Surveillance System
- 5.1.1.3. Security Scanning, Metal Detection, and Imaging
- 5.1.1.4. Fire and Life Safety
- 5.1.1.5. Others
- 5.1.2. By Service Type
- 5.1.2.1. Professional Services
- 5.1.2.2. Managed Services
- 5.1.1. By Solution
- 5.2. Market Analysis, Insights and Forecast - by End User Industry
- 5.2.1. Manufacturing and Industrial
- 5.2.2. IT and Telecom
- 5.2.3. BFSI
- 5.2.4. Retail
- 5.2.5. Residential
- 5.2.6. Public Infrastructure (Airports, etc.)
- 5.2.7. Other End Users
- 5.3. Market Analysis, Insights and Forecast - by Region
- 5.3.1. North America
- 5.3.2. Europe
- 5.3.3. Asia
- 5.3.4. Australia and New Zealand
- 5.3.5. Latin America
- 5.3.6. Middle East and Africa
- 5.1. Market Analysis, Insights and Forecast - by Component
- 6. North America Physical Security Services Market Analysis, Insights and Forecast, 2019-2031
- 6.1. Market Analysis, Insights and Forecast - by Component
- 6.1.1. By Solution
- 6.1.1.1. Access Control System
- 6.1.1.2. Video Surveillance System
- 6.1.1.3. Security Scanning, Metal Detection, and Imaging
- 6.1.1.4. Fire and Life Safety
- 6.1.1.5. Others
- 6.1.2. By Service Type
- 6.1.2.1. Professional Services
- 6.1.2.2. Managed Services
- 6.1.1. By Solution
- 6.2. Market Analysis, Insights and Forecast - by End User Industry
- 6.2.1. Manufacturing and Industrial
- 6.2.2. IT and Telecom
- 6.2.3. BFSI
- 6.2.4. Retail
- 6.2.5. Residential
- 6.2.6. Public Infrastructure (Airports, etc.)
- 6.2.7. Other End Users
- 6.1. Market Analysis, Insights and Forecast - by Component
- 7. Europe Physical Security Services Market Analysis, Insights and Forecast, 2019-2031
- 7.1. Market Analysis, Insights and Forecast - by Component
- 7.1.1. By Solution
- 7.1.1.1. Access Control System
- 7.1.1.2. Video Surveillance System
- 7.1.1.3. Security Scanning, Metal Detection, and Imaging
- 7.1.1.4. Fire and Life Safety
- 7.1.1.5. Others
- 7.1.2. By Service Type
- 7.1.2.1. Professional Services
- 7.1.2.2. Managed Services
- 7.1.1. By Solution
- 7.2. Market Analysis, Insights and Forecast - by End User Industry
- 7.2.1. Manufacturing and Industrial
- 7.2.2. IT and Telecom
- 7.2.3. BFSI
- 7.2.4. Retail
- 7.2.5. Residential
- 7.2.6. Public Infrastructure (Airports, etc.)
- 7.2.7. Other End Users
- 7.1. Market Analysis, Insights and Forecast - by Component
- 8. Asia Physical Security Services Market Analysis, Insights and Forecast, 2019-2031
- 8.1. Market Analysis, Insights and Forecast - by Component
- 8.1.1. By Solution
- 8.1.1.1. Access Control System
- 8.1.1.2. Video Surveillance System
- 8.1.1.3. Security Scanning, Metal Detection, and Imaging
- 8.1.1.4. Fire and Life Safety
- 8.1.1.5. Others
- 8.1.2. By Service Type
- 8.1.2.1. Professional Services
- 8.1.2.2. Managed Services
- 8.1.1. By Solution
- 8.2. Market Analysis, Insights and Forecast - by End User Industry
- 8.2.1. Manufacturing and Industrial
- 8.2.2. IT and Telecom
- 8.2.3. BFSI
- 8.2.4. Retail
- 8.2.5. Residential
- 8.2.6. Public Infrastructure (Airports, etc.)
- 8.2.7. Other End Users
- 8.1. Market Analysis, Insights and Forecast - by Component
- 9. Australia and New Zealand Physical Security Services Market Analysis, Insights and Forecast, 2019-2031
- 9.1. Market Analysis, Insights and Forecast - by Component
- 9.1.1. By Solution
- 9.1.1.1. Access Control System
- 9.1.1.2. Video Surveillance System
- 9.1.1.3. Security Scanning, Metal Detection, and Imaging
- 9.1.1.4. Fire and Life Safety
- 9.1.1.5. Others
- 9.1.2. By Service Type
- 9.1.2.1. Professional Services
- 9.1.2.2. Managed Services
- 9.1.1. By Solution
- 9.2. Market Analysis, Insights and Forecast - by End User Industry
- 9.2.1. Manufacturing and Industrial
- 9.2.2. IT and Telecom
- 9.2.3. BFSI
- 9.2.4. Retail
- 9.2.5. Residential
- 9.2.6. Public Infrastructure (Airports, etc.)
- 9.2.7. Other End Users
- 9.1. Market Analysis, Insights and Forecast - by Component
- 10. Latin America Physical Security Services Market Analysis, Insights and Forecast, 2019-2031
- 10.1. Market Analysis, Insights and Forecast - by Component
- 10.1.1. By Solution
- 10.1.1.1. Access Control System
- 10.1.1.2. Video Surveillance System
- 10.1.1.3. Security Scanning, Metal Detection, and Imaging
- 10.1.1.4. Fire and Life Safety
- 10.1.1.5. Others
- 10.1.2. By Service Type
- 10.1.2.1. Professional Services
- 10.1.2.2. Managed Services
- 10.1.1. By Solution
- 10.2. Market Analysis, Insights and Forecast - by End User Industry
- 10.2.1. Manufacturing and Industrial
- 10.2.2. IT and Telecom
- 10.2.3. BFSI
- 10.2.4. Retail
- 10.2.5. Residential
- 10.2.6. Public Infrastructure (Airports, etc.)
- 10.2.7. Other End Users
- 10.1. Market Analysis, Insights and Forecast - by Component
- 11. Middle East and Africa Physical Security Services Market Analysis, Insights and Forecast, 2019-2031
- 11.1. Market Analysis, Insights and Forecast - by Component
- 11.1.1. By Solution
- 11.1.1.1. Access Control System
- 11.1.1.2. Video Surveillance System
- 11.1.1.3. Security Scanning, Metal Detection, and Imaging
- 11.1.1.4. Fire and Life Safety
- 11.1.1.5. Others
- 11.1.2. By Service Type
- 11.1.2.1. Professional Services
- 11.1.2.2. Managed Services
- 11.1.1. By Solution
- 11.2. Market Analysis, Insights and Forecast - by End User Industry
- 11.2.1. Manufacturing and Industrial
- 11.2.2. IT and Telecom
- 11.2.3. BFSI
- 11.2.4. Retail
- 11.2.5. Residential
- 11.2.6. Public Infrastructure (Airports, etc.)
- 11.2.7. Other End Users
- 11.1. Market Analysis, Insights and Forecast - by Component
- 12. Competitive Analysis
- 12.1. Global Market Share Analysis 2024
- 12.2. Company Profiles
- 12.2.1 Johnson Controles
- 12.2.1.1. Overview
- 12.2.1.2. Products
- 12.2.1.3. SWOT Analysis
- 12.2.1.4. Recent Developments
- 12.2.1.5. Financials (Based on Availability)
- 12.2.2 Honeywell International Inc
- 12.2.2.1. Overview
- 12.2.2.2. Products
- 12.2.2.3. SWOT Analysis
- 12.2.2.4. Recent Developments
- 12.2.2.5. Financials (Based on Availability)
- 12.2.3 Cisco Systems Inc
- 12.2.3.1. Overview
- 12.2.3.2. Products
- 12.2.3.3. SWOT Analysis
- 12.2.3.4. Recent Developments
- 12.2.3.5. Financials (Based on Availability)
- 12.2.4 Huawei Technologies Co Ltd
- 12.2.4.1. Overview
- 12.2.4.2. Products
- 12.2.4.3. SWOT Analysis
- 12.2.4.4. Recent Developments
- 12.2.4.5. Financials (Based on Availability)
- 12.2.5 Genetec Inc
- 12.2.5.1. Overview
- 12.2.5.2. Products
- 12.2.5.3. SWOT Analysis
- 12.2.5.4. Recent Developments
- 12.2.5.5. Financials (Based on Availability)
- 12.2.6 G4S
- 12.2.6.1. Overview
- 12.2.6.2. Products
- 12.2.6.3. SWOT Analysis
- 12.2.6.4. Recent Developments
- 12.2.6.5. Financials (Based on Availability)
- 12.2.7 Securitas
- 12.2.7.1. Overview
- 12.2.7.2. Products
- 12.2.7.3. SWOT Analysis
- 12.2.7.4. Recent Developments
- 12.2.7.5. Financials (Based on Availability)
- 12.2.8 Secom
- 12.2.8.1. Overview
- 12.2.8.2. Products
- 12.2.8.3. SWOT Analysis
- 12.2.8.4. Recent Developments
- 12.2.8.5. Financials (Based on Availability)
- 12.2.9 Prosegur
- 12.2.9.1. Overview
- 12.2.9.2. Products
- 12.2.9.3. SWOT Analysis
- 12.2.9.4. Recent Developments
- 12.2.9.5. Financials (Based on Availability)
- 12.2.10 Brinks
- 12.2.10.1. Overview
- 12.2.10.2. Products
- 12.2.10.3. SWOT Analysis
- 12.2.10.4. Recent Developments
- 12.2.10.5. Financials (Based on Availability)
- 12.2.11 Loomis
- 12.2.11.1. Overview
- 12.2.11.2. Products
- 12.2.11.3. SWOT Analysis
- 12.2.11.4. Recent Developments
- 12.2.11.5. Financials (Based on Availability)
- 12.2.12 Allied Barton
- 12.2.12.1. Overview
- 12.2.12.2. Products
- 12.2.12.3. SWOT Analysis
- 12.2.12.4. Recent Developments
- 12.2.12.5. Financials (Based on Availability)
- 12.2.13 Garda
- 12.2.13.1. Overview
- 12.2.13.2. Products
- 12.2.13.3. SWOT Analysis
- 12.2.13.4. Recent Developments
- 12.2.13.5. Financials (Based on Availability)
- 12.2.14 Relianc
- 12.2.14.1. Overview
- 12.2.14.2. Products
- 12.2.14.3. SWOT Analysis
- 12.2.14.4. Recent Developments
- 12.2.14.5. Financials (Based on Availability)
- 12.2.1 Johnson Controles
List of Figures
- Figure 1: Global Physical Security Services Market Revenue Breakdown (Million, %) by Region 2024 & 2032
- Figure 2: Global Physical Security Services Market Volume Breakdown (Billion, %) by Region 2024 & 2032
- Figure 3: North America Physical Security Services Market Revenue (Million), by Component 2024 & 2032
- Figure 4: North America Physical Security Services Market Volume (Billion), by Component 2024 & 2032
- Figure 5: North America Physical Security Services Market Revenue Share (%), by Component 2024 & 2032
- Figure 6: North America Physical Security Services Market Volume Share (%), by Component 2024 & 2032
- Figure 7: North America Physical Security Services Market Revenue (Million), by End User Industry 2024 & 2032
- Figure 8: North America Physical Security Services Market Volume (Billion), by End User Industry 2024 & 2032
- Figure 9: North America Physical Security Services Market Revenue Share (%), by End User Industry 2024 & 2032
- Figure 10: North America Physical Security Services Market Volume Share (%), by End User Industry 2024 & 2032
- Figure 11: North America Physical Security Services Market Revenue (Million), by Country 2024 & 2032
- Figure 12: North America Physical Security Services Market Volume (Billion), by Country 2024 & 2032
- Figure 13: North America Physical Security Services Market Revenue Share (%), by Country 2024 & 2032
- Figure 14: North America Physical Security Services Market Volume Share (%), by Country 2024 & 2032
- Figure 15: Europe Physical Security Services Market Revenue (Million), by Component 2024 & 2032
- Figure 16: Europe Physical Security Services Market Volume (Billion), by Component 2024 & 2032
- Figure 17: Europe Physical Security Services Market Revenue Share (%), by Component 2024 & 2032
- Figure 18: Europe Physical Security Services Market Volume Share (%), by Component 2024 & 2032
- Figure 19: Europe Physical Security Services Market Revenue (Million), by End User Industry 2024 & 2032
- Figure 20: Europe Physical Security Services Market Volume (Billion), by End User Industry 2024 & 2032
- Figure 21: Europe Physical Security Services Market Revenue Share (%), by End User Industry 2024 & 2032
- Figure 22: Europe Physical Security Services Market Volume Share (%), by End User Industry 2024 & 2032
- Figure 23: Europe Physical Security Services Market Revenue (Million), by Country 2024 & 2032
- Figure 24: Europe Physical Security Services Market Volume (Billion), by Country 2024 & 2032
- Figure 25: Europe Physical Security Services Market Revenue Share (%), by Country 2024 & 2032
- Figure 26: Europe Physical Security Services Market Volume Share (%), by Country 2024 & 2032
- Figure 27: Asia Physical Security Services Market Revenue (Million), by Component 2024 & 2032
- Figure 28: Asia Physical Security Services Market Volume (Billion), by Component 2024 & 2032
- Figure 29: Asia Physical Security Services Market Revenue Share (%), by Component 2024 & 2032
- Figure 30: Asia Physical Security Services Market Volume Share (%), by Component 2024 & 2032
- Figure 31: Asia Physical Security Services Market Revenue (Million), by End User Industry 2024 & 2032
- Figure 32: Asia Physical Security Services Market Volume (Billion), by End User Industry 2024 & 2032
- Figure 33: Asia Physical Security Services Market Revenue Share (%), by End User Industry 2024 & 2032
- Figure 34: Asia Physical Security Services Market Volume Share (%), by End User Industry 2024 & 2032
- Figure 35: Asia Physical Security Services Market Revenue (Million), by Country 2024 & 2032
- Figure 36: Asia Physical Security Services Market Volume (Billion), by Country 2024 & 2032
- Figure 37: Asia Physical Security Services Market Revenue Share (%), by Country 2024 & 2032
- Figure 38: Asia Physical Security Services Market Volume Share (%), by Country 2024 & 2032
- Figure 39: Australia and New Zealand Physical Security Services Market Revenue (Million), by Component 2024 & 2032
- Figure 40: Australia and New Zealand Physical Security Services Market Volume (Billion), by Component 2024 & 2032
- Figure 41: Australia and New Zealand Physical Security Services Market Revenue Share (%), by Component 2024 & 2032
- Figure 42: Australia and New Zealand Physical Security Services Market Volume Share (%), by Component 2024 & 2032
- Figure 43: Australia and New Zealand Physical Security Services Market Revenue (Million), by End User Industry 2024 & 2032
- Figure 44: Australia and New Zealand Physical Security Services Market Volume (Billion), by End User Industry 2024 & 2032
- Figure 45: Australia and New Zealand Physical Security Services Market Revenue Share (%), by End User Industry 2024 & 2032
- Figure 46: Australia and New Zealand Physical Security Services Market Volume Share (%), by End User Industry 2024 & 2032
- Figure 47: Australia and New Zealand Physical Security Services Market Revenue (Million), by Country 2024 & 2032
- Figure 48: Australia and New Zealand Physical Security Services Market Volume (Billion), by Country 2024 & 2032
- Figure 49: Australia and New Zealand Physical Security Services Market Revenue Share (%), by Country 2024 & 2032
- Figure 50: Australia and New Zealand Physical Security Services Market Volume Share (%), by Country 2024 & 2032
- Figure 51: Latin America Physical Security Services Market Revenue (Million), by Component 2024 & 2032
- Figure 52: Latin America Physical Security Services Market Volume (Billion), by Component 2024 & 2032
- Figure 53: Latin America Physical Security Services Market Revenue Share (%), by Component 2024 & 2032
- Figure 54: Latin America Physical Security Services Market Volume Share (%), by Component 2024 & 2032
- Figure 55: Latin America Physical Security Services Market Revenue (Million), by End User Industry 2024 & 2032
- Figure 56: Latin America Physical Security Services Market Volume (Billion), by End User Industry 2024 & 2032
- Figure 57: Latin America Physical Security Services Market Revenue Share (%), by End User Industry 2024 & 2032
- Figure 58: Latin America Physical Security Services Market Volume Share (%), by End User Industry 2024 & 2032
- Figure 59: Latin America Physical Security Services Market Revenue (Million), by Country 2024 & 2032
- Figure 60: Latin America Physical Security Services Market Volume (Billion), by Country 2024 & 2032
- Figure 61: Latin America Physical Security Services Market Revenue Share (%), by Country 2024 & 2032
- Figure 62: Latin America Physical Security Services Market Volume Share (%), by Country 2024 & 2032
- Figure 63: Middle East and Africa Physical Security Services Market Revenue (Million), by Component 2024 & 2032
- Figure 64: Middle East and Africa Physical Security Services Market Volume (Billion), by Component 2024 & 2032
- Figure 65: Middle East and Africa Physical Security Services Market Revenue Share (%), by Component 2024 & 2032
- Figure 66: Middle East and Africa Physical Security Services Market Volume Share (%), by Component 2024 & 2032
- Figure 67: Middle East and Africa Physical Security Services Market Revenue (Million), by End User Industry 2024 & 2032
- Figure 68: Middle East and Africa Physical Security Services Market Volume (Billion), by End User Industry 2024 & 2032
- Figure 69: Middle East and Africa Physical Security Services Market Revenue Share (%), by End User Industry 2024 & 2032
- Figure 70: Middle East and Africa Physical Security Services Market Volume Share (%), by End User Industry 2024 & 2032
- Figure 71: Middle East and Africa Physical Security Services Market Revenue (Million), by Country 2024 & 2032
- Figure 72: Middle East and Africa Physical Security Services Market Volume (Billion), by Country 2024 & 2032
- Figure 73: Middle East and Africa Physical Security Services Market Revenue Share (%), by Country 2024 & 2032
- Figure 74: Middle East and Africa Physical Security Services Market Volume Share (%), by Country 2024 & 2032
List of Tables
- Table 1: Global Physical Security Services Market Revenue Million Forecast, by Region 2019 & 2032
- Table 2: Global Physical Security Services Market Volume Billion Forecast, by Region 2019 & 2032
- Table 3: Global Physical Security Services Market Revenue Million Forecast, by Component 2019 & 2032
- Table 4: Global Physical Security Services Market Volume Billion Forecast, by Component 2019 & 2032
- Table 5: Global Physical Security Services Market Revenue Million Forecast, by End User Industry 2019 & 2032
- Table 6: Global Physical Security Services Market Volume Billion Forecast, by End User Industry 2019 & 2032
- Table 7: Global Physical Security Services Market Revenue Million Forecast, by Region 2019 & 2032
- Table 8: Global Physical Security Services Market Volume Billion Forecast, by Region 2019 & 2032
- Table 9: Global Physical Security Services Market Revenue Million Forecast, by Component 2019 & 2032
- Table 10: Global Physical Security Services Market Volume Billion Forecast, by Component 2019 & 2032
- Table 11: Global Physical Security Services Market Revenue Million Forecast, by End User Industry 2019 & 2032
- Table 12: Global Physical Security Services Market Volume Billion Forecast, by End User Industry 2019 & 2032
- Table 13: Global Physical Security Services Market Revenue Million Forecast, by Country 2019 & 2032
- Table 14: Global Physical Security Services Market Volume Billion Forecast, by Country 2019 & 2032
- Table 15: Global Physical Security Services Market Revenue Million Forecast, by Component 2019 & 2032
- Table 16: Global Physical Security Services Market Volume Billion Forecast, by Component 2019 & 2032
- Table 17: Global Physical Security Services Market Revenue Million Forecast, by End User Industry 2019 & 2032
- Table 18: Global Physical Security Services Market Volume Billion Forecast, by End User Industry 2019 & 2032
- Table 19: Global Physical Security Services Market Revenue Million Forecast, by Country 2019 & 2032
- Table 20: Global Physical Security Services Market Volume Billion Forecast, by Country 2019 & 2032
- Table 21: Global Physical Security Services Market Revenue Million Forecast, by Component 2019 & 2032
- Table 22: Global Physical Security Services Market Volume Billion Forecast, by Component 2019 & 2032
- Table 23: Global Physical Security Services Market Revenue Million Forecast, by End User Industry 2019 & 2032
- Table 24: Global Physical Security Services Market Volume Billion Forecast, by End User Industry 2019 & 2032
- Table 25: Global Physical Security Services Market Revenue Million Forecast, by Country 2019 & 2032
- Table 26: Global Physical Security Services Market Volume Billion Forecast, by Country 2019 & 2032
- Table 27: Global Physical Security Services Market Revenue Million Forecast, by Component 2019 & 2032
- Table 28: Global Physical Security Services Market Volume Billion Forecast, by Component 2019 & 2032
- Table 29: Global Physical Security Services Market Revenue Million Forecast, by End User Industry 2019 & 2032
- Table 30: Global Physical Security Services Market Volume Billion Forecast, by End User Industry 2019 & 2032
- Table 31: Global Physical Security Services Market Revenue Million Forecast, by Country 2019 & 2032
- Table 32: Global Physical Security Services Market Volume Billion Forecast, by Country 2019 & 2032
- Table 33: Global Physical Security Services Market Revenue Million Forecast, by Component 2019 & 2032
- Table 34: Global Physical Security Services Market Volume Billion Forecast, by Component 2019 & 2032
- Table 35: Global Physical Security Services Market Revenue Million Forecast, by End User Industry 2019 & 2032
- Table 36: Global Physical Security Services Market Volume Billion Forecast, by End User Industry 2019 & 2032
- Table 37: Global Physical Security Services Market Revenue Million Forecast, by Country 2019 & 2032
- Table 38: Global Physical Security Services Market Volume Billion Forecast, by Country 2019 & 2032
- Table 39: Global Physical Security Services Market Revenue Million Forecast, by Component 2019 & 2032
- Table 40: Global Physical Security Services Market Volume Billion Forecast, by Component 2019 & 2032
- Table 41: Global Physical Security Services Market Revenue Million Forecast, by End User Industry 2019 & 2032
- Table 42: Global Physical Security Services Market Volume Billion Forecast, by End User Industry 2019 & 2032
- Table 43: Global Physical Security Services Market Revenue Million Forecast, by Country 2019 & 2032
- Table 44: Global Physical Security Services Market Volume Billion Forecast, by Country 2019 & 2032
Frequently Asked Questions
1. What is the projected Compound Annual Growth Rate (CAGR) of the Physical Security Services Market?
The projected CAGR is approximately 4.75%.
2. Which companies are prominent players in the Physical Security Services Market?
Key companies in the market include Johnson Controles, Honeywell International Inc, Cisco Systems Inc, Huawei Technologies Co Ltd, Genetec Inc, G4S, Securitas, Secom, Prosegur, Brinks, Loomis, Allied Barton, Garda, Relianc.
3. What are the main segments of the Physical Security Services Market?
The market segments include Component, End User Industry.
4. Can you provide details about the market size?
The market size is estimated to be USD 112.93 Million as of 2022.
5. What are some drivers contributing to market growth?
Favorable Changes in Regulatory Standards have Prompted the Use of Security Services from the Organized Sector; Dynamic Nature of the Security Threats. Especially. has Contributed the Demand for Cash Services to Safeguard Cash Transit.
6. What are the notable trends driving market growth?
The Demand for Physical Security Services is Growing in the BSFI Sector.
7. Are there any restraints impacting market growth?
Favorable Changes in Regulatory Standards have Prompted the Use of Security Services from the Organized Sector; Dynamic Nature of the Security Threats. Especially. has Contributed the Demand for Cash Services to Safeguard Cash Transit.
8. Can you provide examples of recent developments in the market?
May 2024: ZKTeco East Africa, a company providing security technology solutions, announced its partnership with Mart Networks Group Ltd at a security technology conference. ZKTecho showcased its newly launched products and solutions, including time and attendance, access control, smart locks, and video surveillance management. It also explores the potential and capabilities of ZKDigimax in digital advertising and displays cutting-edge physical security solutions from Armatura.
9. What pricing options are available for accessing the report?
Pricing options include single-user, multi-user, and enterprise licenses priced at USD 4750, USD 5250, and USD 8750 respectively.
10. Is the market size provided in terms of value or volume?
The market size is provided in terms of value, measured in Million and volume, measured in Billion.
11. Are there any specific market keywords associated with the report?
Yes, the market keyword associated with the report is "Physical Security Services Market," which aids in identifying and referencing the specific market segment covered.
12. How do I determine which pricing option suits my needs best?
The pricing options vary based on user requirements and access needs. Individual users may opt for single-user licenses, while businesses requiring broader access may choose multi-user or enterprise licenses for cost-effective access to the report.
13. Are there any additional resources or data provided in the Physical Security Services Market report?
While the report offers comprehensive insights, it's advisable to review the specific contents or supplementary materials provided to ascertain if additional resources or data are available.
14. How can I stay updated on further developments or reports in the Physical Security Services Market?
To stay informed about further developments, trends, and reports in the Physical Security Services Market, consider subscribing to industry newsletters, following relevant companies and organizations, or regularly checking reputable industry news sources and publications.
Methodology
Step 1 - Identification of Relevant Samples Size from Population Database


Step 2 - Approaches for Defining Global Market Size (Value, Volume* & Price*)

Note*: In applicable scenarios
Step 3 - Data Sources
Primary Research
- Web Analytics
- Survey Reports
- Research Institute
- Latest Research Reports
- Opinion Leaders
Secondary Research
- Annual Reports
- White Paper
- Latest Press Release
- Industry Association
- Paid Database
- Investor Presentations

Step 4 - Data Triangulation
Involves using different sources of information in order to increase the validity of a study
These sources are likely to be stakeholders in a program - participants, other researchers, program staff, other community members, and so on.
Then we put all data in single framework & apply various statistical tools to find out the dynamic on the market.
During the analysis stage, feedback from the stakeholder groups would be compared to determine areas of agreement as well as areas of divergence


