

Key Insights
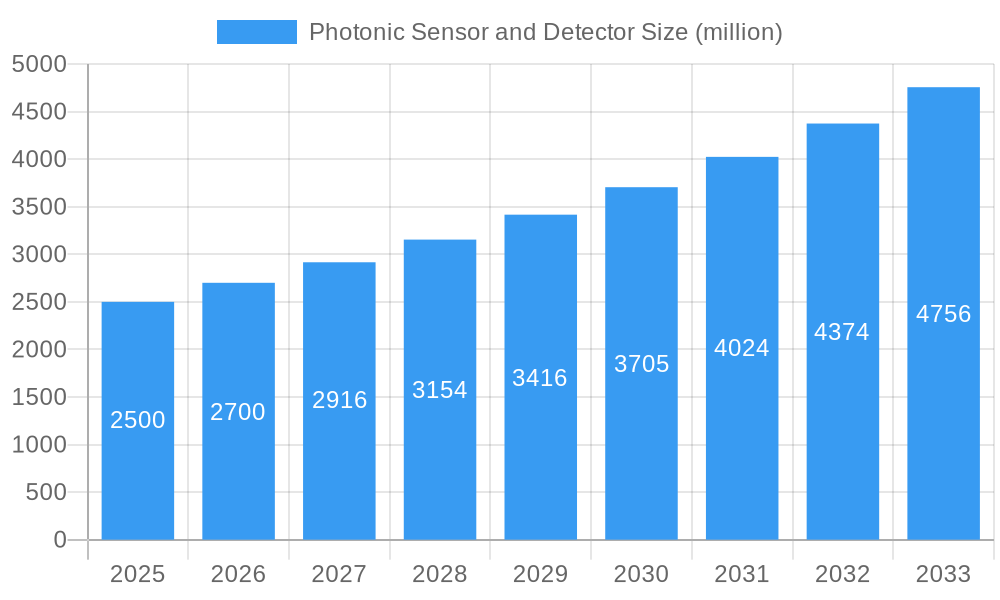
The global photonic sensor and detector market is poised for significant expansion, driven by escalating demand across healthcare, automotive, and industrial automation sectors. Technological advancements in miniaturization, sensitivity, and functionality are primary growth drivers. Increased adoption of precision sensing in advanced manufacturing, coupled with the need for non-contact and real-time monitoring, fuels this market's trajectory. The integration of photonic sensors and detectors into smart devices and IoT ecosystems further amplifies growth. The market size is projected to reach $27.95 billion by 2025, with a Compound Annual Growth Rate (CAGR) of 14.5%. This growth is propelled by continuous innovation and expanding industry applications.
Photonic Sensor and Detector Market Size (In Billion)
Market segmentation highlights substantial opportunities within key applications. The healthcare sector's increasing reliance on minimally invasive procedures and advanced diagnostics drives demand for high-precision photonic sensors in medical imaging and biosensing. The automotive industry's pursuit of advanced driver-assistance systems (ADAS) and autonomous driving is boosting the adoption of lidar and other photonic sensing technologies. Potential restraints include high initial investment costs and the requirement for specialized expertise, posing challenges for market entrants. Intense competition necessitates strategic partnerships, mergers and acquisitions, and sustained research and development for sustained success in this dynamic landscape.
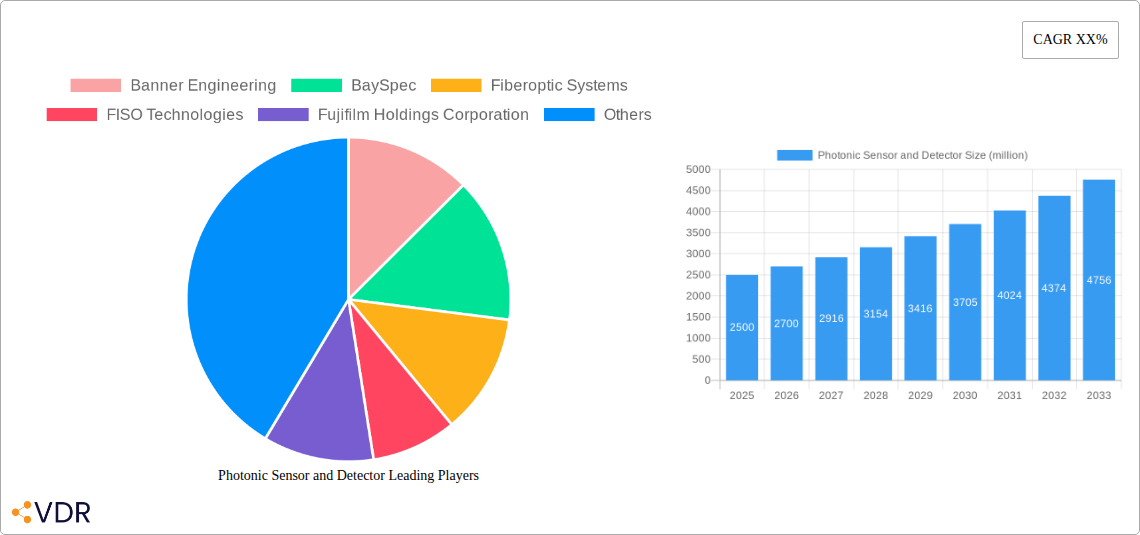
Photonic Sensor and Detector Company Market Share
Photonic Sensor and Detector Market Report: 2019-2033
This comprehensive report provides an in-depth analysis of the Photonic Sensor and Detector market, encompassing market dynamics, growth trends, regional dominance, product landscape, key players, and future outlook. The study period spans from 2019 to 2033, with 2025 serving as the base and estimated year. The report leverages extensive market research and data analysis to offer actionable insights for industry professionals, investors, and strategic decision-makers. The global market size in 2025 is estimated at xx million units.
Photonic Sensor and Detector Market Dynamics & Structure
The Photonic Sensor and Detector market is characterized by moderate concentration, with key players holding significant market share. Technological innovation, driven by advancements in fiber optics, semiconductor lasers, and integrated photonics, is a major growth driver. Stringent regulatory frameworks concerning safety and performance standards influence market dynamics. Competitive pressures arise from alternative sensing technologies, such as capacitive and inductive sensors. The market is witnessing significant M&A activity, aiming to expand product portfolios and geographical reach. The parent market is the broader optical sensor market, while child markets include industrial automation, healthcare, and telecommunications.
- Market Concentration: Moderately concentrated, with top 5 players holding approximately xx% market share in 2025.
- Technological Innovation: Significant advancements in miniaturization, sensitivity, and cost-effectiveness are driving growth.
- Regulatory Framework: Compliance with safety and performance standards is crucial and varies across regions.
- Competitive Substitutes: Capacitive, inductive, and ultrasonic sensors present competitive challenges.
- End-User Demographics: Dominated by industrial automation, automotive, healthcare, and telecommunications sectors.
- M&A Trends: Increasing consolidation through mergers and acquisitions to enhance market position and product offerings. xx M&A deals recorded between 2019 and 2024.
Photonic Sensor and Detector Growth Trends & Insights
The Photonic Sensor and Detector market exhibits robust growth, driven by increasing demand across various applications. The market witnessed a CAGR of xx% during the historical period (2019-2024) and is projected to maintain a CAGR of xx% during the forecast period (2025-2033). This growth is fueled by technological advancements enabling higher sensitivity, faster response times, and improved cost-effectiveness. Adoption rates are increasing across industries owing to the advantages offered by photonic sensors over traditional technologies in terms of precision, reliability, and non-contact measurement capabilities. Consumer behavior shifts towards automation and data-driven decision-making further contribute to market expansion. Market penetration is currently at xx% and is expected to reach xx% by 2033. Increased investment in R&D and the emergence of novel applications, such as LiDAR for autonomous vehicles, further propel market growth.
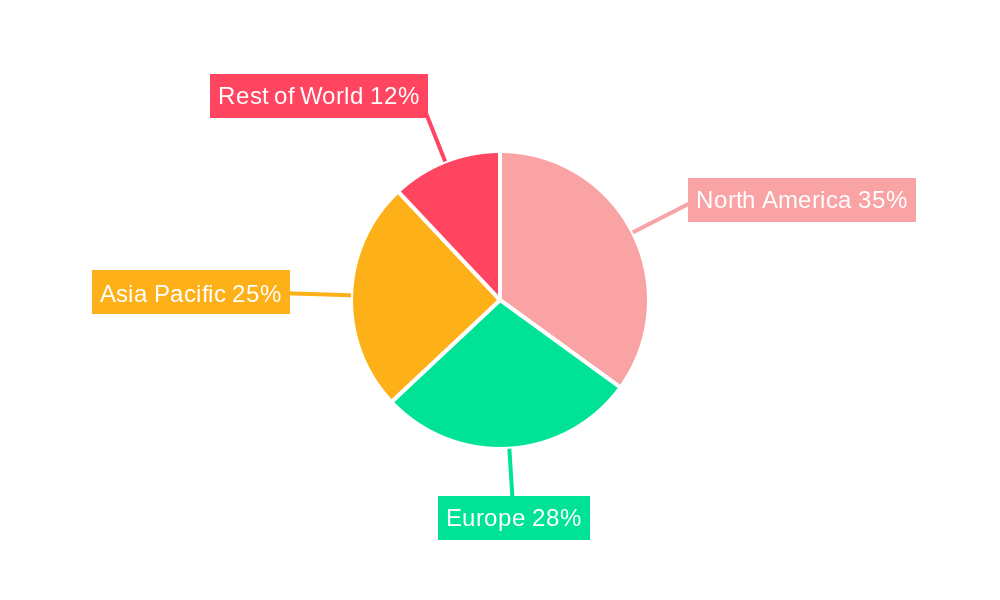
Dominant Regions, Countries, or Segments in Photonic Sensor and Detector
North America currently holds the largest market share in the Photonic Sensor and Detector market, driven by robust industrial automation and strong technological innovation. Asia-Pacific is expected to witness the fastest growth rate during the forecast period, fueled by significant investments in infrastructure development and the expanding manufacturing sector in countries like China and Japan. The industrial automation segment is the largest contributor to market revenue, followed by the healthcare and telecommunications segments.
- North America: Strong presence of key players, high adoption rates in industrial automation, and supportive regulatory frameworks.
- Asia-Pacific: Rapid industrialization, increasing investments in infrastructure, and expanding telecommunications networks fuel growth.
- Europe: Significant presence in automotive and healthcare sectors.
- Industrial Automation: High demand for precision sensing in manufacturing processes.
- Healthcare: Increasing adoption in medical imaging and diagnostics.
- Telecommunications: Demand for high-speed optical communication systems.
Photonic Sensor and Detector Product Landscape
Photonic sensor and detector technology encompasses a wide range of products, including fiber optic sensors, semiconductor lasers, photodetectors, and integrated photonic circuits. Innovations focus on enhancing sensitivity, miniaturization, and cost-effectiveness. Unique selling propositions include superior precision, non-contact measurement capabilities, and resistance to electromagnetic interference. Advancements in materials science and fabrication techniques continuously improve the performance metrics of these devices.
Key Drivers, Barriers & Challenges in Photonic Sensor and Detector
Key Drivers:
- Increasing automation across industries.
- Advancements in fiber optic technology.
- Growing demand for high-precision measurement.
- Government initiatives promoting technological advancements.
Challenges and Restraints:
- High initial investment costs for some photonic sensor technologies.
- Limited awareness of photonic sensor capabilities in certain industries.
- Dependence on specialized manufacturing processes can lead to supply chain disruptions, impacting the market by xx million units annually.
- Stringent regulatory compliance in specific sectors.
Emerging Opportunities in Photonic Sensor and Detector
Emerging opportunities include the integration of photonic sensors in advanced driver-assistance systems (ADAS) and autonomous vehicles (LiDAR). The development of cost-effective photonic sensors for environmental monitoring and smart agriculture presents significant potential. Expansion into untapped markets, such as consumer electronics and wearable technology, offers further growth opportunities.
Growth Accelerators in the Photonic Sensor and Detector Industry
Technological breakthroughs, strategic partnerships between sensor manufacturers and system integrators, and expanding market penetration across diverse industry verticals are key catalysts driving long-term growth. Development of novel materials and fabrication techniques continues to enhance the performance and cost-effectiveness of photonic sensors and detectors, fostering wider adoption and market expansion.
Key Players Shaping the Photonic Sensor and Detector Market
Notable Milestones in Photonic Sensor and Detector Sector
- 2020: Launch of a highly sensitive near-infrared photonic sensor by Hamamatsu Photonics.
- 2021: Acquisition of a smaller sensor company by Honeywell International, expanding their product portfolio.
- 2022: Introduction of a miniaturized photonic sensor for biomedical applications by Ibsen Photonics.
- 2023: Development of a cost-effective photonic sensor for industrial automation by Banner Engineering.
- 2024: Strategic partnership between BaySpec and a major automotive manufacturer for LiDAR technology integration.
In-Depth Photonic Sensor and Detector Market Outlook
The Photonic Sensor and Detector market is poised for significant growth, driven by continuous technological advancements and increasing demand across diverse applications. Strategic partnerships, investments in R&D, and market expansion into new sectors present lucrative opportunities for market players. The long-term outlook is optimistic, with the market expected to witness substantial expansion in the coming years, driven by the aforementioned factors.
Photonic Sensor and Detector Segmentation
-
1. Application
- 1.1. Healthcare and Medical
- 1.2. Defense and Security
- 1.3. Others
-
2. Types
- 2.1. Fiber Optic Sensors
- 2.2. Biophotonic Sensors
- 2.3. Photodiodes
- 2.4. Phototransistors
Photonic Sensor and Detector Segmentation By Geography
-
1. North America
- 1.1. United States
- 1.2. Canada
- 1.3. Mexico
-
2. South America
- 2.1. Brazil
- 2.2. Argentina
- 2.3. Rest of South America
-
3. Europe
- 3.1. United Kingdom
- 3.2. Germany
- 3.3. France
- 3.4. Italy
- 3.5. Spain
- 3.6. Russia
- 3.7. Benelux
- 3.8. Nordics
- 3.9. Rest of Europe
-
4. Middle East & Africa
- 4.1. Turkey
- 4.2. Israel
- 4.3. GCC
- 4.4. North Africa
- 4.5. South Africa
- 4.6. Rest of Middle East & Africa
-
5. Asia Pacific
- 5.1. China
- 5.2. India
- 5.3. Japan
- 5.4. South Korea
- 5.5. ASEAN
- 5.6. Oceania
- 5.7. Rest of Asia Pacific
Photonic Sensor and Detector Regional Market Share
Geographic Coverage of Photonic Sensor and Detector
Photonic Sensor and Detector REPORT HIGHLIGHTS
| Aspects | Details |
|---|---|
| Study Period | 2020-2034 |
| Base Year | 2025 |
| Estimated Year | 2026 |
| Forecast Period | 2026-2034 |
| Historical Period | 2020-2025 |
| Growth Rate | CAGR of 14.5% from 2020-2034 |
| Segmentation |
|
Table of Contents
- 1. Introduction
- 1.1. Research Scope
- 1.2. Market Segmentation
- 1.3. Research Objective
- 1.4. Definitions and Assumptions
- 2. Executive Summary
- 2.1. Market Snapshot
- 3. Market Dynamics
- 3.1. Market Drivers
- 3.2. Market Restrains
- 3.3. Market Trends
- 3.4. Market Opportunities
- 4. Market Factor Analysis
- 4.1. Porters Five Forces
- 4.1.1. Bargaining Power of Suppliers
- 4.1.2. Bargaining Power of Buyers
- 4.1.3. Threat of New Entrants
- 4.1.4. Threat of Substitutes
- 4.1.5. Competitive Rivalry
- 4.2. PESTEL analysis
- 4.3. BCG Analysis
- 4.3.1. Stars (High Growth, High Market Share)
- 4.3.2. Cash Cows (Low Growth, High Market Share)
- 4.3.3. Question Mark (High Growth, Low Market Share)
- 4.3.4. Dogs (Low Growth, Low Market Share)
- 4.4. Ansoff Matrix Analysis
- 4.5. Supply Chain Analysis
- 4.6. Regulatory Landscape
- 4.7. Current Market Potential and Opportunity Assessment (TAM–SAM–SOM Framework)
- 4.8. VDR Analyst Note
- 4.1. Porters Five Forces
- 5. Market Analysis, Insights and Forecast 2021-2033
- 5.1. Market Analysis, Insights and Forecast - by Application
- 5.1.1. Healthcare and Medical
- 5.1.2. Defense and Security
- 5.1.3. Others
- 5.2. Market Analysis, Insights and Forecast - by Types
- 5.2.1. Fiber Optic Sensors
- 5.2.2. Biophotonic Sensors
- 5.2.3. Photodiodes
- 5.2.4. Phototransistors
- 5.3. Market Analysis, Insights and Forecast - by Region
- 5.3.1. North America
- 5.3.2. South America
- 5.3.3. Europe
- 5.3.4. Middle East & Africa
- 5.3.5. Asia Pacific
- 5.1. Market Analysis, Insights and Forecast - by Application
- 6. Global Photonic Sensor and Detector Analysis, Insights and Forecast, 2021-2033
- 6.1. Market Analysis, Insights and Forecast - by Application
- 6.1.1. Healthcare and Medical
- 6.1.2. Defense and Security
- 6.1.3. Others
- 6.2. Market Analysis, Insights and Forecast - by Types
- 6.2.1. Fiber Optic Sensors
- 6.2.2. Biophotonic Sensors
- 6.2.3. Photodiodes
- 6.2.4. Phototransistors
- 6.1. Market Analysis, Insights and Forecast - by Application
- 7. North America Photonic Sensor and Detector Analysis, Insights and Forecast, 2021-2033
- 7.1. Market Analysis, Insights and Forecast - by Application
- 7.1.1. Healthcare and Medical
- 7.1.2. Defense and Security
- 7.1.3. Others
- 7.2. Market Analysis, Insights and Forecast - by Types
- 7.2.1. Fiber Optic Sensors
- 7.2.2. Biophotonic Sensors
- 7.2.3. Photodiodes
- 7.2.4. Phototransistors
- 7.1. Market Analysis, Insights and Forecast - by Application
- 8. South America Photonic Sensor and Detector Analysis, Insights and Forecast, 2021-2033
- 8.1. Market Analysis, Insights and Forecast - by Application
- 8.1.1. Healthcare and Medical
- 8.1.2. Defense and Security
- 8.1.3. Others
- 8.2. Market Analysis, Insights and Forecast - by Types
- 8.2.1. Fiber Optic Sensors
- 8.2.2. Biophotonic Sensors
- 8.2.3. Photodiodes
- 8.2.4. Phototransistors
- 8.1. Market Analysis, Insights and Forecast - by Application
- 9. Europe Photonic Sensor and Detector Analysis, Insights and Forecast, 2021-2033
- 9.1. Market Analysis, Insights and Forecast - by Application
- 9.1.1. Healthcare and Medical
- 9.1.2. Defense and Security
- 9.1.3. Others
- 9.2. Market Analysis, Insights and Forecast - by Types
- 9.2.1. Fiber Optic Sensors
- 9.2.2. Biophotonic Sensors
- 9.2.3. Photodiodes
- 9.2.4. Phototransistors
- 9.1. Market Analysis, Insights and Forecast - by Application
- 10. Middle East & Africa Photonic Sensor and Detector Analysis, Insights and Forecast, 2021-2033
- 10.1. Market Analysis, Insights and Forecast - by Application
- 10.1.1. Healthcare and Medical
- 10.1.2. Defense and Security
- 10.1.3. Others
- 10.2. Market Analysis, Insights and Forecast - by Types
- 10.2.1. Fiber Optic Sensors
- 10.2.2. Biophotonic Sensors
- 10.2.3. Photodiodes
- 10.2.4. Phototransistors
- 10.1. Market Analysis, Insights and Forecast - by Application
- 11. Asia Pacific Photonic Sensor and Detector Analysis, Insights and Forecast, 2021-2033
- 11.1. Market Analysis, Insights and Forecast - by Application
- 11.1.1. Healthcare and Medical
- 11.1.2. Defense and Security
- 11.1.3. Others
- 11.2. Market Analysis, Insights and Forecast - by Types
- 11.2.1. Fiber Optic Sensors
- 11.2.2. Biophotonic Sensors
- 11.2.3. Photodiodes
- 11.2.4. Phototransistors
- 11.1. Market Analysis, Insights and Forecast - by Application
- 12. Competitive Analysis
- 12.1. Company Profiles
- 12.1.1 Banner Engineering
- 12.1.1.1. Company Overview
- 12.1.1.2. Products
- 12.1.1.3. Company Financials
- 12.1.1.4. SWOT Analysis
- 12.1.2 BaySpec
- 12.1.2.1. Company Overview
- 12.1.2.2. Products
- 12.1.2.3. Company Financials
- 12.1.2.4. SWOT Analysis
- 12.1.3 Fiberoptic Systems
- 12.1.3.1. Company Overview
- 12.1.3.2. Products
- 12.1.3.3. Company Financials
- 12.1.3.4. SWOT Analysis
- 12.1.4 FISO Technologies
- 12.1.4.1. Company Overview
- 12.1.4.2. Products
- 12.1.4.3. Company Financials
- 12.1.4.4. SWOT Analysis
- 12.1.5 Fujifilm Holdings Corporation
- 12.1.5.1. Company Overview
- 12.1.5.2. Products
- 12.1.5.3. Company Financials
- 12.1.5.4. SWOT Analysis
- 12.1.6 Hamamatsu Photonics
- 12.1.6.1. Company Overview
- 12.1.6.2. Products
- 12.1.6.3. Company Financials
- 12.1.6.4. SWOT Analysis
- 12.1.7 Honeywell International
- 12.1.7.1. Company Overview
- 12.1.7.2. Products
- 12.1.7.3. Company Financials
- 12.1.7.4. SWOT Analysis
- 12.1.8 Ibsen Photonics A/S
- 12.1.8.1. Company Overview
- 12.1.8.2. Products
- 12.1.8.3. Company Financials
- 12.1.8.4. SWOT Analysis
- 12.1.9 LAP Laser
- 12.1.9.1. Company Overview
- 12.1.9.2. Products
- 12.1.9.3. Company Financials
- 12.1.9.4. SWOT Analysis
- 12.1.10 Mitsubishi Electric Corporation
- 12.1.10.1. Company Overview
- 12.1.10.2. Products
- 12.1.10.3. Company Financials
- 12.1.10.4. SWOT Analysis
- 12.1.11 Omron Corporation
- 12.1.11.1. Company Overview
- 12.1.11.2. Products
- 12.1.11.3. Company Financials
- 12.1.11.4. SWOT Analysis
- 12.1.12 Prime Photonics
- 12.1.12.1. Company Overview
- 12.1.12.2. Products
- 12.1.12.3. Company Financials
- 12.1.12.4. SWOT Analysis
- 12.1.13 Smart Fibres
- 12.1.13.1. Company Overview
- 12.1.13.2. Products
- 12.1.13.3. Company Financials
- 12.1.13.4. SWOT Analysis
- 12.1.14 St. Jude Medical
- 12.1.14.1. Company Overview
- 12.1.14.2. Products
- 12.1.14.3. Company Financials
- 12.1.14.4. SWOT Analysis
- 12.1.1 Banner Engineering
- 12.2. Market Entropy
- 12.2.1 Company's Key Areas Served
- 12.2.2 Recent Developments
- 12.3. Company Market Share Analysis 2025
- 12.3.1 Top 5 Companies Market Share Analysis
- 12.3.2 Top 3 Companies Market Share Analysis
- 12.4. List of Potential Customers
- 13. Research Methodology
List of Figures
- Figure 1: Global Photonic Sensor and Detector Revenue Breakdown (billion, %) by Region 2025 & 2033
- Figure 2: North America Photonic Sensor and Detector Revenue (billion), by Application 2025 & 2033
- Figure 3: North America Photonic Sensor and Detector Revenue Share (%), by Application 2025 & 2033
- Figure 4: North America Photonic Sensor and Detector Revenue (billion), by Types 2025 & 2033
- Figure 5: North America Photonic Sensor and Detector Revenue Share (%), by Types 2025 & 2033
- Figure 6: North America Photonic Sensor and Detector Revenue (billion), by Country 2025 & 2033
- Figure 7: North America Photonic Sensor and Detector Revenue Share (%), by Country 2025 & 2033
- Figure 8: South America Photonic Sensor and Detector Revenue (billion), by Application 2025 & 2033
- Figure 9: South America Photonic Sensor and Detector Revenue Share (%), by Application 2025 & 2033
- Figure 10: South America Photonic Sensor and Detector Revenue (billion), by Types 2025 & 2033
- Figure 11: South America Photonic Sensor and Detector Revenue Share (%), by Types 2025 & 2033
- Figure 12: South America Photonic Sensor and Detector Revenue (billion), by Country 2025 & 2033
- Figure 13: South America Photonic Sensor and Detector Revenue Share (%), by Country 2025 & 2033
- Figure 14: Europe Photonic Sensor and Detector Revenue (billion), by Application 2025 & 2033
- Figure 15: Europe Photonic Sensor and Detector Revenue Share (%), by Application 2025 & 2033
- Figure 16: Europe Photonic Sensor and Detector Revenue (billion), by Types 2025 & 2033
- Figure 17: Europe Photonic Sensor and Detector Revenue Share (%), by Types 2025 & 2033
- Figure 18: Europe Photonic Sensor and Detector Revenue (billion), by Country 2025 & 2033
- Figure 19: Europe Photonic Sensor and Detector Revenue Share (%), by Country 2025 & 2033
- Figure 20: Middle East & Africa Photonic Sensor and Detector Revenue (billion), by Application 2025 & 2033
- Figure 21: Middle East & Africa Photonic Sensor and Detector Revenue Share (%), by Application 2025 & 2033
- Figure 22: Middle East & Africa Photonic Sensor and Detector Revenue (billion), by Types 2025 & 2033
- Figure 23: Middle East & Africa Photonic Sensor and Detector Revenue Share (%), by Types 2025 & 2033
- Figure 24: Middle East & Africa Photonic Sensor and Detector Revenue (billion), by Country 2025 & 2033
- Figure 25: Middle East & Africa Photonic Sensor and Detector Revenue Share (%), by Country 2025 & 2033
- Figure 26: Asia Pacific Photonic Sensor and Detector Revenue (billion), by Application 2025 & 2033
- Figure 27: Asia Pacific Photonic Sensor and Detector Revenue Share (%), by Application 2025 & 2033
- Figure 28: Asia Pacific Photonic Sensor and Detector Revenue (billion), by Types 2025 & 2033
- Figure 29: Asia Pacific Photonic Sensor and Detector Revenue Share (%), by Types 2025 & 2033
- Figure 30: Asia Pacific Photonic Sensor and Detector Revenue (billion), by Country 2025 & 2033
- Figure 31: Asia Pacific Photonic Sensor and Detector Revenue Share (%), by Country 2025 & 2033
List of Tables
- Table 1: Global Photonic Sensor and Detector Revenue billion Forecast, by Application 2020 & 2033
- Table 2: Global Photonic Sensor and Detector Revenue billion Forecast, by Types 2020 & 2033
- Table 3: Global Photonic Sensor and Detector Revenue billion Forecast, by Region 2020 & 2033
- Table 4: Global Photonic Sensor and Detector Revenue billion Forecast, by Application 2020 & 2033
- Table 5: Global Photonic Sensor and Detector Revenue billion Forecast, by Types 2020 & 2033
- Table 6: Global Photonic Sensor and Detector Revenue billion Forecast, by Country 2020 & 2033
- Table 7: United States Photonic Sensor and Detector Revenue (billion) Forecast, by Application 2020 & 2033
- Table 8: Canada Photonic Sensor and Detector Revenue (billion) Forecast, by Application 2020 & 2033
- Table 9: Mexico Photonic Sensor and Detector Revenue (billion) Forecast, by Application 2020 & 2033
- Table 10: Global Photonic Sensor and Detector Revenue billion Forecast, by Application 2020 & 2033
- Table 11: Global Photonic Sensor and Detector Revenue billion Forecast, by Types 2020 & 2033
- Table 12: Global Photonic Sensor and Detector Revenue billion Forecast, by Country 2020 & 2033
- Table 13: Brazil Photonic Sensor and Detector Revenue (billion) Forecast, by Application 2020 & 2033
- Table 14: Argentina Photonic Sensor and Detector Revenue (billion) Forecast, by Application 2020 & 2033
- Table 15: Rest of South America Photonic Sensor and Detector Revenue (billion) Forecast, by Application 2020 & 2033
- Table 16: Global Photonic Sensor and Detector Revenue billion Forecast, by Application 2020 & 2033
- Table 17: Global Photonic Sensor and Detector Revenue billion Forecast, by Types 2020 & 2033
- Table 18: Global Photonic Sensor and Detector Revenue billion Forecast, by Country 2020 & 2033
- Table 19: United Kingdom Photonic Sensor and Detector Revenue (billion) Forecast, by Application 2020 & 2033
- Table 20: Germany Photonic Sensor and Detector Revenue (billion) Forecast, by Application 2020 & 2033
- Table 21: France Photonic Sensor and Detector Revenue (billion) Forecast, by Application 2020 & 2033
- Table 22: Italy Photonic Sensor and Detector Revenue (billion) Forecast, by Application 2020 & 2033
- Table 23: Spain Photonic Sensor and Detector Revenue (billion) Forecast, by Application 2020 & 2033
- Table 24: Russia Photonic Sensor and Detector Revenue (billion) Forecast, by Application 2020 & 2033
- Table 25: Benelux Photonic Sensor and Detector Revenue (billion) Forecast, by Application 2020 & 2033
- Table 26: Nordics Photonic Sensor and Detector Revenue (billion) Forecast, by Application 2020 & 2033
- Table 27: Rest of Europe Photonic Sensor and Detector Revenue (billion) Forecast, by Application 2020 & 2033
- Table 28: Global Photonic Sensor and Detector Revenue billion Forecast, by Application 2020 & 2033
- Table 29: Global Photonic Sensor and Detector Revenue billion Forecast, by Types 2020 & 2033
- Table 30: Global Photonic Sensor and Detector Revenue billion Forecast, by Country 2020 & 2033
- Table 31: Turkey Photonic Sensor and Detector Revenue (billion) Forecast, by Application 2020 & 2033
- Table 32: Israel Photonic Sensor and Detector Revenue (billion) Forecast, by Application 2020 & 2033
- Table 33: GCC Photonic Sensor and Detector Revenue (billion) Forecast, by Application 2020 & 2033
- Table 34: North Africa Photonic Sensor and Detector Revenue (billion) Forecast, by Application 2020 & 2033
- Table 35: South Africa Photonic Sensor and Detector Revenue (billion) Forecast, by Application 2020 & 2033
- Table 36: Rest of Middle East & Africa Photonic Sensor and Detector Revenue (billion) Forecast, by Application 2020 & 2033
- Table 37: Global Photonic Sensor and Detector Revenue billion Forecast, by Application 2020 & 2033
- Table 38: Global Photonic Sensor and Detector Revenue billion Forecast, by Types 2020 & 2033
- Table 39: Global Photonic Sensor and Detector Revenue billion Forecast, by Country 2020 & 2033
- Table 40: China Photonic Sensor and Detector Revenue (billion) Forecast, by Application 2020 & 2033
- Table 41: India Photonic Sensor and Detector Revenue (billion) Forecast, by Application 2020 & 2033
- Table 42: Japan Photonic Sensor and Detector Revenue (billion) Forecast, by Application 2020 & 2033
- Table 43: South Korea Photonic Sensor and Detector Revenue (billion) Forecast, by Application 2020 & 2033
- Table 44: ASEAN Photonic Sensor and Detector Revenue (billion) Forecast, by Application 2020 & 2033
- Table 45: Oceania Photonic Sensor and Detector Revenue (billion) Forecast, by Application 2020 & 2033
- Table 46: Rest of Asia Pacific Photonic Sensor and Detector Revenue (billion) Forecast, by Application 2020 & 2033
Frequently Asked Questions
1. What is the projected Compound Annual Growth Rate (CAGR) of the Photonic Sensor and Detector?
The projected CAGR is approximately 14.5%.
2. Which companies are prominent players in the Photonic Sensor and Detector?
Key companies in the market include Banner Engineering, BaySpec, Fiberoptic Systems, FISO Technologies, Fujifilm Holdings Corporation, Hamamatsu Photonics, Honeywell International, Ibsen Photonics A/S, LAP Laser, Mitsubishi Electric Corporation, Omron Corporation, Prime Photonics, Smart Fibres, St. Jude Medical.
3. What are the main segments of the Photonic Sensor and Detector?
The market segments include Application, Types.
4. Can you provide details about the market size?
The market size is estimated to be USD 27.95 billion as of 2022.
5. What are some drivers contributing to market growth?
N/A
6. What are the notable trends driving market growth?
N/A
7. Are there any restraints impacting market growth?
N/A
8. Can you provide examples of recent developments in the market?
N/A
9. What pricing options are available for accessing the report?
Pricing options include single-user, multi-user, and enterprise licenses priced at USD 2900.00, USD 4350.00, and USD 5800.00 respectively.
10. Is the market size provided in terms of value or volume?
The market size is provided in terms of value, measured in billion.
11. Are there any specific market keywords associated with the report?
Yes, the market keyword associated with the report is "Photonic Sensor and Detector," which aids in identifying and referencing the specific market segment covered.
12. How do I determine which pricing option suits my needs best?
The pricing options vary based on user requirements and access needs. Individual users may opt for single-user licenses, while businesses requiring broader access may choose multi-user or enterprise licenses for cost-effective access to the report.
13. Are there any additional resources or data provided in the Photonic Sensor and Detector report?
While the report offers comprehensive insights, it's advisable to review the specific contents or supplementary materials provided to ascertain if additional resources or data are available.
14. How can I stay updated on further developments or reports in the Photonic Sensor and Detector?
To stay informed about further developments, trends, and reports in the Photonic Sensor and Detector, consider subscribing to industry newsletters, following relevant companies and organizations, or regularly checking reputable industry news sources and publications.
Methodology
Step 1 - Identification of Relevant Samples Size from Population Database


Step 2 - Approaches for Defining Global Market Size (Value, Volume* & Price*)

Note*: In applicable scenarios
Step 3 - Data Sources
Primary Research
- Web Analytics
- Survey Reports
- Research Institute
- Latest Research Reports
- Opinion Leaders
Secondary Research
- Annual Reports
- White Paper
- Latest Press Release
- Industry Association
- Paid Database
- Investor Presentations

Step 4 - Data Triangulation
Involves using different sources of information in order to increase the validity of a study
These sources are likely to be stakeholders in a program - participants, other researchers, program staff, other community members, and so on.
Then we put all data in single framework & apply various statistical tools to find out the dynamic on the market.
During the analysis stage, feedback from the stakeholder groups would be compared to determine areas of agreement as well as areas of divergence