
Key Insights
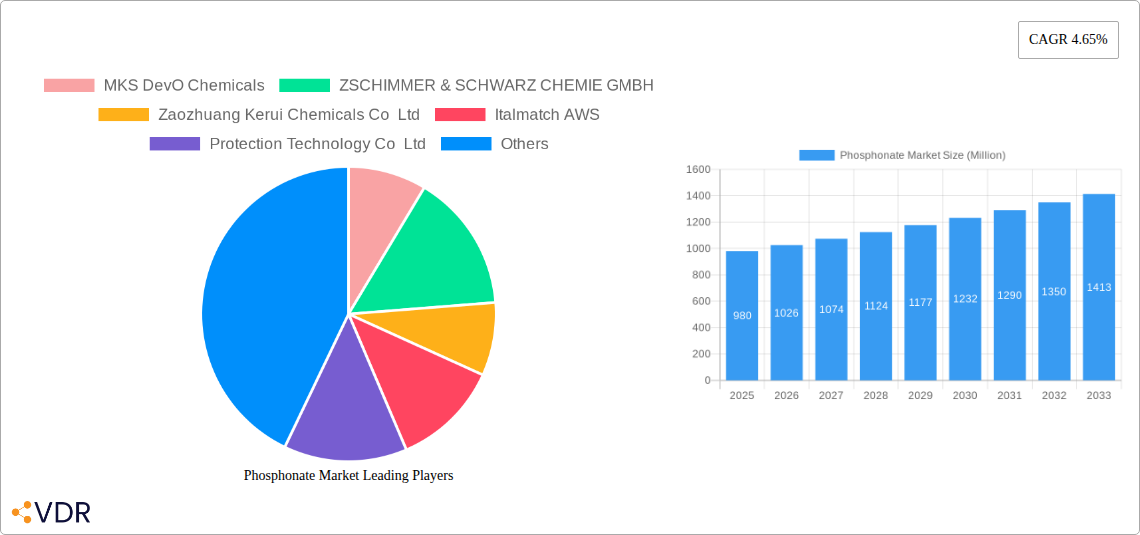
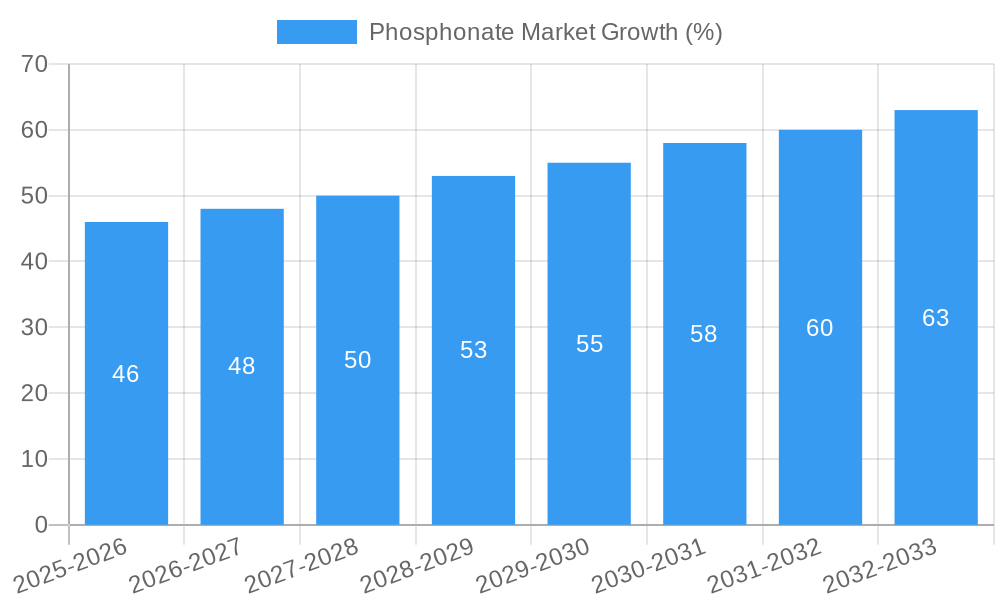
The global phosphonate market, valued at $0.98 billion in 2025, is projected to experience robust growth, driven by increasing demand across diverse sectors. A Compound Annual Growth Rate (CAGR) of 4.65% from 2025 to 2033 indicates a significant expansion. Key drivers include the rising adoption of phosphonates in water treatment applications, fueled by stricter environmental regulations and the growing need for efficient water purification. The detergent and cleaning agent industry is another significant contributor, with phosphonates offering excellent chelating and scale-inhibition properties. Furthermore, growth in the oilfield chemicals sector, where phosphonates are used in drilling fluids and scale control, is bolstering market expansion. The market is segmented by type (ATMP, HEDP, DTPMP, and others) and end-user industry (detergent & cleaning agents, water treatment, oilfield chemicals, cosmetics, building materials, and others). While specific data on individual segment shares is unavailable, it's reasonable to assume that water treatment and detergent & cleaning agents currently hold the largest market shares, given their established applications and significant volumes. However, the cosmetics and building materials segments are expected to witness faster growth due to increasing demand for eco-friendly and performance-enhancing additives. Competitive pressures from numerous established and emerging players, including MKS DevO Chemicals, ZSCHIMMER & SCHWARZ CHEMIE GMBH, and others, will shape market dynamics in the coming years.
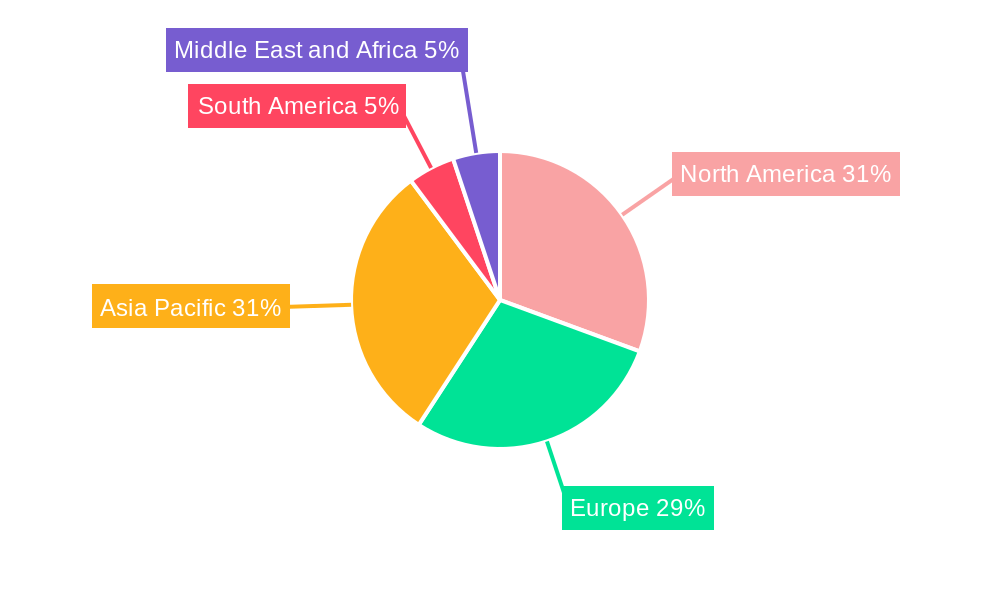
Geographical distribution of the phosphonate market shows a significant presence in North America, Europe, and Asia-Pacific. While precise regional shares require further data, it's likely that Asia-Pacific holds a prominent position, driven by substantial growth in industrialization and infrastructure development in countries like China and India. North America and Europe, with their established chemical industries and stringent environmental norms, also contribute substantially to market demand. Factors such as fluctuating raw material prices, potential environmental concerns surrounding phosphonate usage, and the emergence of alternative technologies could pose challenges to market growth. However, the overall outlook remains positive, considering the continued demand for efficient water treatment solutions, sustainable cleaning agents, and performance-enhancing additives across various applications. Continued innovation in phosphonate formulations and application methods is expected to further stimulate market expansion during the forecast period.
Phosphonate Market: A Comprehensive Report (2019-2033)
This comprehensive report provides an in-depth analysis of the global Phosphonate market, encompassing market dynamics, growth trends, regional segmentation, product landscape, and key players. With a detailed study period from 2019 to 2033 (base year 2025, forecast period 2025-2033), this report is an indispensable resource for industry professionals, investors, and strategic decision-makers seeking to understand and capitalize on the opportunities within this dynamic market. The report segments the market by type (ATMP, HEDP, DTPMP, Other Types) and end-user industry (Detergent and Cleaning Agent, Water Treatment, Oil field chemicals, Cosmetics, Building Materials, Other End-user Industries), providing a granular view of market performance across various sectors. The total market size in 2025 is estimated at XXX Million.
Phosphonate Market Dynamics & Structure
The global Phosphonate market is characterized by moderate concentration, with several key players holding significant market share. Technological innovation, particularly in sustainable and high-performance formulations, is a key driver. Stringent environmental regulations are shaping product development and adoption, favoring eco-friendly alternatives. The market faces competition from alternative water treatment and cleaning agents, influencing pricing and market share dynamics. M&A activity has been moderate, with strategic acquisitions aiming to expand geographic reach and product portfolios. The historical period (2019-2024) saw a CAGR of xx%, indicating steady growth.
- Market Concentration: Moderately concentrated, with top 5 players holding approximately xx% market share in 2025.
- Technological Innovation: Focus on sustainable, high-performance formulations, driven by environmental regulations.
- Regulatory Framework: Stringent environmental regulations impacting product development and adoption.
- Competitive Substitutes: Alternative water treatment and cleaning agents exert competitive pressure.
- End-user Demographics: Growth driven by increasing demand from water treatment and detergent & cleaning agent industries.
- M&A Trends: Moderate activity, with acquisitions focused on geographic expansion and product diversification. For example, Biesterfeld AG's acquisition of GME Chemicals in 2021 demonstrates this trend.
Phosphonate Market Growth Trends & Insights
The Phosphonate market is experiencing steady growth, fueled by rising demand across various end-use sectors. The water treatment segment, driven by increasing concerns about water scarcity and stricter regulations, is a key growth driver. The detergent and cleaning agent segment also exhibits substantial growth, attributed to the increasing demand for household and industrial cleaning products. Technological advancements leading to more efficient and environmentally friendly phosphonates are further accelerating market adoption. Consumer preference for sustainable products and increasing awareness of environmental issues are also influencing market growth. The market is projected to reach XXX Million by 2033, with a CAGR of xx% during the forecast period (2025-2033).
Dominant Regions, Countries, or Segments in Phosphonate Market
The Asia-Pacific region is currently the dominant market for phosphonates, driven by robust economic growth, expanding industrialization, and increasing investments in water infrastructure. Within this region, China and India are major contributors to market growth. The water treatment segment is the largest end-user industry, followed by the detergent and cleaning agent sector. The ATMP type holds the largest market share among various types of phosphonates.
- Key Drivers:
- Strong economic growth in Asia-Pacific.
- Expanding industrialization and infrastructure development.
- Increasing demand for water treatment solutions.
- Growing adoption of detergents and cleaning agents.
- Dominance Factors:
- High population density and urbanization.
- Stringent environmental regulations.
- Government initiatives to improve water infrastructure.
Phosphonate Market Product Landscape
The phosphonate market offers a diverse range of products, tailored to specific applications and performance requirements. Innovations focus on improving efficacy, reducing environmental impact, and enhancing cost-effectiveness. The unique selling propositions of different phosphonates lie in their ability to provide superior scale inhibition, corrosion inhibition, and dispersancy, depending on the specific application. Technological advancements include the development of more bio-degradable and less toxic formulations.
Key Drivers, Barriers & Challenges in Phosphonate Market
Key Drivers:
- Increasing demand from water treatment and detergent industries.
- Stringent environmental regulations driving the adoption of eco-friendly alternatives.
- Technological advancements in formulations leading to improved efficiency and sustainability.
Key Challenges:
- Fluctuations in raw material prices impacting profitability.
- Stringent regulatory compliance requirements.
- Competition from alternative water treatment chemicals.
Emerging Opportunities in Phosphonate Market
- Expanding applications in oilfield chemicals and cosmetics.
- Growing demand for high-performance phosphonates in specific niche applications.
- Development of bio-based and sustainable phosphonate alternatives.
Growth Accelerators in the Phosphonate Market Industry
Strategic partnerships and collaborations between manufacturers and end-users are creating synergies that accelerate market growth. The development of innovative formulations with enhanced performance and environmental sustainability profiles is another key accelerator. Furthermore, expanding into untapped markets and developing new applications are creating significant growth opportunities.
Key Players Shaping the Phosphonate Market Market
- MKS DevO Chemicals
- ZSCHIMMER & SCHWARZ CHEMIE GMBH
- Zaozhuang Kerui Chemicals Co Ltd
- Italmatch AWS
- Protection Technology Co Ltd
- Biesterfeld AG
- Shandong Xintai Water Treatment Technology Co Ltd
- Excel Industries
- LANXESS
- Henan Qingshuiyuan Technolog
- Jiangsu Yuanquan Hongguang Environmental
- Uniphos Chemicals
- Aquapharm Chemical Pvt Ltd
- Shandong Taihe Watre Treatment Technologies Co Ltd
- IRO Group
- Bozzetto Group
- Changzhou Kewei Fine Chemicals Co Ltd
Notable Milestones in Phosphonate Market Sector
- Oct 2021: Biesterfeld AG announced the acquisition of GME Chemicals to expand its presence in Asia.
In-Depth Phosphonate Market Market Outlook
The phosphonate market is poised for continued growth, driven by sustained demand from key end-use sectors and ongoing technological advancements. Strategic partnerships and investments in R&D will further accelerate market expansion. Companies focusing on sustainable and high-performance products are expected to gain a competitive edge. The market's future potential lies in exploring new applications, expanding into emerging markets, and capitalizing on the increasing focus on water conservation and environmental sustainability.
Phosphonate Market Segmentation
-
1. Types
- 1.1. ATMP
- 1.2. HEDP
- 1.3. DTPMP
- 1.4. Other Types
-
2. End-user Industry
- 2.1. Detergent and Cleaning Agent
- 2.2. Water Treatment
- 2.3. Oil field chemicals
- 2.4. Cosmetics
- 2.5. Building Materials
- 2.6. Other End-user Industries
Phosphonate Market Segmentation By Geography
-
1. Asia Pacific
- 1.1. China
- 1.2. India
- 1.3. Japan
- 1.4. South Korea
- 1.5. Malaysia
- 1.6. Thailand
- 1.7. Indonesia
- 1.8. Vietnam
- 1.9. Rest of Asia Pacific
-
2. North America
- 2.1. United States
- 2.2. Canada
- 2.3. Mexico
-
3. Europe
- 3.1. Germany
- 3.2. United Kingdom
- 3.3. France
- 3.4. Italy
- 3.5. Spain
- 3.6. NORDIC Countries
- 3.7. Turkey
- 3.8. Russia
- 3.9. Rest of Europe
-
4. South America
- 4.1. Brazil
- 4.2. Argentina
- 4.3. Colombia
- 4.4. Rest of South America
-
5. Middle East and Africa
- 5.1. Saudi Arabia
- 5.2. Qatar
- 5.3. United Arab Emirates
- 5.4. Nigeria
- 5.5. Egypt
- 5.6. South Africa
- 5.7. Rest of Middle East and Africa
Phosphonate Market REPORT HIGHLIGHTS
| Aspects | Details |
|---|---|
| Study Period | 2019-2033 |
| Base Year | 2024 |
| Estimated Year | 2025 |
| Forecast Period | 2025-2033 |
| Historical Period | 2019-2024 |
| Growth Rate | CAGR of 4.65% from 2019-2033 |
| Segmentation |
|
Table of Contents
- 1. Introduction
- 1.1. Research Scope
- 1.2. Market Segmentation
- 1.3. Research Methodology
- 1.4. Definitions and Assumptions
- 2. Executive Summary
- 2.1. Introduction
- 3. Market Dynamics
- 3.1. Introduction
- 3.2. Market Drivers
- 3.2.1. Wide Applications of Phosphonates in the Water Treatment Industry; Rapid Growth of the Cleaners and Detergents Industry
- 3.3. Market Restrains
- 3.3.1. Environmental impact due to non-degradable nature
- 3.4. Market Trends
- 3.4.1. Increasing Demand in the Water Treatment Industry
- 4. Market Factor Analysis
- 4.1. Porters Five Forces
- 4.2. Supply/Value Chain
- 4.3. PESTEL analysis
- 4.4. Market Entropy
- 4.5. Patent/Trademark Analysis
- 5. Global Phosphonate Market Analysis, Insights and Forecast, 2019-2031
- 5.1. Market Analysis, Insights and Forecast - by Types
- 5.1.1. ATMP
- 5.1.2. HEDP
- 5.1.3. DTPMP
- 5.1.4. Other Types
- 5.2. Market Analysis, Insights and Forecast - by End-user Industry
- 5.2.1. Detergent and Cleaning Agent
- 5.2.2. Water Treatment
- 5.2.3. Oil field chemicals
- 5.2.4. Cosmetics
- 5.2.5. Building Materials
- 5.2.6. Other End-user Industries
- 5.3. Market Analysis, Insights and Forecast - by Region
- 5.3.1. Asia Pacific
- 5.3.2. North America
- 5.3.3. Europe
- 5.3.4. South America
- 5.3.5. Middle East and Africa
- 5.1. Market Analysis, Insights and Forecast - by Types
- 6. Asia Pacific Phosphonate Market Analysis, Insights and Forecast, 2019-2031
- 6.1. Market Analysis, Insights and Forecast - by Types
- 6.1.1. ATMP
- 6.1.2. HEDP
- 6.1.3. DTPMP
- 6.1.4. Other Types
- 6.2. Market Analysis, Insights and Forecast - by End-user Industry
- 6.2.1. Detergent and Cleaning Agent
- 6.2.2. Water Treatment
- 6.2.3. Oil field chemicals
- 6.2.4. Cosmetics
- 6.2.5. Building Materials
- 6.2.6. Other End-user Industries
- 6.1. Market Analysis, Insights and Forecast - by Types
- 7. North America Phosphonate Market Analysis, Insights and Forecast, 2019-2031
- 7.1. Market Analysis, Insights and Forecast - by Types
- 7.1.1. ATMP
- 7.1.2. HEDP
- 7.1.3. DTPMP
- 7.1.4. Other Types
- 7.2. Market Analysis, Insights and Forecast - by End-user Industry
- 7.2.1. Detergent and Cleaning Agent
- 7.2.2. Water Treatment
- 7.2.3. Oil field chemicals
- 7.2.4. Cosmetics
- 7.2.5. Building Materials
- 7.2.6. Other End-user Industries
- 7.1. Market Analysis, Insights and Forecast - by Types
- 8. Europe Phosphonate Market Analysis, Insights and Forecast, 2019-2031
- 8.1. Market Analysis, Insights and Forecast - by Types
- 8.1.1. ATMP
- 8.1.2. HEDP
- 8.1.3. DTPMP
- 8.1.4. Other Types
- 8.2. Market Analysis, Insights and Forecast - by End-user Industry
- 8.2.1. Detergent and Cleaning Agent
- 8.2.2. Water Treatment
- 8.2.3. Oil field chemicals
- 8.2.4. Cosmetics
- 8.2.5. Building Materials
- 8.2.6. Other End-user Industries
- 8.1. Market Analysis, Insights and Forecast - by Types
- 9. South America Phosphonate Market Analysis, Insights and Forecast, 2019-2031
- 9.1. Market Analysis, Insights and Forecast - by Types
- 9.1.1. ATMP
- 9.1.2. HEDP
- 9.1.3. DTPMP
- 9.1.4. Other Types
- 9.2. Market Analysis, Insights and Forecast - by End-user Industry
- 9.2.1. Detergent and Cleaning Agent
- 9.2.2. Water Treatment
- 9.2.3. Oil field chemicals
- 9.2.4. Cosmetics
- 9.2.5. Building Materials
- 9.2.6. Other End-user Industries
- 9.1. Market Analysis, Insights and Forecast - by Types
- 10. Middle East and Africa Phosphonate Market Analysis, Insights and Forecast, 2019-2031
- 10.1. Market Analysis, Insights and Forecast - by Types
- 10.1.1. ATMP
- 10.1.2. HEDP
- 10.1.3. DTPMP
- 10.1.4. Other Types
- 10.2. Market Analysis, Insights and Forecast - by End-user Industry
- 10.2.1. Detergent and Cleaning Agent
- 10.2.2. Water Treatment
- 10.2.3. Oil field chemicals
- 10.2.4. Cosmetics
- 10.2.5. Building Materials
- 10.2.6. Other End-user Industries
- 10.1. Market Analysis, Insights and Forecast - by Types
- 11. North America Phosphonate Market Analysis, Insights and Forecast, 2019-2031
- 11.1. Market Analysis, Insights and Forecast - By Country/Sub-region
- 11.1.1 United States
- 11.1.2 Canada
- 11.1.3 Mexico
- 12. Europe Phosphonate Market Analysis, Insights and Forecast, 2019-2031
- 12.1. Market Analysis, Insights and Forecast - By Country/Sub-region
- 12.1.1 Germany
- 12.1.2 France
- 12.1.3 Italy
- 12.1.4 United Kingdom
- 12.1.5 Netherlands
- 12.1.6 Rest of Europe
- 13. Asia Pacific Phosphonate Market Analysis, Insights and Forecast, 2019-2031
- 13.1. Market Analysis, Insights and Forecast - By Country/Sub-region
- 13.1.1 China
- 13.1.2 Japan
- 13.1.3 India
- 13.1.4 South Korea
- 13.1.5 Taiwan
- 13.1.6 Australia
- 13.1.7 Rest of Asia-Pacific
- 14. South America Phosphonate Market Analysis, Insights and Forecast, 2019-2031
- 14.1. Market Analysis, Insights and Forecast - By Country/Sub-region
- 14.1.1 Brazil
- 14.1.2 Argentina
- 14.1.3 Rest of South America
- 15. Middle East and Africa Phosphonate Market Analysis, Insights and Forecast, 2019-2031
- 15.1. Market Analysis, Insights and Forecast - By Country/Sub-region
- 15.1.1 Middle East
- 15.1.2 Africa
- 16. Competitive Analysis
- 16.1. Global Market Share Analysis 2024
- 16.2. Company Profiles
- 16.2.1 MKS DevO Chemicals
- 16.2.1.1. Overview
- 16.2.1.2. Products
- 16.2.1.3. SWOT Analysis
- 16.2.1.4. Recent Developments
- 16.2.1.5. Financials (Based on Availability)
- 16.2.2 ZSCHIMMER & SCHWARZ CHEMIE GMBH
- 16.2.2.1. Overview
- 16.2.2.2. Products
- 16.2.2.3. SWOT Analysis
- 16.2.2.4. Recent Developments
- 16.2.2.5. Financials (Based on Availability)
- 16.2.3 Zaozhuang Kerui Chemicals Co Ltd
- 16.2.3.1. Overview
- 16.2.3.2. Products
- 16.2.3.3. SWOT Analysis
- 16.2.3.4. Recent Developments
- 16.2.3.5. Financials (Based on Availability)
- 16.2.4 Italmatch AWS
- 16.2.4.1. Overview
- 16.2.4.2. Products
- 16.2.4.3. SWOT Analysis
- 16.2.4.4. Recent Developments
- 16.2.4.5. Financials (Based on Availability)
- 16.2.5 Protection Technology Co Ltd
- 16.2.5.1. Overview
- 16.2.5.2. Products
- 16.2.5.3. SWOT Analysis
- 16.2.5.4. Recent Developments
- 16.2.5.5. Financials (Based on Availability)
- 16.2.6 Biesterfeld AG
- 16.2.6.1. Overview
- 16.2.6.2. Products
- 16.2.6.3. SWOT Analysis
- 16.2.6.4. Recent Developments
- 16.2.6.5. Financials (Based on Availability)
- 16.2.7 Shandong Xintai Water Treatment Technology Co Ltd
- 16.2.7.1. Overview
- 16.2.7.2. Products
- 16.2.7.3. SWOT Analysis
- 16.2.7.4. Recent Developments
- 16.2.7.5. Financials (Based on Availability)
- 16.2.8 Excel Industries
- 16.2.8.1. Overview
- 16.2.8.2. Products
- 16.2.8.3. SWOT Analysis
- 16.2.8.4. Recent Developments
- 16.2.8.5. Financials (Based on Availability)
- 16.2.9 LANXESS
- 16.2.9.1. Overview
- 16.2.9.2. Products
- 16.2.9.3. SWOT Analysis
- 16.2.9.4. Recent Developments
- 16.2.9.5. Financials (Based on Availability)
- 16.2.10 Henan Qingshuiyuan Technolog
- 16.2.10.1. Overview
- 16.2.10.2. Products
- 16.2.10.3. SWOT Analysis
- 16.2.10.4. Recent Developments
- 16.2.10.5. Financials (Based on Availability)
- 16.2.11 Jiangsu Yuanquan Hongguang Environmental
- 16.2.11.1. Overview
- 16.2.11.2. Products
- 16.2.11.3. SWOT Analysis
- 16.2.11.4. Recent Developments
- 16.2.11.5. Financials (Based on Availability)
- 16.2.12 Uniphos Chemicals
- 16.2.12.1. Overview
- 16.2.12.2. Products
- 16.2.12.3. SWOT Analysis
- 16.2.12.4. Recent Developments
- 16.2.12.5. Financials (Based on Availability)
- 16.2.13 Aquapharm Chemical Pvt Ltd
- 16.2.13.1. Overview
- 16.2.13.2. Products
- 16.2.13.3. SWOT Analysis
- 16.2.13.4. Recent Developments
- 16.2.13.5. Financials (Based on Availability)
- 16.2.14 Shandong Taihe Watre Treatment Technologies Co Ltd
- 16.2.14.1. Overview
- 16.2.14.2. Products
- 16.2.14.3. SWOT Analysis
- 16.2.14.4. Recent Developments
- 16.2.14.5. Financials (Based on Availability)
- 16.2.15 IRO Group
- 16.2.15.1. Overview
- 16.2.15.2. Products
- 16.2.15.3. SWOT Analysis
- 16.2.15.4. Recent Developments
- 16.2.15.5. Financials (Based on Availability)
- 16.2.16 Bozzetto Group
- 16.2.16.1. Overview
- 16.2.16.2. Products
- 16.2.16.3. SWOT Analysis
- 16.2.16.4. Recent Developments
- 16.2.16.5. Financials (Based on Availability)
- 16.2.17 Changzhou Kewei Fine Chemicals Co Ltd
- 16.2.17.1. Overview
- 16.2.17.2. Products
- 16.2.17.3. SWOT Analysis
- 16.2.17.4. Recent Developments
- 16.2.17.5. Financials (Based on Availability)
- 16.2.1 MKS DevO Chemicals
List of Figures
- Figure 1: Global Phosphonate Market Revenue Breakdown (Million, %) by Region 2024 & 2032
- Figure 2: Global Phosphonate Market Volume Breakdown (K Tons, %) by Region 2024 & 2032
- Figure 3: North America Phosphonate Market Revenue (Million), by Country 2024 & 2032
- Figure 4: North America Phosphonate Market Volume (K Tons), by Country 2024 & 2032
- Figure 5: North America Phosphonate Market Revenue Share (%), by Country 2024 & 2032
- Figure 6: North America Phosphonate Market Volume Share (%), by Country 2024 & 2032
- Figure 7: Europe Phosphonate Market Revenue (Million), by Country 2024 & 2032
- Figure 8: Europe Phosphonate Market Volume (K Tons), by Country 2024 & 2032
- Figure 9: Europe Phosphonate Market Revenue Share (%), by Country 2024 & 2032
- Figure 10: Europe Phosphonate Market Volume Share (%), by Country 2024 & 2032
- Figure 11: Asia Pacific Phosphonate Market Revenue (Million), by Country 2024 & 2032
- Figure 12: Asia Pacific Phosphonate Market Volume (K Tons), by Country 2024 & 2032
- Figure 13: Asia Pacific Phosphonate Market Revenue Share (%), by Country 2024 & 2032
- Figure 14: Asia Pacific Phosphonate Market Volume Share (%), by Country 2024 & 2032
- Figure 15: South America Phosphonate Market Revenue (Million), by Country 2024 & 2032
- Figure 16: South America Phosphonate Market Volume (K Tons), by Country 2024 & 2032
- Figure 17: South America Phosphonate Market Revenue Share (%), by Country 2024 & 2032
- Figure 18: South America Phosphonate Market Volume Share (%), by Country 2024 & 2032
- Figure 19: Middle East and Africa Phosphonate Market Revenue (Million), by Country 2024 & 2032
- Figure 20: Middle East and Africa Phosphonate Market Volume (K Tons), by Country 2024 & 2032
- Figure 21: Middle East and Africa Phosphonate Market Revenue Share (%), by Country 2024 & 2032
- Figure 22: Middle East and Africa Phosphonate Market Volume Share (%), by Country 2024 & 2032
- Figure 23: Asia Pacific Phosphonate Market Revenue (Million), by Types 2024 & 2032
- Figure 24: Asia Pacific Phosphonate Market Volume (K Tons), by Types 2024 & 2032
- Figure 25: Asia Pacific Phosphonate Market Revenue Share (%), by Types 2024 & 2032
- Figure 26: Asia Pacific Phosphonate Market Volume Share (%), by Types 2024 & 2032
- Figure 27: Asia Pacific Phosphonate Market Revenue (Million), by End-user Industry 2024 & 2032
- Figure 28: Asia Pacific Phosphonate Market Volume (K Tons), by End-user Industry 2024 & 2032
- Figure 29: Asia Pacific Phosphonate Market Revenue Share (%), by End-user Industry 2024 & 2032
- Figure 30: Asia Pacific Phosphonate Market Volume Share (%), by End-user Industry 2024 & 2032
- Figure 31: Asia Pacific Phosphonate Market Revenue (Million), by Country 2024 & 2032
- Figure 32: Asia Pacific Phosphonate Market Volume (K Tons), by Country 2024 & 2032
- Figure 33: Asia Pacific Phosphonate Market Revenue Share (%), by Country 2024 & 2032
- Figure 34: Asia Pacific Phosphonate Market Volume Share (%), by Country 2024 & 2032
- Figure 35: North America Phosphonate Market Revenue (Million), by Types 2024 & 2032
- Figure 36: North America Phosphonate Market Volume (K Tons), by Types 2024 & 2032
- Figure 37: North America Phosphonate Market Revenue Share (%), by Types 2024 & 2032
- Figure 38: North America Phosphonate Market Volume Share (%), by Types 2024 & 2032
- Figure 39: North America Phosphonate Market Revenue (Million), by End-user Industry 2024 & 2032
- Figure 40: North America Phosphonate Market Volume (K Tons), by End-user Industry 2024 & 2032
- Figure 41: North America Phosphonate Market Revenue Share (%), by End-user Industry 2024 & 2032
- Figure 42: North America Phosphonate Market Volume Share (%), by End-user Industry 2024 & 2032
- Figure 43: North America Phosphonate Market Revenue (Million), by Country 2024 & 2032
- Figure 44: North America Phosphonate Market Volume (K Tons), by Country 2024 & 2032
- Figure 45: North America Phosphonate Market Revenue Share (%), by Country 2024 & 2032
- Figure 46: North America Phosphonate Market Volume Share (%), by Country 2024 & 2032
- Figure 47: Europe Phosphonate Market Revenue (Million), by Types 2024 & 2032
- Figure 48: Europe Phosphonate Market Volume (K Tons), by Types 2024 & 2032
- Figure 49: Europe Phosphonate Market Revenue Share (%), by Types 2024 & 2032
- Figure 50: Europe Phosphonate Market Volume Share (%), by Types 2024 & 2032
- Figure 51: Europe Phosphonate Market Revenue (Million), by End-user Industry 2024 & 2032
- Figure 52: Europe Phosphonate Market Volume (K Tons), by End-user Industry 2024 & 2032
- Figure 53: Europe Phosphonate Market Revenue Share (%), by End-user Industry 2024 & 2032
- Figure 54: Europe Phosphonate Market Volume Share (%), by End-user Industry 2024 & 2032
- Figure 55: Europe Phosphonate Market Revenue (Million), by Country 2024 & 2032
- Figure 56: Europe Phosphonate Market Volume (K Tons), by Country 2024 & 2032
- Figure 57: Europe Phosphonate Market Revenue Share (%), by Country 2024 & 2032
- Figure 58: Europe Phosphonate Market Volume Share (%), by Country 2024 & 2032
- Figure 59: South America Phosphonate Market Revenue (Million), by Types 2024 & 2032
- Figure 60: South America Phosphonate Market Volume (K Tons), by Types 2024 & 2032
- Figure 61: South America Phosphonate Market Revenue Share (%), by Types 2024 & 2032
- Figure 62: South America Phosphonate Market Volume Share (%), by Types 2024 & 2032
- Figure 63: South America Phosphonate Market Revenue (Million), by End-user Industry 2024 & 2032
- Figure 64: South America Phosphonate Market Volume (K Tons), by End-user Industry 2024 & 2032
- Figure 65: South America Phosphonate Market Revenue Share (%), by End-user Industry 2024 & 2032
- Figure 66: South America Phosphonate Market Volume Share (%), by End-user Industry 2024 & 2032
- Figure 67: South America Phosphonate Market Revenue (Million), by Country 2024 & 2032
- Figure 68: South America Phosphonate Market Volume (K Tons), by Country 2024 & 2032
- Figure 69: South America Phosphonate Market Revenue Share (%), by Country 2024 & 2032
- Figure 70: South America Phosphonate Market Volume Share (%), by Country 2024 & 2032
- Figure 71: Middle East and Africa Phosphonate Market Revenue (Million), by Types 2024 & 2032
- Figure 72: Middle East and Africa Phosphonate Market Volume (K Tons), by Types 2024 & 2032
- Figure 73: Middle East and Africa Phosphonate Market Revenue Share (%), by Types 2024 & 2032
- Figure 74: Middle East and Africa Phosphonate Market Volume Share (%), by Types 2024 & 2032
- Figure 75: Middle East and Africa Phosphonate Market Revenue (Million), by End-user Industry 2024 & 2032
- Figure 76: Middle East and Africa Phosphonate Market Volume (K Tons), by End-user Industry 2024 & 2032
- Figure 77: Middle East and Africa Phosphonate Market Revenue Share (%), by End-user Industry 2024 & 2032
- Figure 78: Middle East and Africa Phosphonate Market Volume Share (%), by End-user Industry 2024 & 2032
- Figure 79: Middle East and Africa Phosphonate Market Revenue (Million), by Country 2024 & 2032
- Figure 80: Middle East and Africa Phosphonate Market Volume (K Tons), by Country 2024 & 2032
- Figure 81: Middle East and Africa Phosphonate Market Revenue Share (%), by Country 2024 & 2032
- Figure 82: Middle East and Africa Phosphonate Market Volume Share (%), by Country 2024 & 2032
List of Tables
- Table 1: Global Phosphonate Market Revenue Million Forecast, by Region 2019 & 2032
- Table 2: Global Phosphonate Market Volume K Tons Forecast, by Region 2019 & 2032
- Table 3: Global Phosphonate Market Revenue Million Forecast, by Types 2019 & 2032
- Table 4: Global Phosphonate Market Volume K Tons Forecast, by Types 2019 & 2032
- Table 5: Global Phosphonate Market Revenue Million Forecast, by End-user Industry 2019 & 2032
- Table 6: Global Phosphonate Market Volume K Tons Forecast, by End-user Industry 2019 & 2032
- Table 7: Global Phosphonate Market Revenue Million Forecast, by Region 2019 & 2032
- Table 8: Global Phosphonate Market Volume K Tons Forecast, by Region 2019 & 2032
- Table 9: Global Phosphonate Market Revenue Million Forecast, by Country 2019 & 2032
- Table 10: Global Phosphonate Market Volume K Tons Forecast, by Country 2019 & 2032
- Table 11: United States Phosphonate Market Revenue (Million) Forecast, by Application 2019 & 2032
- Table 12: United States Phosphonate Market Volume (K Tons) Forecast, by Application 2019 & 2032
- Table 13: Canada Phosphonate Market Revenue (Million) Forecast, by Application 2019 & 2032
- Table 14: Canada Phosphonate Market Volume (K Tons) Forecast, by Application 2019 & 2032
- Table 15: Mexico Phosphonate Market Revenue (Million) Forecast, by Application 2019 & 2032
- Table 16: Mexico Phosphonate Market Volume (K Tons) Forecast, by Application 2019 & 2032
- Table 17: Global Phosphonate Market Revenue Million Forecast, by Country 2019 & 2032
- Table 18: Global Phosphonate Market Volume K Tons Forecast, by Country 2019 & 2032
- Table 19: Germany Phosphonate Market Revenue (Million) Forecast, by Application 2019 & 2032
- Table 20: Germany Phosphonate Market Volume (K Tons) Forecast, by Application 2019 & 2032
- Table 21: France Phosphonate Market Revenue (Million) Forecast, by Application 2019 & 2032
- Table 22: France Phosphonate Market Volume (K Tons) Forecast, by Application 2019 & 2032
- Table 23: Italy Phosphonate Market Revenue (Million) Forecast, by Application 2019 & 2032
- Table 24: Italy Phosphonate Market Volume (K Tons) Forecast, by Application 2019 & 2032
- Table 25: United Kingdom Phosphonate Market Revenue (Million) Forecast, by Application 2019 & 2032
- Table 26: United Kingdom Phosphonate Market Volume (K Tons) Forecast, by Application 2019 & 2032
- Table 27: Netherlands Phosphonate Market Revenue (Million) Forecast, by Application 2019 & 2032
- Table 28: Netherlands Phosphonate Market Volume (K Tons) Forecast, by Application 2019 & 2032
- Table 29: Rest of Europe Phosphonate Market Revenue (Million) Forecast, by Application 2019 & 2032
- Table 30: Rest of Europe Phosphonate Market Volume (K Tons) Forecast, by Application 2019 & 2032
- Table 31: Global Phosphonate Market Revenue Million Forecast, by Country 2019 & 2032
- Table 32: Global Phosphonate Market Volume K Tons Forecast, by Country 2019 & 2032
- Table 33: China Phosphonate Market Revenue (Million) Forecast, by Application 2019 & 2032
- Table 34: China Phosphonate Market Volume (K Tons) Forecast, by Application 2019 & 2032
- Table 35: Japan Phosphonate Market Revenue (Million) Forecast, by Application 2019 & 2032
- Table 36: Japan Phosphonate Market Volume (K Tons) Forecast, by Application 2019 & 2032
- Table 37: India Phosphonate Market Revenue (Million) Forecast, by Application 2019 & 2032
- Table 38: India Phosphonate Market Volume (K Tons) Forecast, by Application 2019 & 2032
- Table 39: South Korea Phosphonate Market Revenue (Million) Forecast, by Application 2019 & 2032
- Table 40: South Korea Phosphonate Market Volume (K Tons) Forecast, by Application 2019 & 2032
- Table 41: Taiwan Phosphonate Market Revenue (Million) Forecast, by Application 2019 & 2032
- Table 42: Taiwan Phosphonate Market Volume (K Tons) Forecast, by Application 2019 & 2032
- Table 43: Australia Phosphonate Market Revenue (Million) Forecast, by Application 2019 & 2032
- Table 44: Australia Phosphonate Market Volume (K Tons) Forecast, by Application 2019 & 2032
- Table 45: Rest of Asia-Pacific Phosphonate Market Revenue (Million) Forecast, by Application 2019 & 2032
- Table 46: Rest of Asia-Pacific Phosphonate Market Volume (K Tons) Forecast, by Application 2019 & 2032
- Table 47: Global Phosphonate Market Revenue Million Forecast, by Country 2019 & 2032
- Table 48: Global Phosphonate Market Volume K Tons Forecast, by Country 2019 & 2032
- Table 49: Brazil Phosphonate Market Revenue (Million) Forecast, by Application 2019 & 2032
- Table 50: Brazil Phosphonate Market Volume (K Tons) Forecast, by Application 2019 & 2032
- Table 51: Argentina Phosphonate Market Revenue (Million) Forecast, by Application 2019 & 2032
- Table 52: Argentina Phosphonate Market Volume (K Tons) Forecast, by Application 2019 & 2032
- Table 53: Rest of South America Phosphonate Market Revenue (Million) Forecast, by Application 2019 & 2032
- Table 54: Rest of South America Phosphonate Market Volume (K Tons) Forecast, by Application 2019 & 2032
- Table 55: Global Phosphonate Market Revenue Million Forecast, by Country 2019 & 2032
- Table 56: Global Phosphonate Market Volume K Tons Forecast, by Country 2019 & 2032
- Table 57: Middle East Phosphonate Market Revenue (Million) Forecast, by Application 2019 & 2032
- Table 58: Middle East Phosphonate Market Volume (K Tons) Forecast, by Application 2019 & 2032
- Table 59: Africa Phosphonate Market Revenue (Million) Forecast, by Application 2019 & 2032
- Table 60: Africa Phosphonate Market Volume (K Tons) Forecast, by Application 2019 & 2032
- Table 61: Global Phosphonate Market Revenue Million Forecast, by Types 2019 & 2032
- Table 62: Global Phosphonate Market Volume K Tons Forecast, by Types 2019 & 2032
- Table 63: Global Phosphonate Market Revenue Million Forecast, by End-user Industry 2019 & 2032
- Table 64: Global Phosphonate Market Volume K Tons Forecast, by End-user Industry 2019 & 2032
- Table 65: Global Phosphonate Market Revenue Million Forecast, by Country 2019 & 2032
- Table 66: Global Phosphonate Market Volume K Tons Forecast, by Country 2019 & 2032
- Table 67: China Phosphonate Market Revenue (Million) Forecast, by Application 2019 & 2032
- Table 68: China Phosphonate Market Volume (K Tons) Forecast, by Application 2019 & 2032
- Table 69: India Phosphonate Market Revenue (Million) Forecast, by Application 2019 & 2032
- Table 70: India Phosphonate Market Volume (K Tons) Forecast, by Application 2019 & 2032
- Table 71: Japan Phosphonate Market Revenue (Million) Forecast, by Application 2019 & 2032
- Table 72: Japan Phosphonate Market Volume (K Tons) Forecast, by Application 2019 & 2032
- Table 73: South Korea Phosphonate Market Revenue (Million) Forecast, by Application 2019 & 2032
- Table 74: South Korea Phosphonate Market Volume (K Tons) Forecast, by Application 2019 & 2032
- Table 75: Malaysia Phosphonate Market Revenue (Million) Forecast, by Application 2019 & 2032
- Table 76: Malaysia Phosphonate Market Volume (K Tons) Forecast, by Application 2019 & 2032
- Table 77: Thailand Phosphonate Market Revenue (Million) Forecast, by Application 2019 & 2032
- Table 78: Thailand Phosphonate Market Volume (K Tons) Forecast, by Application 2019 & 2032
- Table 79: Indonesia Phosphonate Market Revenue (Million) Forecast, by Application 2019 & 2032
- Table 80: Indonesia Phosphonate Market Volume (K Tons) Forecast, by Application 2019 & 2032
- Table 81: Vietnam Phosphonate Market Revenue (Million) Forecast, by Application 2019 & 2032
- Table 82: Vietnam Phosphonate Market Volume (K Tons) Forecast, by Application 2019 & 2032
- Table 83: Rest of Asia Pacific Phosphonate Market Revenue (Million) Forecast, by Application 2019 & 2032
- Table 84: Rest of Asia Pacific Phosphonate Market Volume (K Tons) Forecast, by Application 2019 & 2032
- Table 85: Global Phosphonate Market Revenue Million Forecast, by Types 2019 & 2032
- Table 86: Global Phosphonate Market Volume K Tons Forecast, by Types 2019 & 2032
- Table 87: Global Phosphonate Market Revenue Million Forecast, by End-user Industry 2019 & 2032
- Table 88: Global Phosphonate Market Volume K Tons Forecast, by End-user Industry 2019 & 2032
- Table 89: Global Phosphonate Market Revenue Million Forecast, by Country 2019 & 2032
- Table 90: Global Phosphonate Market Volume K Tons Forecast, by Country 2019 & 2032
- Table 91: United States Phosphonate Market Revenue (Million) Forecast, by Application 2019 & 2032
- Table 92: United States Phosphonate Market Volume (K Tons) Forecast, by Application 2019 & 2032
- Table 93: Canada Phosphonate Market Revenue (Million) Forecast, by Application 2019 & 2032
- Table 94: Canada Phosphonate Market Volume (K Tons) Forecast, by Application 2019 & 2032
- Table 95: Mexico Phosphonate Market Revenue (Million) Forecast, by Application 2019 & 2032
- Table 96: Mexico Phosphonate Market Volume (K Tons) Forecast, by Application 2019 & 2032
- Table 97: Global Phosphonate Market Revenue Million Forecast, by Types 2019 & 2032
- Table 98: Global Phosphonate Market Volume K Tons Forecast, by Types 2019 & 2032
- Table 99: Global Phosphonate Market Revenue Million Forecast, by End-user Industry 2019 & 2032
- Table 100: Global Phosphonate Market Volume K Tons Forecast, by End-user Industry 2019 & 2032
- Table 101: Global Phosphonate Market Revenue Million Forecast, by Country 2019 & 2032
- Table 102: Global Phosphonate Market Volume K Tons Forecast, by Country 2019 & 2032
- Table 103: Germany Phosphonate Market Revenue (Million) Forecast, by Application 2019 & 2032
- Table 104: Germany Phosphonate Market Volume (K Tons) Forecast, by Application 2019 & 2032
- Table 105: United Kingdom Phosphonate Market Revenue (Million) Forecast, by Application 2019 & 2032
- Table 106: United Kingdom Phosphonate Market Volume (K Tons) Forecast, by Application 2019 & 2032
- Table 107: France Phosphonate Market Revenue (Million) Forecast, by Application 2019 & 2032
- Table 108: France Phosphonate Market Volume (K Tons) Forecast, by Application 2019 & 2032
- Table 109: Italy Phosphonate Market Revenue (Million) Forecast, by Application 2019 & 2032
- Table 110: Italy Phosphonate Market Volume (K Tons) Forecast, by Application 2019 & 2032
- Table 111: Spain Phosphonate Market Revenue (Million) Forecast, by Application 2019 & 2032
- Table 112: Spain Phosphonate Market Volume (K Tons) Forecast, by Application 2019 & 2032
- Table 113: NORDIC Countries Phosphonate Market Revenue (Million) Forecast, by Application 2019 & 2032
- Table 114: NORDIC Countries Phosphonate Market Volume (K Tons) Forecast, by Application 2019 & 2032
- Table 115: Turkey Phosphonate Market Revenue (Million) Forecast, by Application 2019 & 2032
- Table 116: Turkey Phosphonate Market Volume (K Tons) Forecast, by Application 2019 & 2032
- Table 117: Russia Phosphonate Market Revenue (Million) Forecast, by Application 2019 & 2032
- Table 118: Russia Phosphonate Market Volume (K Tons) Forecast, by Application 2019 & 2032
- Table 119: Rest of Europe Phosphonate Market Revenue (Million) Forecast, by Application 2019 & 2032
- Table 120: Rest of Europe Phosphonate Market Volume (K Tons) Forecast, by Application 2019 & 2032
- Table 121: Global Phosphonate Market Revenue Million Forecast, by Types 2019 & 2032
- Table 122: Global Phosphonate Market Volume K Tons Forecast, by Types 2019 & 2032
- Table 123: Global Phosphonate Market Revenue Million Forecast, by End-user Industry 2019 & 2032
- Table 124: Global Phosphonate Market Volume K Tons Forecast, by End-user Industry 2019 & 2032
- Table 125: Global Phosphonate Market Revenue Million Forecast, by Country 2019 & 2032
- Table 126: Global Phosphonate Market Volume K Tons Forecast, by Country 2019 & 2032
- Table 127: Brazil Phosphonate Market Revenue (Million) Forecast, by Application 2019 & 2032
- Table 128: Brazil Phosphonate Market Volume (K Tons) Forecast, by Application 2019 & 2032
- Table 129: Argentina Phosphonate Market Revenue (Million) Forecast, by Application 2019 & 2032
- Table 130: Argentina Phosphonate Market Volume (K Tons) Forecast, by Application 2019 & 2032
- Table 131: Colombia Phosphonate Market Revenue (Million) Forecast, by Application 2019 & 2032
- Table 132: Colombia Phosphonate Market Volume (K Tons) Forecast, by Application 2019 & 2032
- Table 133: Rest of South America Phosphonate Market Revenue (Million) Forecast, by Application 2019 & 2032
- Table 134: Rest of South America Phosphonate Market Volume (K Tons) Forecast, by Application 2019 & 2032
- Table 135: Global Phosphonate Market Revenue Million Forecast, by Types 2019 & 2032
- Table 136: Global Phosphonate Market Volume K Tons Forecast, by Types 2019 & 2032
- Table 137: Global Phosphonate Market Revenue Million Forecast, by End-user Industry 2019 & 2032
- Table 138: Global Phosphonate Market Volume K Tons Forecast, by End-user Industry 2019 & 2032
- Table 139: Global Phosphonate Market Revenue Million Forecast, by Country 2019 & 2032
- Table 140: Global Phosphonate Market Volume K Tons Forecast, by Country 2019 & 2032
- Table 141: Saudi Arabia Phosphonate Market Revenue (Million) Forecast, by Application 2019 & 2032
- Table 142: Saudi Arabia Phosphonate Market Volume (K Tons) Forecast, by Application 2019 & 2032
- Table 143: Qatar Phosphonate Market Revenue (Million) Forecast, by Application 2019 & 2032
- Table 144: Qatar Phosphonate Market Volume (K Tons) Forecast, by Application 2019 & 2032
- Table 145: United Arab Emirates Phosphonate Market Revenue (Million) Forecast, by Application 2019 & 2032
- Table 146: United Arab Emirates Phosphonate Market Volume (K Tons) Forecast, by Application 2019 & 2032
- Table 147: Nigeria Phosphonate Market Revenue (Million) Forecast, by Application 2019 & 2032
- Table 148: Nigeria Phosphonate Market Volume (K Tons) Forecast, by Application 2019 & 2032
- Table 149: Egypt Phosphonate Market Revenue (Million) Forecast, by Application 2019 & 2032
- Table 150: Egypt Phosphonate Market Volume (K Tons) Forecast, by Application 2019 & 2032
- Table 151: South Africa Phosphonate Market Revenue (Million) Forecast, by Application 2019 & 2032
- Table 152: South Africa Phosphonate Market Volume (K Tons) Forecast, by Application 2019 & 2032
- Table 153: Rest of Middle East and Africa Phosphonate Market Revenue (Million) Forecast, by Application 2019 & 2032
- Table 154: Rest of Middle East and Africa Phosphonate Market Volume (K Tons) Forecast, by Application 2019 & 2032
Frequently Asked Questions
1. What is the projected Compound Annual Growth Rate (CAGR) of the Phosphonate Market?
The projected CAGR is approximately 4.65%.
2. Which companies are prominent players in the Phosphonate Market?
Key companies in the market include MKS DevO Chemicals, ZSCHIMMER & SCHWARZ CHEMIE GMBH, Zaozhuang Kerui Chemicals Co Ltd, Italmatch AWS, Protection Technology Co Ltd, Biesterfeld AG, Shandong Xintai Water Treatment Technology Co Ltd, Excel Industries, LANXESS, Henan Qingshuiyuan Technolog, Jiangsu Yuanquan Hongguang Environmental, Uniphos Chemicals, Aquapharm Chemical Pvt Ltd, Shandong Taihe Watre Treatment Technologies Co Ltd, IRO Group, Bozzetto Group, Changzhou Kewei Fine Chemicals Co Ltd.
3. What are the main segments of the Phosphonate Market?
The market segments include Types, End-user Industry.
4. Can you provide details about the market size?
The market size is estimated to be USD 0.98 Million as of 2022.
5. What are some drivers contributing to market growth?
Wide Applications of Phosphonates in the Water Treatment Industry; Rapid Growth of the Cleaners and Detergents Industry.
6. What are the notable trends driving market growth?
Increasing Demand in the Water Treatment Industry.
7. Are there any restraints impacting market growth?
Environmental impact due to non-degradable nature.
8. Can you provide examples of recent developments in the market?
In Oct 2021, Bisterfeld AG announced the acquisition of GME Chemicals to expand its presence in Asia.
9. What pricing options are available for accessing the report?
Pricing options include single-user, multi-user, and enterprise licenses priced at USD 4750, USD 5250, and USD 8750 respectively.
10. Is the market size provided in terms of value or volume?
The market size is provided in terms of value, measured in Million and volume, measured in K Tons.
11. Are there any specific market keywords associated with the report?
Yes, the market keyword associated with the report is "Phosphonate Market," which aids in identifying and referencing the specific market segment covered.
12. How do I determine which pricing option suits my needs best?
The pricing options vary based on user requirements and access needs. Individual users may opt for single-user licenses, while businesses requiring broader access may choose multi-user or enterprise licenses for cost-effective access to the report.
13. Are there any additional resources or data provided in the Phosphonate Market report?
While the report offers comprehensive insights, it's advisable to review the specific contents or supplementary materials provided to ascertain if additional resources or data are available.
14. How can I stay updated on further developments or reports in the Phosphonate Market?
To stay informed about further developments, trends, and reports in the Phosphonate Market, consider subscribing to industry newsletters, following relevant companies and organizations, or regularly checking reputable industry news sources and publications.
Methodology
Step 1 - Identification of Relevant Samples Size from Population Database


Step 2 - Approaches for Defining Global Market Size (Value, Volume* & Price*)

Note*: In applicable scenarios
Step 3 - Data Sources
Primary Research
- Web Analytics
- Survey Reports
- Research Institute
- Latest Research Reports
- Opinion Leaders
Secondary Research
- Annual Reports
- White Paper
- Latest Press Release
- Industry Association
- Paid Database
- Investor Presentations

Step 4 - Data Triangulation
Involves using different sources of information in order to increase the validity of a study
These sources are likely to be stakeholders in a program - participants, other researchers, program staff, other community members, and so on.
Then we put all data in single framework & apply various statistical tools to find out the dynamic on the market.
During the analysis stage, feedback from the stakeholder groups would be compared to determine areas of agreement as well as areas of divergence


