
Key Insights
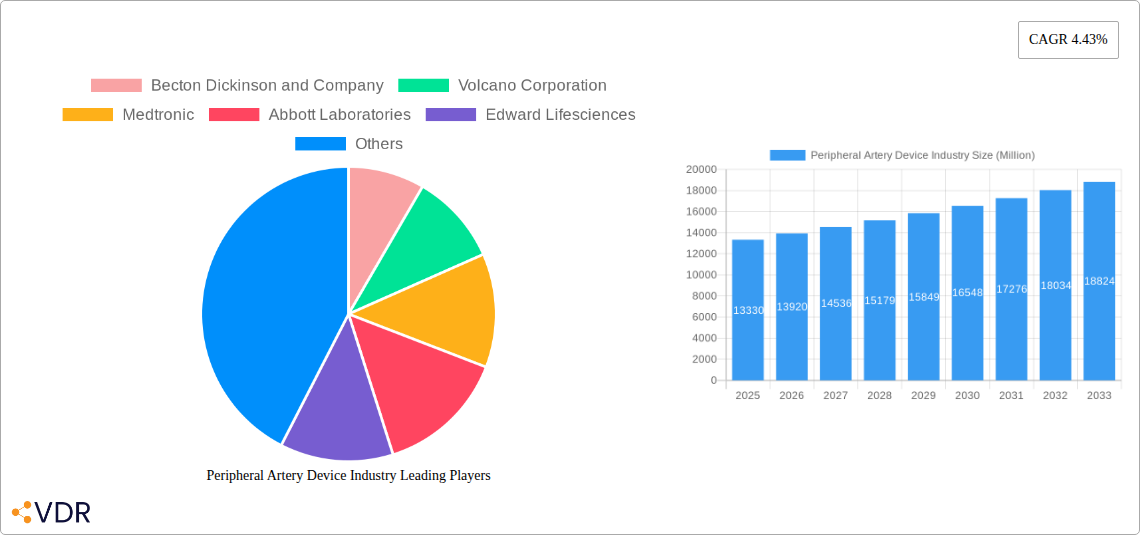
The peripheral artery disease (PAD) device market, valued at approximately $13.33 billion in 2025, is projected to experience steady growth, driven by a rising prevalence of PAD, particularly among the aging population. This growth is further fueled by advancements in minimally invasive procedures, such as peripheral transluminal angioplasty (PTA) and the development of innovative devices like drug-eluting stents and atherectomy devices that improve treatment outcomes and reduce the need for major surgical interventions. Increased healthcare spending in developed nations and rising awareness about PAD contribute significantly to market expansion. However, factors like high procedure costs, potential complications associated with certain devices, and the availability of alternative treatment options act as restraints on market growth. The market is segmented by device type, with peripheral vascular stents, PTA balloon catheters, and PTA guidewires holding significant market share, reflecting the widespread adoption of PTA procedures. Geographic segmentation reveals strong market presence in North America and Europe, driven by advanced healthcare infrastructure and high adoption rates. The Asia-Pacific region is expected to showcase substantial growth potential in the forecast period, owing to rising healthcare expenditure and increasing prevalence of PAD in rapidly developing economies. Competition is intense among major players like Becton Dickinson, Medtronic, and Boston Scientific, each striving to innovate and capture market share through strategic partnerships, product diversification, and geographical expansion.
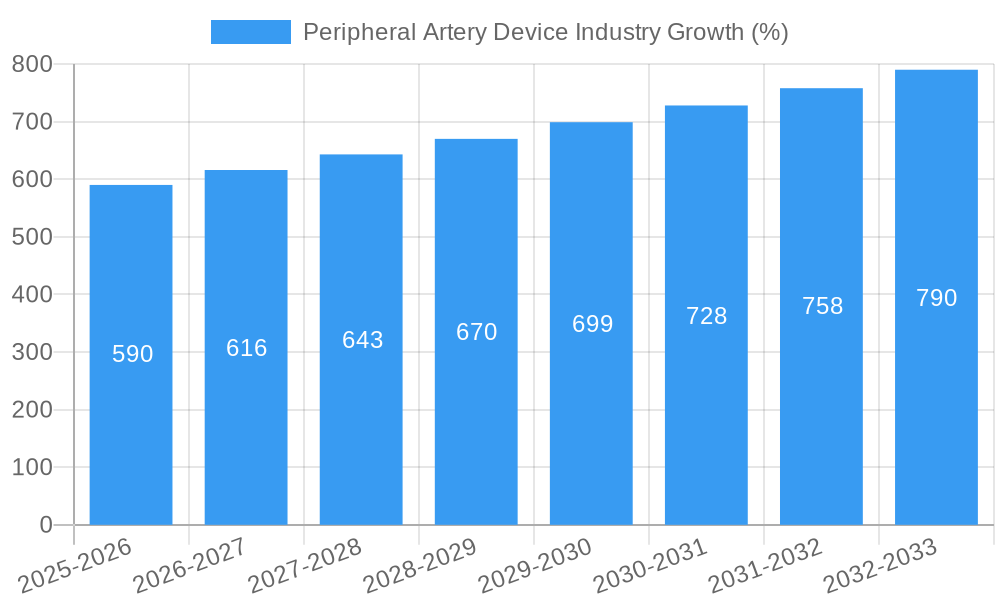
The projected CAGR of 4.43% for the period 2025-2033 suggests a consistent, albeit moderate, expansion. This growth is likely to be influenced by the ongoing research and development in the field leading to improved device designs and efficacy. Furthermore, government initiatives focused on reducing the burden of cardiovascular diseases and improved access to healthcare in emerging markets will likely contribute to the market's overall growth trajectory. However, pricing pressures, regulatory hurdles, and the need for rigorous clinical trials to demonstrate the superior efficacy of newer devices could influence the pace of expansion. The market's continued segmentation will enable manufacturers to tailor products and services to meet diverse patient needs and healthcare provider preferences, leading to improved patient outcomes and market penetration.
Peripheral Artery Device Industry Market Report: 2019-2033
This comprehensive report provides an in-depth analysis of the Peripheral Artery Device (PAD) industry, encompassing market dynamics, growth trends, regional analysis, product landscape, and key players. The report covers the parent market of Vascular Devices and the child market of Peripheral Artery Devices, offering a granular view of this vital sector within the medical device industry. The study period spans from 2019 to 2033, with a base year of 2025 and a forecast period of 2025-2033. The historical period covered is 2019-2024. Expected market values are presented in million units.
Peripheral Artery Device Industry Market Dynamics & Structure
The global peripheral artery device market is characterized by moderate concentration, with key players like Becton Dickinson and Company, Medtronic, Abbott Laboratories, and Boston Scientific Corporation holding significant market share. The market's structure is influenced by technological innovation, particularly in drug-eluting stents and minimally invasive procedures. Stringent regulatory frameworks, like those enforced by the FDA, impact product approvals and market entry. Competitive substitutes, such as alternative treatment methods, exert pressure on market growth. End-user demographics, skewed towards an aging population with a higher prevalence of PAD, are a significant driver. Furthermore, M&A activity plays a crucial role in shaping the market landscape. Between 2019 and 2024, approximately xx M&A deals were recorded in the PAD device market, representing an average annual deal volume of xx deals. This consolidation is driven by a desire to expand product portfolios, enhance R&D capabilities, and gain market access.
- Market Concentration: Moderately concentrated, with top players holding xx% market share.
- Technological Innovation: Significant advancements in drug-eluting stents and minimally invasive techniques are major growth drivers.
- Regulatory Framework: Stringent FDA approvals influence market entry and product lifecycle.
- Competitive Substitutes: Alternative treatments pose a moderate competitive threat.
- End-User Demographics: Aging population with rising PAD prevalence fuels demand.
- M&A Activity: xx M&A deals between 2019-2024, driving consolidation and expansion.
- Innovation Barriers: High R&D costs and rigorous regulatory hurdles are key challenges.
Peripheral Artery Device Industry Growth Trends & Insights
The global peripheral artery device market exhibited a CAGR of xx% during the historical period (2019-2024), reaching an estimated market size of xx million units in 2025. Adoption rates are increasing due to growing awareness of PAD, improved diagnostic techniques, and technological advancements resulting in less invasive procedures. This is further fueled by the expanding geriatric population, increased prevalence of risk factors like diabetes and smoking, and a greater understanding of the benefits of early intervention. Technological disruptions, such as the introduction of drug-eluting stents and advanced imaging modalities, continue to drive market expansion. Consumer behavior is shifting towards minimally invasive procedures, thereby influencing product development and market preferences. We project a CAGR of xx% from 2025 to 2033, leading to a market size of xx million units by 2033. Market penetration is expected to increase from xx% in 2025 to xx% by 2033, driven by factors like improved access to healthcare and growing awareness of PAD.
Dominant Regions, Countries, or Segments in Peripheral Artery Device Industry
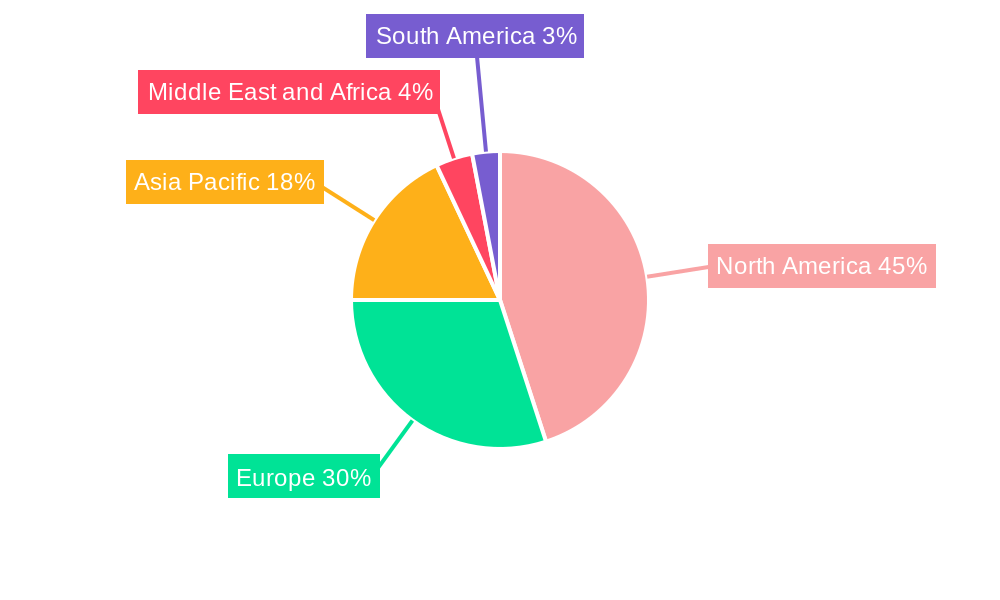
North America currently dominates the peripheral artery device market, driven by high healthcare expenditure, advanced medical infrastructure, and a large patient population. Within North America, the United States holds the largest market share. Europe follows as the second-largest market, with Western European countries showing higher adoption rates than Eastern European countries due to differences in healthcare infrastructure and economic development. Asia Pacific exhibits strong growth potential, driven by expanding healthcare infrastructure and rising disposable income. Amongst device types, Peripheral Vascular Stents hold the largest market share, followed by Peripheral Transluminal Angioplasty (PTA) Balloon Catheters and Guidewires. The growth of each segment is influenced by factors such as technological advancements, regulatory changes, and disease prevalence.
- North America: Highest market share due to advanced healthcare and high PAD prevalence.
- Europe: Second-largest market, with Western Europe leading due to superior infrastructure.
- Asia Pacific: High growth potential driven by infrastructural development and rising income.
- Device Type Dominance: Peripheral Vascular Stents hold the largest market share followed by PTA Balloon Catheters and Guidewires.
- Key Drivers: Aging population, increasing PAD prevalence, technological advancements, and improved healthcare access.
Peripheral Artery Device Industry Product Landscape
The peripheral artery device market showcases a diverse range of products, each with unique selling propositions. Peripheral vascular stents are characterized by improved biocompatibility and drug-eluting properties for enhanced efficacy and reduced restenosis. PTA balloon catheters are continuously being refined for improved deliverability and performance. Atherectomy devices are being developed with increased precision and efficiency, minimizing trauma to the vessel wall. Innovation focuses on minimally invasive techniques, improved material science, and enhanced drug delivery mechanisms, leading to better patient outcomes and reduced recovery times.
Key Drivers, Barriers & Challenges in Peripheral Artery Device Industry
Key Drivers:
- Increasing prevalence of cardiovascular diseases (CVDs) including PAD, driven by factors such as aging populations, diabetes, and unhealthy lifestyles.
- Technological advancements leading to improved device design, functionality, and safety.
- Growing awareness of PAD and the benefits of early intervention among healthcare professionals and patients.
- Favorable regulatory environment and increasing healthcare expenditure in developed and developing economies.
Challenges and Restraints:
- High cost of devices and procedures can limit accessibility in resource-constrained settings.
- Stringent regulatory requirements for new device approvals can prolong the development and market entry processes.
- Competition from alternative treatments and the potential for off-label use.
- Potential supply chain disruptions and the challenges of maintaining a consistent supply of raw materials. The impact of these challenges can lead to xx% reduction in market growth annually.
Emerging Opportunities in Peripheral Artery Device Industry
- Growing demand for minimally invasive procedures and advanced imaging techniques creates new opportunities for device manufacturers.
- Expanding use of drug-eluting stents and other innovative technologies is driving market expansion.
- Untapped markets in developing countries represent significant potential for future growth.
- Increasing focus on personalized medicine offers opportunities for tailored device designs and therapies.
Growth Accelerators in the Peripheral Artery Device Industry
Technological breakthroughs, such as the development of bioabsorbable stents and advanced imaging technologies, are key growth catalysts. Strategic partnerships between device manufacturers and healthcare providers enhance market penetration and clinical adoption. Expansion into new markets and unmet clinical needs drive further growth. A focus on improving patient outcomes and minimizing procedural complications will also be instrumental in boosting market growth.
Key Players Shaping the Peripheral Artery Device Industry Market
- Becton Dickinson and Company
- Volcano Corporation
- Medtronic
- Abbott Laboratories
- Edward Lifesciences
- Cook
- Boston Scientific Corporation
- Cordis Corporation
Notable Milestones in Peripheral Artery Device Industry Sector
- June 2022: Cardio Flow, Inc. receives FDA approval for its FreedomFlow Peripheral Guidewire.
- January 2022: Cook Medical receives FDA breakthrough device designation for a new drug-eluting stent for below-the-knee (BTK) applications.
In-Depth Peripheral Artery Device Industry Market Outlook
The peripheral artery device market is poised for sustained growth, driven by technological innovation, expanding healthcare infrastructure, and an aging global population. Strategic partnerships, focused R&D, and expansion into emerging markets will be crucial for companies seeking to capitalize on this growth potential. The market's future hinges on continuous innovation, resulting in safer, more effective devices and treatments, coupled with improved accessibility in underserved regions.
Peripheral Artery Device Industry Segmentation
-
1. Device Type
- 1.1. Peripheral Vascular Stents
- 1.2. Peripher
- 1.3. Peripher
- 1.4. Atherectomy Devices
- 1.5. Embolic Protection Devices
- 1.6. Inferior Vena Cava Filters
- 1.7. Other Device Types
Peripheral Artery Device Industry Segmentation By Geography
-
1. North America
- 1.1. United States
- 1.2. Canada
- 1.3. Mexico
-
2. Europe
- 2.1. Germany
- 2.2. United Kingdom
- 2.3. France
- 2.4. Italy
- 2.5. Spain
- 2.6. Rest of Europe
-
3. Asia Pacific
- 3.1. China
- 3.2. Japan
- 3.3. India
- 3.4. Australia
- 3.5. South Korea
- 3.6. Rest of Asia Pacific
-
4. Middle East and Africa
- 4.1. GCC
- 4.2. South Africa
- 4.3. Rest of Middle East and Africa
-
5. South America
- 5.1. Brazil
- 5.2. Argentina
- 5.3. Rest of South America
Peripheral Artery Device Industry REPORT HIGHLIGHTS
| Aspects | Details |
|---|---|
| Study Period | 2019-2033 |
| Base Year | 2024 |
| Estimated Year | 2025 |
| Forecast Period | 2025-2033 |
| Historical Period | 2019-2024 |
| Growth Rate | CAGR of 4.43% from 2019-2033 |
| Segmentation |
|
Table of Contents
- 1. Introduction
- 1.1. Research Scope
- 1.2. Market Segmentation
- 1.3. Research Methodology
- 1.4. Definitions and Assumptions
- 2. Executive Summary
- 2.1. Introduction
- 3. Market Dynamics
- 3.1. Introduction
- 3.2. Market Drivers
- 3.2.1. Rising Demand for Minimally-invasive Procedures; Increase in Incidence of Peripheral Arterial Disease (PAD)
- 3.3. Market Restrains
- 3.3.1. Stringent Regulation Related to Peripheral Vascular Devices
- 3.4. Market Trends
- 3.4.1. Peripheral Vascular Stents are expected to witness growth over the forecast period
- 4. Market Factor Analysis
- 4.1. Porters Five Forces
- 4.2. Supply/Value Chain
- 4.3. PESTEL analysis
- 4.4. Market Entropy
- 4.5. Patent/Trademark Analysis
- 5. Global Peripheral Artery Device Industry Analysis, Insights and Forecast, 2019-2031
- 5.1. Market Analysis, Insights and Forecast - by Device Type
- 5.1.1. Peripheral Vascular Stents
- 5.1.2. Peripher
- 5.1.3. Peripher
- 5.1.4. Atherectomy Devices
- 5.1.5. Embolic Protection Devices
- 5.1.6. Inferior Vena Cava Filters
- 5.1.7. Other Device Types
- 5.2. Market Analysis, Insights and Forecast - by Region
- 5.2.1. North America
- 5.2.2. Europe
- 5.2.3. Asia Pacific
- 5.2.4. Middle East and Africa
- 5.2.5. South America
- 5.1. Market Analysis, Insights and Forecast - by Device Type
- 6. North America Peripheral Artery Device Industry Analysis, Insights and Forecast, 2019-2031
- 6.1. Market Analysis, Insights and Forecast - by Device Type
- 6.1.1. Peripheral Vascular Stents
- 6.1.2. Peripher
- 6.1.3. Peripher
- 6.1.4. Atherectomy Devices
- 6.1.5. Embolic Protection Devices
- 6.1.6. Inferior Vena Cava Filters
- 6.1.7. Other Device Types
- 6.1. Market Analysis, Insights and Forecast - by Device Type
- 7. Europe Peripheral Artery Device Industry Analysis, Insights and Forecast, 2019-2031
- 7.1. Market Analysis, Insights and Forecast - by Device Type
- 7.1.1. Peripheral Vascular Stents
- 7.1.2. Peripher
- 7.1.3. Peripher
- 7.1.4. Atherectomy Devices
- 7.1.5. Embolic Protection Devices
- 7.1.6. Inferior Vena Cava Filters
- 7.1.7. Other Device Types
- 7.1. Market Analysis, Insights and Forecast - by Device Type
- 8. Asia Pacific Peripheral Artery Device Industry Analysis, Insights and Forecast, 2019-2031
- 8.1. Market Analysis, Insights and Forecast - by Device Type
- 8.1.1. Peripheral Vascular Stents
- 8.1.2. Peripher
- 8.1.3. Peripher
- 8.1.4. Atherectomy Devices
- 8.1.5. Embolic Protection Devices
- 8.1.6. Inferior Vena Cava Filters
- 8.1.7. Other Device Types
- 8.1. Market Analysis, Insights and Forecast - by Device Type
- 9. Middle East and Africa Peripheral Artery Device Industry Analysis, Insights and Forecast, 2019-2031
- 9.1. Market Analysis, Insights and Forecast - by Device Type
- 9.1.1. Peripheral Vascular Stents
- 9.1.2. Peripher
- 9.1.3. Peripher
- 9.1.4. Atherectomy Devices
- 9.1.5. Embolic Protection Devices
- 9.1.6. Inferior Vena Cava Filters
- 9.1.7. Other Device Types
- 9.1. Market Analysis, Insights and Forecast - by Device Type
- 10. South America Peripheral Artery Device Industry Analysis, Insights and Forecast, 2019-2031
- 10.1. Market Analysis, Insights and Forecast - by Device Type
- 10.1.1. Peripheral Vascular Stents
- 10.1.2. Peripher
- 10.1.3. Peripher
- 10.1.4. Atherectomy Devices
- 10.1.5. Embolic Protection Devices
- 10.1.6. Inferior Vena Cava Filters
- 10.1.7. Other Device Types
- 10.1. Market Analysis, Insights and Forecast - by Device Type
- 11. North America Peripheral Artery Device Industry Analysis, Insights and Forecast, 2019-2031
- 11.1. Market Analysis, Insights and Forecast - By Country/Sub-region
- 11.1.1 United States
- 11.1.2 Canada
- 11.1.3 Mexico
- 12. Europe Peripheral Artery Device Industry Analysis, Insights and Forecast, 2019-2031
- 12.1. Market Analysis, Insights and Forecast - By Country/Sub-region
- 12.1.1 Germany
- 12.1.2 United Kingdom
- 12.1.3 France
- 12.1.4 Italy
- 12.1.5 Spain
- 12.1.6 Rest of Europe
- 13. Asia Pacific Peripheral Artery Device Industry Analysis, Insights and Forecast, 2019-2031
- 13.1. Market Analysis, Insights and Forecast - By Country/Sub-region
- 13.1.1 China
- 13.1.2 Japan
- 13.1.3 India
- 13.1.4 Australia
- 13.1.5 South Korea
- 13.1.6 Rest of Asia Pacific
- 14. Middle East and Africa Peripheral Artery Device Industry Analysis, Insights and Forecast, 2019-2031
- 14.1. Market Analysis, Insights and Forecast - By Country/Sub-region
- 14.1.1 GCC
- 14.1.2 South Africa
- 14.1.3 Rest of Middle East and Africa
- 15. South America Peripheral Artery Device Industry Analysis, Insights and Forecast, 2019-2031
- 15.1. Market Analysis, Insights and Forecast - By Country/Sub-region
- 15.1.1 Brazil
- 15.1.2 Argentina
- 15.1.3 Rest of South America
- 16. Competitive Analysis
- 16.1. Global Market Share Analysis 2024
- 16.2. Company Profiles
- 16.2.1 Becton Dickinson and Company
- 16.2.1.1. Overview
- 16.2.1.2. Products
- 16.2.1.3. SWOT Analysis
- 16.2.1.4. Recent Developments
- 16.2.1.5. Financials (Based on Availability)
- 16.2.2 Volcano Corporation
- 16.2.2.1. Overview
- 16.2.2.2. Products
- 16.2.2.3. SWOT Analysis
- 16.2.2.4. Recent Developments
- 16.2.2.5. Financials (Based on Availability)
- 16.2.3 Medtronic
- 16.2.3.1. Overview
- 16.2.3.2. Products
- 16.2.3.3. SWOT Analysis
- 16.2.3.4. Recent Developments
- 16.2.3.5. Financials (Based on Availability)
- 16.2.4 Abbott Laboratories
- 16.2.4.1. Overview
- 16.2.4.2. Products
- 16.2.4.3. SWOT Analysis
- 16.2.4.4. Recent Developments
- 16.2.4.5. Financials (Based on Availability)
- 16.2.5 Edward Lifesciences
- 16.2.5.1. Overview
- 16.2.5.2. Products
- 16.2.5.3. SWOT Analysis
- 16.2.5.4. Recent Developments
- 16.2.5.5. Financials (Based on Availability)
- 16.2.6 Cook
- 16.2.6.1. Overview
- 16.2.6.2. Products
- 16.2.6.3. SWOT Analysis
- 16.2.6.4. Recent Developments
- 16.2.6.5. Financials (Based on Availability)
- 16.2.7 Boston Scientific Corporation
- 16.2.7.1. Overview
- 16.2.7.2. Products
- 16.2.7.3. SWOT Analysis
- 16.2.7.4. Recent Developments
- 16.2.7.5. Financials (Based on Availability)
- 16.2.8 Cordis Corporation
- 16.2.8.1. Overview
- 16.2.8.2. Products
- 16.2.8.3. SWOT Analysis
- 16.2.8.4. Recent Developments
- 16.2.8.5. Financials (Based on Availability)
- 16.2.1 Becton Dickinson and Company
List of Figures
- Figure 1: Global Peripheral Artery Device Industry Revenue Breakdown (Million, %) by Region 2024 & 2032
- Figure 2: Global Peripheral Artery Device Industry Volume Breakdown (K Units, %) by Region 2024 & 2032
- Figure 3: North America Peripheral Artery Device Industry Revenue (Million), by Country 2024 & 2032
- Figure 4: North America Peripheral Artery Device Industry Volume (K Units), by Country 2024 & 2032
- Figure 5: North America Peripheral Artery Device Industry Revenue Share (%), by Country 2024 & 2032
- Figure 6: North America Peripheral Artery Device Industry Volume Share (%), by Country 2024 & 2032
- Figure 7: Europe Peripheral Artery Device Industry Revenue (Million), by Country 2024 & 2032
- Figure 8: Europe Peripheral Artery Device Industry Volume (K Units), by Country 2024 & 2032
- Figure 9: Europe Peripheral Artery Device Industry Revenue Share (%), by Country 2024 & 2032
- Figure 10: Europe Peripheral Artery Device Industry Volume Share (%), by Country 2024 & 2032
- Figure 11: Asia Pacific Peripheral Artery Device Industry Revenue (Million), by Country 2024 & 2032
- Figure 12: Asia Pacific Peripheral Artery Device Industry Volume (K Units), by Country 2024 & 2032
- Figure 13: Asia Pacific Peripheral Artery Device Industry Revenue Share (%), by Country 2024 & 2032
- Figure 14: Asia Pacific Peripheral Artery Device Industry Volume Share (%), by Country 2024 & 2032
- Figure 15: Middle East and Africa Peripheral Artery Device Industry Revenue (Million), by Country 2024 & 2032
- Figure 16: Middle East and Africa Peripheral Artery Device Industry Volume (K Units), by Country 2024 & 2032
- Figure 17: Middle East and Africa Peripheral Artery Device Industry Revenue Share (%), by Country 2024 & 2032
- Figure 18: Middle East and Africa Peripheral Artery Device Industry Volume Share (%), by Country 2024 & 2032
- Figure 19: South America Peripheral Artery Device Industry Revenue (Million), by Country 2024 & 2032
- Figure 20: South America Peripheral Artery Device Industry Volume (K Units), by Country 2024 & 2032
- Figure 21: South America Peripheral Artery Device Industry Revenue Share (%), by Country 2024 & 2032
- Figure 22: South America Peripheral Artery Device Industry Volume Share (%), by Country 2024 & 2032
- Figure 23: North America Peripheral Artery Device Industry Revenue (Million), by Device Type 2024 & 2032
- Figure 24: North America Peripheral Artery Device Industry Volume (K Units), by Device Type 2024 & 2032
- Figure 25: North America Peripheral Artery Device Industry Revenue Share (%), by Device Type 2024 & 2032
- Figure 26: North America Peripheral Artery Device Industry Volume Share (%), by Device Type 2024 & 2032
- Figure 27: North America Peripheral Artery Device Industry Revenue (Million), by Country 2024 & 2032
- Figure 28: North America Peripheral Artery Device Industry Volume (K Units), by Country 2024 & 2032
- Figure 29: North America Peripheral Artery Device Industry Revenue Share (%), by Country 2024 & 2032
- Figure 30: North America Peripheral Artery Device Industry Volume Share (%), by Country 2024 & 2032
- Figure 31: Europe Peripheral Artery Device Industry Revenue (Million), by Device Type 2024 & 2032
- Figure 32: Europe Peripheral Artery Device Industry Volume (K Units), by Device Type 2024 & 2032
- Figure 33: Europe Peripheral Artery Device Industry Revenue Share (%), by Device Type 2024 & 2032
- Figure 34: Europe Peripheral Artery Device Industry Volume Share (%), by Device Type 2024 & 2032
- Figure 35: Europe Peripheral Artery Device Industry Revenue (Million), by Country 2024 & 2032
- Figure 36: Europe Peripheral Artery Device Industry Volume (K Units), by Country 2024 & 2032
- Figure 37: Europe Peripheral Artery Device Industry Revenue Share (%), by Country 2024 & 2032
- Figure 38: Europe Peripheral Artery Device Industry Volume Share (%), by Country 2024 & 2032
- Figure 39: Asia Pacific Peripheral Artery Device Industry Revenue (Million), by Device Type 2024 & 2032
- Figure 40: Asia Pacific Peripheral Artery Device Industry Volume (K Units), by Device Type 2024 & 2032
- Figure 41: Asia Pacific Peripheral Artery Device Industry Revenue Share (%), by Device Type 2024 & 2032
- Figure 42: Asia Pacific Peripheral Artery Device Industry Volume Share (%), by Device Type 2024 & 2032
- Figure 43: Asia Pacific Peripheral Artery Device Industry Revenue (Million), by Country 2024 & 2032
- Figure 44: Asia Pacific Peripheral Artery Device Industry Volume (K Units), by Country 2024 & 2032
- Figure 45: Asia Pacific Peripheral Artery Device Industry Revenue Share (%), by Country 2024 & 2032
- Figure 46: Asia Pacific Peripheral Artery Device Industry Volume Share (%), by Country 2024 & 2032
- Figure 47: Middle East and Africa Peripheral Artery Device Industry Revenue (Million), by Device Type 2024 & 2032
- Figure 48: Middle East and Africa Peripheral Artery Device Industry Volume (K Units), by Device Type 2024 & 2032
- Figure 49: Middle East and Africa Peripheral Artery Device Industry Revenue Share (%), by Device Type 2024 & 2032
- Figure 50: Middle East and Africa Peripheral Artery Device Industry Volume Share (%), by Device Type 2024 & 2032
- Figure 51: Middle East and Africa Peripheral Artery Device Industry Revenue (Million), by Country 2024 & 2032
- Figure 52: Middle East and Africa Peripheral Artery Device Industry Volume (K Units), by Country 2024 & 2032
- Figure 53: Middle East and Africa Peripheral Artery Device Industry Revenue Share (%), by Country 2024 & 2032
- Figure 54: Middle East and Africa Peripheral Artery Device Industry Volume Share (%), by Country 2024 & 2032
- Figure 55: South America Peripheral Artery Device Industry Revenue (Million), by Device Type 2024 & 2032
- Figure 56: South America Peripheral Artery Device Industry Volume (K Units), by Device Type 2024 & 2032
- Figure 57: South America Peripheral Artery Device Industry Revenue Share (%), by Device Type 2024 & 2032
- Figure 58: South America Peripheral Artery Device Industry Volume Share (%), by Device Type 2024 & 2032
- Figure 59: South America Peripheral Artery Device Industry Revenue (Million), by Country 2024 & 2032
- Figure 60: South America Peripheral Artery Device Industry Volume (K Units), by Country 2024 & 2032
- Figure 61: South America Peripheral Artery Device Industry Revenue Share (%), by Country 2024 & 2032
- Figure 62: South America Peripheral Artery Device Industry Volume Share (%), by Country 2024 & 2032
List of Tables
- Table 1: Global Peripheral Artery Device Industry Revenue Million Forecast, by Region 2019 & 2032
- Table 2: Global Peripheral Artery Device Industry Volume K Units Forecast, by Region 2019 & 2032
- Table 3: Global Peripheral Artery Device Industry Revenue Million Forecast, by Device Type 2019 & 2032
- Table 4: Global Peripheral Artery Device Industry Volume K Units Forecast, by Device Type 2019 & 2032
- Table 5: Global Peripheral Artery Device Industry Revenue Million Forecast, by Region 2019 & 2032
- Table 6: Global Peripheral Artery Device Industry Volume K Units Forecast, by Region 2019 & 2032
- Table 7: Global Peripheral Artery Device Industry Revenue Million Forecast, by Country 2019 & 2032
- Table 8: Global Peripheral Artery Device Industry Volume K Units Forecast, by Country 2019 & 2032
- Table 9: United States Peripheral Artery Device Industry Revenue (Million) Forecast, by Application 2019 & 2032
- Table 10: United States Peripheral Artery Device Industry Volume (K Units) Forecast, by Application 2019 & 2032
- Table 11: Canada Peripheral Artery Device Industry Revenue (Million) Forecast, by Application 2019 & 2032
- Table 12: Canada Peripheral Artery Device Industry Volume (K Units) Forecast, by Application 2019 & 2032
- Table 13: Mexico Peripheral Artery Device Industry Revenue (Million) Forecast, by Application 2019 & 2032
- Table 14: Mexico Peripheral Artery Device Industry Volume (K Units) Forecast, by Application 2019 & 2032
- Table 15: Global Peripheral Artery Device Industry Revenue Million Forecast, by Country 2019 & 2032
- Table 16: Global Peripheral Artery Device Industry Volume K Units Forecast, by Country 2019 & 2032
- Table 17: Germany Peripheral Artery Device Industry Revenue (Million) Forecast, by Application 2019 & 2032
- Table 18: Germany Peripheral Artery Device Industry Volume (K Units) Forecast, by Application 2019 & 2032
- Table 19: United Kingdom Peripheral Artery Device Industry Revenue (Million) Forecast, by Application 2019 & 2032
- Table 20: United Kingdom Peripheral Artery Device Industry Volume (K Units) Forecast, by Application 2019 & 2032
- Table 21: France Peripheral Artery Device Industry Revenue (Million) Forecast, by Application 2019 & 2032
- Table 22: France Peripheral Artery Device Industry Volume (K Units) Forecast, by Application 2019 & 2032
- Table 23: Italy Peripheral Artery Device Industry Revenue (Million) Forecast, by Application 2019 & 2032
- Table 24: Italy Peripheral Artery Device Industry Volume (K Units) Forecast, by Application 2019 & 2032
- Table 25: Spain Peripheral Artery Device Industry Revenue (Million) Forecast, by Application 2019 & 2032
- Table 26: Spain Peripheral Artery Device Industry Volume (K Units) Forecast, by Application 2019 & 2032
- Table 27: Rest of Europe Peripheral Artery Device Industry Revenue (Million) Forecast, by Application 2019 & 2032
- Table 28: Rest of Europe Peripheral Artery Device Industry Volume (K Units) Forecast, by Application 2019 & 2032
- Table 29: Global Peripheral Artery Device Industry Revenue Million Forecast, by Country 2019 & 2032
- Table 30: Global Peripheral Artery Device Industry Volume K Units Forecast, by Country 2019 & 2032
- Table 31: China Peripheral Artery Device Industry Revenue (Million) Forecast, by Application 2019 & 2032
- Table 32: China Peripheral Artery Device Industry Volume (K Units) Forecast, by Application 2019 & 2032
- Table 33: Japan Peripheral Artery Device Industry Revenue (Million) Forecast, by Application 2019 & 2032
- Table 34: Japan Peripheral Artery Device Industry Volume (K Units) Forecast, by Application 2019 & 2032
- Table 35: India Peripheral Artery Device Industry Revenue (Million) Forecast, by Application 2019 & 2032
- Table 36: India Peripheral Artery Device Industry Volume (K Units) Forecast, by Application 2019 & 2032
- Table 37: Australia Peripheral Artery Device Industry Revenue (Million) Forecast, by Application 2019 & 2032
- Table 38: Australia Peripheral Artery Device Industry Volume (K Units) Forecast, by Application 2019 & 2032
- Table 39: South Korea Peripheral Artery Device Industry Revenue (Million) Forecast, by Application 2019 & 2032
- Table 40: South Korea Peripheral Artery Device Industry Volume (K Units) Forecast, by Application 2019 & 2032
- Table 41: Rest of Asia Pacific Peripheral Artery Device Industry Revenue (Million) Forecast, by Application 2019 & 2032
- Table 42: Rest of Asia Pacific Peripheral Artery Device Industry Volume (K Units) Forecast, by Application 2019 & 2032
- Table 43: Global Peripheral Artery Device Industry Revenue Million Forecast, by Country 2019 & 2032
- Table 44: Global Peripheral Artery Device Industry Volume K Units Forecast, by Country 2019 & 2032
- Table 45: GCC Peripheral Artery Device Industry Revenue (Million) Forecast, by Application 2019 & 2032
- Table 46: GCC Peripheral Artery Device Industry Volume (K Units) Forecast, by Application 2019 & 2032
- Table 47: South Africa Peripheral Artery Device Industry Revenue (Million) Forecast, by Application 2019 & 2032
- Table 48: South Africa Peripheral Artery Device Industry Volume (K Units) Forecast, by Application 2019 & 2032
- Table 49: Rest of Middle East and Africa Peripheral Artery Device Industry Revenue (Million) Forecast, by Application 2019 & 2032
- Table 50: Rest of Middle East and Africa Peripheral Artery Device Industry Volume (K Units) Forecast, by Application 2019 & 2032
- Table 51: Global Peripheral Artery Device Industry Revenue Million Forecast, by Country 2019 & 2032
- Table 52: Global Peripheral Artery Device Industry Volume K Units Forecast, by Country 2019 & 2032
- Table 53: Brazil Peripheral Artery Device Industry Revenue (Million) Forecast, by Application 2019 & 2032
- Table 54: Brazil Peripheral Artery Device Industry Volume (K Units) Forecast, by Application 2019 & 2032
- Table 55: Argentina Peripheral Artery Device Industry Revenue (Million) Forecast, by Application 2019 & 2032
- Table 56: Argentina Peripheral Artery Device Industry Volume (K Units) Forecast, by Application 2019 & 2032
- Table 57: Rest of South America Peripheral Artery Device Industry Revenue (Million) Forecast, by Application 2019 & 2032
- Table 58: Rest of South America Peripheral Artery Device Industry Volume (K Units) Forecast, by Application 2019 & 2032
- Table 59: Global Peripheral Artery Device Industry Revenue Million Forecast, by Device Type 2019 & 2032
- Table 60: Global Peripheral Artery Device Industry Volume K Units Forecast, by Device Type 2019 & 2032
- Table 61: Global Peripheral Artery Device Industry Revenue Million Forecast, by Country 2019 & 2032
- Table 62: Global Peripheral Artery Device Industry Volume K Units Forecast, by Country 2019 & 2032
- Table 63: United States Peripheral Artery Device Industry Revenue (Million) Forecast, by Application 2019 & 2032
- Table 64: United States Peripheral Artery Device Industry Volume (K Units) Forecast, by Application 2019 & 2032
- Table 65: Canada Peripheral Artery Device Industry Revenue (Million) Forecast, by Application 2019 & 2032
- Table 66: Canada Peripheral Artery Device Industry Volume (K Units) Forecast, by Application 2019 & 2032
- Table 67: Mexico Peripheral Artery Device Industry Revenue (Million) Forecast, by Application 2019 & 2032
- Table 68: Mexico Peripheral Artery Device Industry Volume (K Units) Forecast, by Application 2019 & 2032
- Table 69: Global Peripheral Artery Device Industry Revenue Million Forecast, by Device Type 2019 & 2032
- Table 70: Global Peripheral Artery Device Industry Volume K Units Forecast, by Device Type 2019 & 2032
- Table 71: Global Peripheral Artery Device Industry Revenue Million Forecast, by Country 2019 & 2032
- Table 72: Global Peripheral Artery Device Industry Volume K Units Forecast, by Country 2019 & 2032
- Table 73: Germany Peripheral Artery Device Industry Revenue (Million) Forecast, by Application 2019 & 2032
- Table 74: Germany Peripheral Artery Device Industry Volume (K Units) Forecast, by Application 2019 & 2032
- Table 75: United Kingdom Peripheral Artery Device Industry Revenue (Million) Forecast, by Application 2019 & 2032
- Table 76: United Kingdom Peripheral Artery Device Industry Volume (K Units) Forecast, by Application 2019 & 2032
- Table 77: France Peripheral Artery Device Industry Revenue (Million) Forecast, by Application 2019 & 2032
- Table 78: France Peripheral Artery Device Industry Volume (K Units) Forecast, by Application 2019 & 2032
- Table 79: Italy Peripheral Artery Device Industry Revenue (Million) Forecast, by Application 2019 & 2032
- Table 80: Italy Peripheral Artery Device Industry Volume (K Units) Forecast, by Application 2019 & 2032
- Table 81: Spain Peripheral Artery Device Industry Revenue (Million) Forecast, by Application 2019 & 2032
- Table 82: Spain Peripheral Artery Device Industry Volume (K Units) Forecast, by Application 2019 & 2032
- Table 83: Rest of Europe Peripheral Artery Device Industry Revenue (Million) Forecast, by Application 2019 & 2032
- Table 84: Rest of Europe Peripheral Artery Device Industry Volume (K Units) Forecast, by Application 2019 & 2032
- Table 85: Global Peripheral Artery Device Industry Revenue Million Forecast, by Device Type 2019 & 2032
- Table 86: Global Peripheral Artery Device Industry Volume K Units Forecast, by Device Type 2019 & 2032
- Table 87: Global Peripheral Artery Device Industry Revenue Million Forecast, by Country 2019 & 2032
- Table 88: Global Peripheral Artery Device Industry Volume K Units Forecast, by Country 2019 & 2032
- Table 89: China Peripheral Artery Device Industry Revenue (Million) Forecast, by Application 2019 & 2032
- Table 90: China Peripheral Artery Device Industry Volume (K Units) Forecast, by Application 2019 & 2032
- Table 91: Japan Peripheral Artery Device Industry Revenue (Million) Forecast, by Application 2019 & 2032
- Table 92: Japan Peripheral Artery Device Industry Volume (K Units) Forecast, by Application 2019 & 2032
- Table 93: India Peripheral Artery Device Industry Revenue (Million) Forecast, by Application 2019 & 2032
- Table 94: India Peripheral Artery Device Industry Volume (K Units) Forecast, by Application 2019 & 2032
- Table 95: Australia Peripheral Artery Device Industry Revenue (Million) Forecast, by Application 2019 & 2032
- Table 96: Australia Peripheral Artery Device Industry Volume (K Units) Forecast, by Application 2019 & 2032
- Table 97: South Korea Peripheral Artery Device Industry Revenue (Million) Forecast, by Application 2019 & 2032
- Table 98: South Korea Peripheral Artery Device Industry Volume (K Units) Forecast, by Application 2019 & 2032
- Table 99: Rest of Asia Pacific Peripheral Artery Device Industry Revenue (Million) Forecast, by Application 2019 & 2032
- Table 100: Rest of Asia Pacific Peripheral Artery Device Industry Volume (K Units) Forecast, by Application 2019 & 2032
- Table 101: Global Peripheral Artery Device Industry Revenue Million Forecast, by Device Type 2019 & 2032
- Table 102: Global Peripheral Artery Device Industry Volume K Units Forecast, by Device Type 2019 & 2032
- Table 103: Global Peripheral Artery Device Industry Revenue Million Forecast, by Country 2019 & 2032
- Table 104: Global Peripheral Artery Device Industry Volume K Units Forecast, by Country 2019 & 2032
- Table 105: GCC Peripheral Artery Device Industry Revenue (Million) Forecast, by Application 2019 & 2032
- Table 106: GCC Peripheral Artery Device Industry Volume (K Units) Forecast, by Application 2019 & 2032
- Table 107: South Africa Peripheral Artery Device Industry Revenue (Million) Forecast, by Application 2019 & 2032
- Table 108: South Africa Peripheral Artery Device Industry Volume (K Units) Forecast, by Application 2019 & 2032
- Table 109: Rest of Middle East and Africa Peripheral Artery Device Industry Revenue (Million) Forecast, by Application 2019 & 2032
- Table 110: Rest of Middle East and Africa Peripheral Artery Device Industry Volume (K Units) Forecast, by Application 2019 & 2032
- Table 111: Global Peripheral Artery Device Industry Revenue Million Forecast, by Device Type 2019 & 2032
- Table 112: Global Peripheral Artery Device Industry Volume K Units Forecast, by Device Type 2019 & 2032
- Table 113: Global Peripheral Artery Device Industry Revenue Million Forecast, by Country 2019 & 2032
- Table 114: Global Peripheral Artery Device Industry Volume K Units Forecast, by Country 2019 & 2032
- Table 115: Brazil Peripheral Artery Device Industry Revenue (Million) Forecast, by Application 2019 & 2032
- Table 116: Brazil Peripheral Artery Device Industry Volume (K Units) Forecast, by Application 2019 & 2032
- Table 117: Argentina Peripheral Artery Device Industry Revenue (Million) Forecast, by Application 2019 & 2032
- Table 118: Argentina Peripheral Artery Device Industry Volume (K Units) Forecast, by Application 2019 & 2032
- Table 119: Rest of South America Peripheral Artery Device Industry Revenue (Million) Forecast, by Application 2019 & 2032
- Table 120: Rest of South America Peripheral Artery Device Industry Volume (K Units) Forecast, by Application 2019 & 2032
Frequently Asked Questions
1. What is the projected Compound Annual Growth Rate (CAGR) of the Peripheral Artery Device Industry?
The projected CAGR is approximately 4.43%.
2. Which companies are prominent players in the Peripheral Artery Device Industry?
Key companies in the market include Becton Dickinson and Company, Volcano Corporation, Medtronic, Abbott Laboratories, Edward Lifesciences, Cook, Boston Scientific Corporation, Cordis Corporation.
3. What are the main segments of the Peripheral Artery Device Industry?
The market segments include Device Type.
4. Can you provide details about the market size?
The market size is estimated to be USD 13.33 Million as of 2022.
5. What are some drivers contributing to market growth?
Rising Demand for Minimally-invasive Procedures; Increase in Incidence of Peripheral Arterial Disease (PAD).
6. What are the notable trends driving market growth?
Peripheral Vascular Stents are expected to witness growth over the forecast period.
7. Are there any restraints impacting market growth?
Stringent Regulation Related to Peripheral Vascular Devices.
8. Can you provide examples of recent developments in the market?
In June 2022, Cardio Flow, Inc., a medical device company and manufacturer of minimally invasive peripheral vascular devices to treat peripheral artery disease (PAD), announced United States Food and Drug Administration (FDA) approval for the company's FreedomFlow Peripheral Guidewire.
9. What pricing options are available for accessing the report?
Pricing options include single-user, multi-user, and enterprise licenses priced at USD 4750, USD 5250, and USD 8750 respectively.
10. Is the market size provided in terms of value or volume?
The market size is provided in terms of value, measured in Million and volume, measured in K Units.
11. Are there any specific market keywords associated with the report?
Yes, the market keyword associated with the report is "Peripheral Artery Device Industry," which aids in identifying and referencing the specific market segment covered.
12. How do I determine which pricing option suits my needs best?
The pricing options vary based on user requirements and access needs. Individual users may opt for single-user licenses, while businesses requiring broader access may choose multi-user or enterprise licenses for cost-effective access to the report.
13. Are there any additional resources or data provided in the Peripheral Artery Device Industry report?
While the report offers comprehensive insights, it's advisable to review the specific contents or supplementary materials provided to ascertain if additional resources or data are available.
14. How can I stay updated on further developments or reports in the Peripheral Artery Device Industry?
To stay informed about further developments, trends, and reports in the Peripheral Artery Device Industry, consider subscribing to industry newsletters, following relevant companies and organizations, or regularly checking reputable industry news sources and publications.
Methodology
Step 1 - Identification of Relevant Samples Size from Population Database


Step 2 - Approaches for Defining Global Market Size (Value, Volume* & Price*)

Note*: In applicable scenarios
Step 3 - Data Sources
Primary Research
- Web Analytics
- Survey Reports
- Research Institute
- Latest Research Reports
- Opinion Leaders
Secondary Research
- Annual Reports
- White Paper
- Latest Press Release
- Industry Association
- Paid Database
- Investor Presentations

Step 4 - Data Triangulation
Involves using different sources of information in order to increase the validity of a study
These sources are likely to be stakeholders in a program - participants, other researchers, program staff, other community members, and so on.
Then we put all data in single framework & apply various statistical tools to find out the dynamic on the market.
During the analysis stage, feedback from the stakeholder groups would be compared to determine areas of agreement as well as areas of divergence


