Key Insights
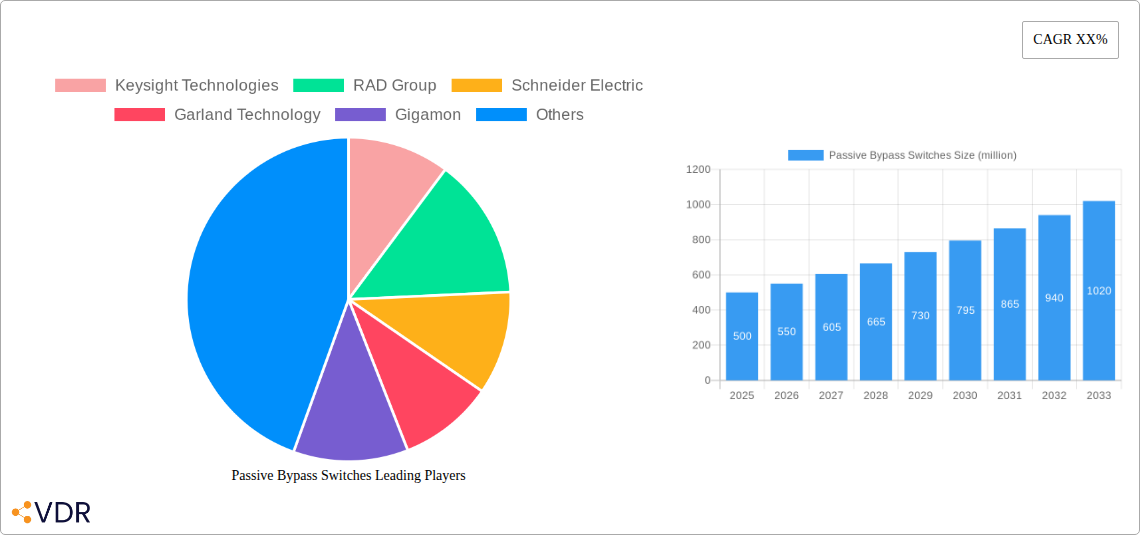
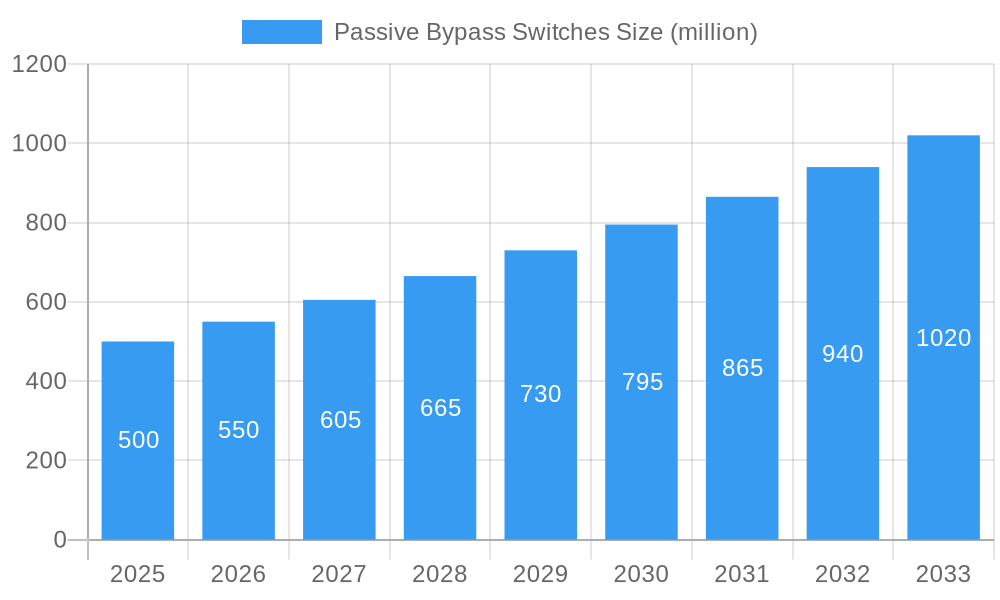
The passive bypass switch market is experiencing robust growth, driven by the increasing demand for high-availability network infrastructure and the rising adoption of virtualization and cloud computing. The market's expansion is fueled by the need for seamless network maintenance and upgrades without causing service disruptions. Key applications include data centers, telecommunications networks, and industrial automation systems, where minimizing downtime is critical. The market is segmented by switch type (e.g., 1x1, 2x2, NxN), port speed, and application. Major players like Keysight Technologies, Gigamon, and Schneider Electric are actively investing in research and development to enhance product features, including improved reliability, increased port density, and enhanced management capabilities. This competition fosters innovation and drives market growth. We estimate the market size in 2025 to be approximately $500 million, reflecting a healthy CAGR, and project further expansion to $800 million by 2033, driven by increasing data center deployments and the growing adoption of 5G and other high-bandwidth network technologies.
Passive Bypass Switches Market Size (In Million)
The market faces some restraints, primarily related to the relatively high initial investment costs associated with implementing passive bypass switches. However, the long-term benefits of reduced downtime and improved network uptime significantly outweigh this initial expense, encouraging adoption. Future trends indicate a move toward higher port density switches, supporting faster network speeds and increased bandwidth demands. Furthermore, integration with advanced network management systems and software-defined networking (SDN) is expected to drive increased adoption and enhance the overall value proposition of passive bypass switches. The growing adoption of virtualization and cloud-based services necessitates the use of such switches for uninterrupted network operations, furthering market growth.
Passive Bypass Switches Company Market Share
Passive Bypass Switches Market Report: 2019-2033
This comprehensive report provides an in-depth analysis of the Passive Bypass Switches market, encompassing market dynamics, growth trends, regional performance, product landscape, competitive analysis, and future outlook. The report covers the historical period from 2019 to 2024, with the base year being 2025 and the forecast period extending to 2033. The market is segmented by [Insert Segment details here - e.g., type, application, end-user industry]. This report is invaluable for industry professionals, investors, and strategic decision-makers seeking a clear understanding of this rapidly evolving market.
Passive Bypass Switches Market Dynamics & Structure
The Passive Bypass Switches market, valued at $xx million in 2025, exhibits a moderately concentrated landscape with Keysight Technologies, RAD Group, and Schneider Electric holding significant market share. Technological innovation, particularly in high-speed data transmission and network security, is a primary growth driver. Stringent regulatory compliance requirements across various industries further shape market dynamics. Competitive substitutes, such as [Insert examples of competitive substitutes here], exist but are often less efficient or versatile. The market is heavily influenced by the end-user demographics, with significant adoption in data centers, telecom infrastructure, and enterprise networks. M&A activity has been moderate in recent years, with approximately xx deals concluded between 2019 and 2024, primarily focused on consolidating market share and expanding product portfolios.
- Market Concentration: Moderately concentrated, with top 3 players holding approximately xx% market share in 2025.
- Technological Innovation: High-speed data transmission, advanced network security features drive innovation.
- Regulatory Frameworks: Compliance mandates influence product development and adoption rates.
- Competitive Substitutes: Limited number of efficient alternatives, enhancing market growth.
- End-User Demographics: Data centers, telecom, and enterprise networks are key end-users.
- M&A Trends: Moderate activity (xx deals from 2019-2024), focused on consolidation and portfolio expansion.
Passive Bypass Switches Growth Trends & Insights
The Passive Bypass Switches market witnessed robust growth during the historical period (2019-2024), expanding at a CAGR of xx%. This growth is attributed to the increasing adoption of high-bandwidth networks, the rising demand for network security solutions, and the proliferation of data centers globally. The market is expected to maintain its growth trajectory during the forecast period (2025-2033), with a projected CAGR of xx%, driven by technological advancements such as [Insert specific technological advancements here] and the expansion into new applications. Market penetration is projected to reach xx% by 2033. Consumer behavior shifts towards cloud computing and the Internet of Things (IoT) are significant factors fueling market expansion. Technological disruptions, such as the introduction of [Insert specific disruptive technology examples], will continue to reshape market dynamics and spur adoption.
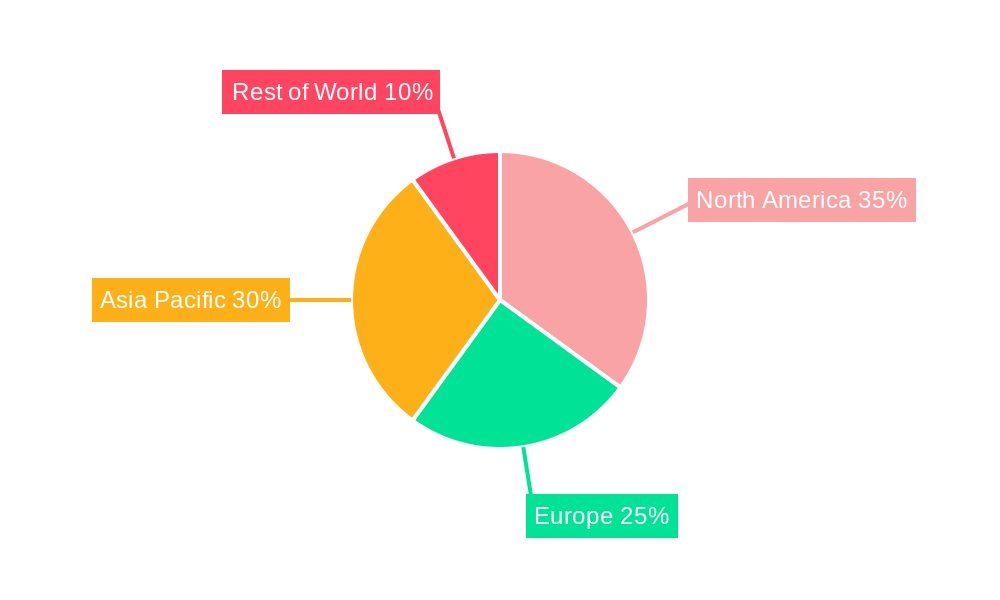
Dominant Regions, Countries, or Segments in Passive Bypass Switches
North America currently dominates the Passive Bypass Switches market, accounting for approximately xx% of the global market share in 2025. This dominance is attributed to several factors: a robust technological infrastructure, significant investments in data centers, a strong presence of major market players, and favorable government policies supporting technological advancement. Europe and Asia-Pacific are expected to witness substantial growth over the forecast period, driven by increasing network infrastructure development and rising digital transformation initiatives.
- Key Drivers in North America: Robust technological infrastructure, high data center density, strong presence of key players.
- Growth Potential in Europe: Increasing digitalization efforts, government investments in network infrastructure.
- Growth Potential in Asia-Pacific: Rapid economic growth, expanding data centers, rising adoption of cloud computing.
Passive Bypass Switches Product Landscape
Passive Bypass Switches are characterized by their diverse functionalities, ranging from basic network monitoring to sophisticated traffic analysis and security applications. Recent product innovations focus on enhancing data throughput, improved network visibility, and seamless integration with existing network infrastructure. Unique selling propositions often involve superior performance metrics, including lower latency, higher bandwidth, and enhanced security features.
Key Drivers, Barriers & Challenges in Passive Bypass Switches
Key Drivers:
- Increasing demand for high-bandwidth networks
- Growing adoption of cloud computing and IoT
- Need for enhanced network security and visibility
- Rising investments in data centers and telecom infrastructure
Key Barriers & Challenges:
- High initial investment costs can deter smaller organizations.
- Complexity of integration with existing network systems.
- Potential supply chain disruptions impacting component availability (estimated impact: xx% decrease in production in worst case scenarios).
- Regulatory compliance hurdles in specific regions.
Emerging Opportunities in Passive Bypass Switches
The Passive Bypass Switches market presents significant opportunities in untapped markets, such as [Insert examples of untapped markets]. The increasing adoption of edge computing creates new applications for these switches, enabling improved data processing and real-time analysis at the network edge. Furthermore, there's an emerging demand for solutions that support advanced network security protocols to mitigate threats in increasingly complex environments.
Growth Accelerators in the Passive Bypass Switches Industry
Technological breakthroughs in silicon photonics and advanced switching architectures are set to significantly boost the market's growth potential. Strategic partnerships between manufacturers and network service providers are creating innovative solutions tailored to specific industry needs. Continued expansion into emerging markets, such as [Insert examples of emerging markets], will create new avenues for growth and market expansion.
Key Players Shaping the Passive Bypass Switches Market
- Keysight Technologies
- RAD Group
- Schneider Electric
- Garland Technology
- Gigamon
- Niagara Networks
- Cubro Network Visibility
- Beijer Electronics
- Datacom Systems
- Advantech
- CTC Union Technologies
- MAIWE COMMUNICATION
- PLANET Technology
- Oring
Notable Milestones in Passive Bypass Switches Sector
- 2020: Keysight Technologies launches a new high-speed passive bypass switch.
- 2021: Schneider Electric acquires a smaller passive bypass switch manufacturer.
- 2022: RAD Group unveils its next-generation passive bypass switch with enhanced security features.
- 2023: Industry-wide adoption of new standards boosts interoperability.
- 2024: Gigamon releases software updates enhancing the capabilities of existing products.
In-Depth Passive Bypass Switches Market Outlook
The Passive Bypass Switches market is poised for continued growth driven by technological advancements, increasing network complexity, and the expanding adoption of cloud computing and IoT. Strategic partnerships and investments in R&D are paving the way for innovative solutions and enhancing market competitiveness. Focus on addressing challenges, such as supply chain disruptions and streamlining integration processes, will further unlock significant market potential and ensure long-term growth.
Passive Bypass Switches Segmentation
-
1. Application
- 1.1. Railway Communication System
- 1.2. Factory Automation
- 1.3. Power Substation
- 1.4. Others
-
2. Types
- 2.1. Static Bypass Switch
- 2.2. External Maintenance Bypass Switch
Passive Bypass Switches Segmentation By Geography
-
1. North America
- 1.1. United States
- 1.2. Canada
- 1.3. Mexico
-
2. South America
- 2.1. Brazil
- 2.2. Argentina
- 2.3. Rest of South America
-
3. Europe
- 3.1. United Kingdom
- 3.2. Germany
- 3.3. France
- 3.4. Italy
- 3.5. Spain
- 3.6. Russia
- 3.7. Benelux
- 3.8. Nordics
- 3.9. Rest of Europe
-
4. Middle East & Africa
- 4.1. Turkey
- 4.2. Israel
- 4.3. GCC
- 4.4. North Africa
- 4.5. South Africa
- 4.6. Rest of Middle East & Africa
-
5. Asia Pacific
- 5.1. China
- 5.2. India
- 5.3. Japan
- 5.4. South Korea
- 5.5. ASEAN
- 5.6. Oceania
- 5.7. Rest of Asia Pacific
Passive Bypass Switches Regional Market Share
Geographic Coverage of Passive Bypass Switches
Passive Bypass Switches REPORT HIGHLIGHTS
| Aspects | Details |
|---|---|
| Study Period | 2020-2034 |
| Base Year | 2025 |
| Estimated Year | 2026 |
| Forecast Period | 2026-2034 |
| Historical Period | 2020-2025 |
| Growth Rate | CAGR of 13.91% from 2020-2034 |
| Segmentation |
|
Table of Contents
- 1. Introduction
- 1.1. Research Scope
- 1.2. Market Segmentation
- 1.3. Research Objective
- 1.4. Definitions and Assumptions
- 2. Executive Summary
- 2.1. Market Snapshot
- 3. Market Dynamics
- 3.1. Market Drivers
- 3.2. Market Restrains
- 3.3. Market Trends
- 3.4. Market Opportunities
- 4. Market Factor Analysis
- 4.1. Porters Five Forces
- 4.1.1. Bargaining Power of Suppliers
- 4.1.2. Bargaining Power of Buyers
- 4.1.3. Threat of New Entrants
- 4.1.4. Threat of Substitutes
- 4.1.5. Competitive Rivalry
- 4.2. PESTEL analysis
- 4.3. BCG Analysis
- 4.3.1. Stars (High Growth, High Market Share)
- 4.3.2. Cash Cows (Low Growth, High Market Share)
- 4.3.3. Question Mark (High Growth, Low Market Share)
- 4.3.4. Dogs (Low Growth, Low Market Share)
- 4.4. Ansoff Matrix Analysis
- 4.5. Supply Chain Analysis
- 4.6. Regulatory Landscape
- 4.7. Current Market Potential and Opportunity Assessment (TAM–SAM–SOM Framework)
- 4.8. VDR Analyst Note
- 4.1. Porters Five Forces
- 5. Market Analysis, Insights and Forecast 2021-2033
- 5.1. Market Analysis, Insights and Forecast - by Application
- 5.1.1. Railway Communication System
- 5.1.2. Factory Automation
- 5.1.3. Power Substation
- 5.1.4. Others
- 5.2. Market Analysis, Insights and Forecast - by Types
- 5.2.1. Static Bypass Switch
- 5.2.2. External Maintenance Bypass Switch
- 5.3. Market Analysis, Insights and Forecast - by Region
- 5.3.1. North America
- 5.3.2. South America
- 5.3.3. Europe
- 5.3.4. Middle East & Africa
- 5.3.5. Asia Pacific
- 5.1. Market Analysis, Insights and Forecast - by Application
- 6. Global Passive Bypass Switches Analysis, Insights and Forecast, 2021-2033
- 6.1. Market Analysis, Insights and Forecast - by Application
- 6.1.1. Railway Communication System
- 6.1.2. Factory Automation
- 6.1.3. Power Substation
- 6.1.4. Others
- 6.2. Market Analysis, Insights and Forecast - by Types
- 6.2.1. Static Bypass Switch
- 6.2.2. External Maintenance Bypass Switch
- 6.1. Market Analysis, Insights and Forecast - by Application
- 7. North America Passive Bypass Switches Analysis, Insights and Forecast, 2021-2033
- 7.1. Market Analysis, Insights and Forecast - by Application
- 7.1.1. Railway Communication System
- 7.1.2. Factory Automation
- 7.1.3. Power Substation
- 7.1.4. Others
- 7.2. Market Analysis, Insights and Forecast - by Types
- 7.2.1. Static Bypass Switch
- 7.2.2. External Maintenance Bypass Switch
- 7.1. Market Analysis, Insights and Forecast - by Application
- 8. South America Passive Bypass Switches Analysis, Insights and Forecast, 2021-2033
- 8.1. Market Analysis, Insights and Forecast - by Application
- 8.1.1. Railway Communication System
- 8.1.2. Factory Automation
- 8.1.3. Power Substation
- 8.1.4. Others
- 8.2. Market Analysis, Insights and Forecast - by Types
- 8.2.1. Static Bypass Switch
- 8.2.2. External Maintenance Bypass Switch
- 8.1. Market Analysis, Insights and Forecast - by Application
- 9. Europe Passive Bypass Switches Analysis, Insights and Forecast, 2021-2033
- 9.1. Market Analysis, Insights and Forecast - by Application
- 9.1.1. Railway Communication System
- 9.1.2. Factory Automation
- 9.1.3. Power Substation
- 9.1.4. Others
- 9.2. Market Analysis, Insights and Forecast - by Types
- 9.2.1. Static Bypass Switch
- 9.2.2. External Maintenance Bypass Switch
- 9.1. Market Analysis, Insights and Forecast - by Application
- 10. Middle East & Africa Passive Bypass Switches Analysis, Insights and Forecast, 2021-2033
- 10.1. Market Analysis, Insights and Forecast - by Application
- 10.1.1. Railway Communication System
- 10.1.2. Factory Automation
- 10.1.3. Power Substation
- 10.1.4. Others
- 10.2. Market Analysis, Insights and Forecast - by Types
- 10.2.1. Static Bypass Switch
- 10.2.2. External Maintenance Bypass Switch
- 10.1. Market Analysis, Insights and Forecast - by Application
- 11. Asia Pacific Passive Bypass Switches Analysis, Insights and Forecast, 2021-2033
- 11.1. Market Analysis, Insights and Forecast - by Application
- 11.1.1. Railway Communication System
- 11.1.2. Factory Automation
- 11.1.3. Power Substation
- 11.1.4. Others
- 11.2. Market Analysis, Insights and Forecast - by Types
- 11.2.1. Static Bypass Switch
- 11.2.2. External Maintenance Bypass Switch
- 11.1. Market Analysis, Insights and Forecast - by Application
- 12. Competitive Analysis
- 12.1. Company Profiles
- 12.1.1 Keysight Technologies
- 12.1.1.1. Company Overview
- 12.1.1.2. Products
- 12.1.1.3. Company Financials
- 12.1.1.4. SWOT Analysis
- 12.1.2 RAD Group
- 12.1.2.1. Company Overview
- 12.1.2.2. Products
- 12.1.2.3. Company Financials
- 12.1.2.4. SWOT Analysis
- 12.1.3 Schneider Electric
- 12.1.3.1. Company Overview
- 12.1.3.2. Products
- 12.1.3.3. Company Financials
- 12.1.3.4. SWOT Analysis
- 12.1.4 Garland Technology
- 12.1.4.1. Company Overview
- 12.1.4.2. Products
- 12.1.4.3. Company Financials
- 12.1.4.4. SWOT Analysis
- 12.1.5 Gigamon
- 12.1.5.1. Company Overview
- 12.1.5.2. Products
- 12.1.5.3. Company Financials
- 12.1.5.4. SWOT Analysis
- 12.1.6 Niagara Networks
- 12.1.6.1. Company Overview
- 12.1.6.2. Products
- 12.1.6.3. Company Financials
- 12.1.6.4. SWOT Analysis
- 12.1.7 Cubro Network Visibility
- 12.1.7.1. Company Overview
- 12.1.7.2. Products
- 12.1.7.3. Company Financials
- 12.1.7.4. SWOT Analysis
- 12.1.8 Beijer Electronics
- 12.1.8.1. Company Overview
- 12.1.8.2. Products
- 12.1.8.3. Company Financials
- 12.1.8.4. SWOT Analysis
- 12.1.9 Datacom Systems
- 12.1.9.1. Company Overview
- 12.1.9.2. Products
- 12.1.9.3. Company Financials
- 12.1.9.4. SWOT Analysis
- 12.1.10 Advantech
- 12.1.10.1. Company Overview
- 12.1.10.2. Products
- 12.1.10.3. Company Financials
- 12.1.10.4. SWOT Analysis
- 12.1.11 CTC Union Technologies
- 12.1.11.1. Company Overview
- 12.1.11.2. Products
- 12.1.11.3. Company Financials
- 12.1.11.4. SWOT Analysis
- 12.1.12 MAIWE COMMUNICATION
- 12.1.12.1. Company Overview
- 12.1.12.2. Products
- 12.1.12.3. Company Financials
- 12.1.12.4. SWOT Analysis
- 12.1.13 PLANET Technology
- 12.1.13.1. Company Overview
- 12.1.13.2. Products
- 12.1.13.3. Company Financials
- 12.1.13.4. SWOT Analysis
- 12.1.14 Oring
- 12.1.14.1. Company Overview
- 12.1.14.2. Products
- 12.1.14.3. Company Financials
- 12.1.14.4. SWOT Analysis
- 12.1.1 Keysight Technologies
- 12.2. Market Entropy
- 12.2.1 Company's Key Areas Served
- 12.2.2 Recent Developments
- 12.3. Company Market Share Analysis 2025
- 12.3.1 Top 5 Companies Market Share Analysis
- 12.3.2 Top 3 Companies Market Share Analysis
- 12.4. List of Potential Customers
- 13. Research Methodology
List of Figures
- Figure 1: Global Passive Bypass Switches Revenue Breakdown (undefined, %) by Region 2025 & 2033
- Figure 2: Global Passive Bypass Switches Volume Breakdown (K, %) by Region 2025 & 2033
- Figure 3: North America Passive Bypass Switches Revenue (undefined), by Application 2025 & 2033
- Figure 4: North America Passive Bypass Switches Volume (K), by Application 2025 & 2033
- Figure 5: North America Passive Bypass Switches Revenue Share (%), by Application 2025 & 2033
- Figure 6: North America Passive Bypass Switches Volume Share (%), by Application 2025 & 2033
- Figure 7: North America Passive Bypass Switches Revenue (undefined), by Types 2025 & 2033
- Figure 8: North America Passive Bypass Switches Volume (K), by Types 2025 & 2033
- Figure 9: North America Passive Bypass Switches Revenue Share (%), by Types 2025 & 2033
- Figure 10: North America Passive Bypass Switches Volume Share (%), by Types 2025 & 2033
- Figure 11: North America Passive Bypass Switches Revenue (undefined), by Country 2025 & 2033
- Figure 12: North America Passive Bypass Switches Volume (K), by Country 2025 & 2033
- Figure 13: North America Passive Bypass Switches Revenue Share (%), by Country 2025 & 2033
- Figure 14: North America Passive Bypass Switches Volume Share (%), by Country 2025 & 2033
- Figure 15: South America Passive Bypass Switches Revenue (undefined), by Application 2025 & 2033
- Figure 16: South America Passive Bypass Switches Volume (K), by Application 2025 & 2033
- Figure 17: South America Passive Bypass Switches Revenue Share (%), by Application 2025 & 2033
- Figure 18: South America Passive Bypass Switches Volume Share (%), by Application 2025 & 2033
- Figure 19: South America Passive Bypass Switches Revenue (undefined), by Types 2025 & 2033
- Figure 20: South America Passive Bypass Switches Volume (K), by Types 2025 & 2033
- Figure 21: South America Passive Bypass Switches Revenue Share (%), by Types 2025 & 2033
- Figure 22: South America Passive Bypass Switches Volume Share (%), by Types 2025 & 2033
- Figure 23: South America Passive Bypass Switches Revenue (undefined), by Country 2025 & 2033
- Figure 24: South America Passive Bypass Switches Volume (K), by Country 2025 & 2033
- Figure 25: South America Passive Bypass Switches Revenue Share (%), by Country 2025 & 2033
- Figure 26: South America Passive Bypass Switches Volume Share (%), by Country 2025 & 2033
- Figure 27: Europe Passive Bypass Switches Revenue (undefined), by Application 2025 & 2033
- Figure 28: Europe Passive Bypass Switches Volume (K), by Application 2025 & 2033
- Figure 29: Europe Passive Bypass Switches Revenue Share (%), by Application 2025 & 2033
- Figure 30: Europe Passive Bypass Switches Volume Share (%), by Application 2025 & 2033
- Figure 31: Europe Passive Bypass Switches Revenue (undefined), by Types 2025 & 2033
- Figure 32: Europe Passive Bypass Switches Volume (K), by Types 2025 & 2033
- Figure 33: Europe Passive Bypass Switches Revenue Share (%), by Types 2025 & 2033
- Figure 34: Europe Passive Bypass Switches Volume Share (%), by Types 2025 & 2033
- Figure 35: Europe Passive Bypass Switches Revenue (undefined), by Country 2025 & 2033
- Figure 36: Europe Passive Bypass Switches Volume (K), by Country 2025 & 2033
- Figure 37: Europe Passive Bypass Switches Revenue Share (%), by Country 2025 & 2033
- Figure 38: Europe Passive Bypass Switches Volume Share (%), by Country 2025 & 2033
- Figure 39: Middle East & Africa Passive Bypass Switches Revenue (undefined), by Application 2025 & 2033
- Figure 40: Middle East & Africa Passive Bypass Switches Volume (K), by Application 2025 & 2033
- Figure 41: Middle East & Africa Passive Bypass Switches Revenue Share (%), by Application 2025 & 2033
- Figure 42: Middle East & Africa Passive Bypass Switches Volume Share (%), by Application 2025 & 2033
- Figure 43: Middle East & Africa Passive Bypass Switches Revenue (undefined), by Types 2025 & 2033
- Figure 44: Middle East & Africa Passive Bypass Switches Volume (K), by Types 2025 & 2033
- Figure 45: Middle East & Africa Passive Bypass Switches Revenue Share (%), by Types 2025 & 2033
- Figure 46: Middle East & Africa Passive Bypass Switches Volume Share (%), by Types 2025 & 2033
- Figure 47: Middle East & Africa Passive Bypass Switches Revenue (undefined), by Country 2025 & 2033
- Figure 48: Middle East & Africa Passive Bypass Switches Volume (K), by Country 2025 & 2033
- Figure 49: Middle East & Africa Passive Bypass Switches Revenue Share (%), by Country 2025 & 2033
- Figure 50: Middle East & Africa Passive Bypass Switches Volume Share (%), by Country 2025 & 2033
- Figure 51: Asia Pacific Passive Bypass Switches Revenue (undefined), by Application 2025 & 2033
- Figure 52: Asia Pacific Passive Bypass Switches Volume (K), by Application 2025 & 2033
- Figure 53: Asia Pacific Passive Bypass Switches Revenue Share (%), by Application 2025 & 2033
- Figure 54: Asia Pacific Passive Bypass Switches Volume Share (%), by Application 2025 & 2033
- Figure 55: Asia Pacific Passive Bypass Switches Revenue (undefined), by Types 2025 & 2033
- Figure 56: Asia Pacific Passive Bypass Switches Volume (K), by Types 2025 & 2033
- Figure 57: Asia Pacific Passive Bypass Switches Revenue Share (%), by Types 2025 & 2033
- Figure 58: Asia Pacific Passive Bypass Switches Volume Share (%), by Types 2025 & 2033
- Figure 59: Asia Pacific Passive Bypass Switches Revenue (undefined), by Country 2025 & 2033
- Figure 60: Asia Pacific Passive Bypass Switches Volume (K), by Country 2025 & 2033
- Figure 61: Asia Pacific Passive Bypass Switches Revenue Share (%), by Country 2025 & 2033
- Figure 62: Asia Pacific Passive Bypass Switches Volume Share (%), by Country 2025 & 2033
List of Tables
- Table 1: Global Passive Bypass Switches Revenue undefined Forecast, by Application 2020 & 2033
- Table 2: Global Passive Bypass Switches Volume K Forecast, by Application 2020 & 2033
- Table 3: Global Passive Bypass Switches Revenue undefined Forecast, by Types 2020 & 2033
- Table 4: Global Passive Bypass Switches Volume K Forecast, by Types 2020 & 2033
- Table 5: Global Passive Bypass Switches Revenue undefined Forecast, by Region 2020 & 2033
- Table 6: Global Passive Bypass Switches Volume K Forecast, by Region 2020 & 2033
- Table 7: Global Passive Bypass Switches Revenue undefined Forecast, by Application 2020 & 2033
- Table 8: Global Passive Bypass Switches Volume K Forecast, by Application 2020 & 2033
- Table 9: Global Passive Bypass Switches Revenue undefined Forecast, by Types 2020 & 2033
- Table 10: Global Passive Bypass Switches Volume K Forecast, by Types 2020 & 2033
- Table 11: Global Passive Bypass Switches Revenue undefined Forecast, by Country 2020 & 2033
- Table 12: Global Passive Bypass Switches Volume K Forecast, by Country 2020 & 2033
- Table 13: United States Passive Bypass Switches Revenue (undefined) Forecast, by Application 2020 & 2033
- Table 14: United States Passive Bypass Switches Volume (K) Forecast, by Application 2020 & 2033
- Table 15: Canada Passive Bypass Switches Revenue (undefined) Forecast, by Application 2020 & 2033
- Table 16: Canada Passive Bypass Switches Volume (K) Forecast, by Application 2020 & 2033
- Table 17: Mexico Passive Bypass Switches Revenue (undefined) Forecast, by Application 2020 & 2033
- Table 18: Mexico Passive Bypass Switches Volume (K) Forecast, by Application 2020 & 2033
- Table 19: Global Passive Bypass Switches Revenue undefined Forecast, by Application 2020 & 2033
- Table 20: Global Passive Bypass Switches Volume K Forecast, by Application 2020 & 2033
- Table 21: Global Passive Bypass Switches Revenue undefined Forecast, by Types 2020 & 2033
- Table 22: Global Passive Bypass Switches Volume K Forecast, by Types 2020 & 2033
- Table 23: Global Passive Bypass Switches Revenue undefined Forecast, by Country 2020 & 2033
- Table 24: Global Passive Bypass Switches Volume K Forecast, by Country 2020 & 2033
- Table 25: Brazil Passive Bypass Switches Revenue (undefined) Forecast, by Application 2020 & 2033
- Table 26: Brazil Passive Bypass Switches Volume (K) Forecast, by Application 2020 & 2033
- Table 27: Argentina Passive Bypass Switches Revenue (undefined) Forecast, by Application 2020 & 2033
- Table 28: Argentina Passive Bypass Switches Volume (K) Forecast, by Application 2020 & 2033
- Table 29: Rest of South America Passive Bypass Switches Revenue (undefined) Forecast, by Application 2020 & 2033
- Table 30: Rest of South America Passive Bypass Switches Volume (K) Forecast, by Application 2020 & 2033
- Table 31: Global Passive Bypass Switches Revenue undefined Forecast, by Application 2020 & 2033
- Table 32: Global Passive Bypass Switches Volume K Forecast, by Application 2020 & 2033
- Table 33: Global Passive Bypass Switches Revenue undefined Forecast, by Types 2020 & 2033
- Table 34: Global Passive Bypass Switches Volume K Forecast, by Types 2020 & 2033
- Table 35: Global Passive Bypass Switches Revenue undefined Forecast, by Country 2020 & 2033
- Table 36: Global Passive Bypass Switches Volume K Forecast, by Country 2020 & 2033
- Table 37: United Kingdom Passive Bypass Switches Revenue (undefined) Forecast, by Application 2020 & 2033
- Table 38: United Kingdom Passive Bypass Switches Volume (K) Forecast, by Application 2020 & 2033
- Table 39: Germany Passive Bypass Switches Revenue (undefined) Forecast, by Application 2020 & 2033
- Table 40: Germany Passive Bypass Switches Volume (K) Forecast, by Application 2020 & 2033
- Table 41: France Passive Bypass Switches Revenue (undefined) Forecast, by Application 2020 & 2033
- Table 42: France Passive Bypass Switches Volume (K) Forecast, by Application 2020 & 2033
- Table 43: Italy Passive Bypass Switches Revenue (undefined) Forecast, by Application 2020 & 2033
- Table 44: Italy Passive Bypass Switches Volume (K) Forecast, by Application 2020 & 2033
- Table 45: Spain Passive Bypass Switches Revenue (undefined) Forecast, by Application 2020 & 2033
- Table 46: Spain Passive Bypass Switches Volume (K) Forecast, by Application 2020 & 2033
- Table 47: Russia Passive Bypass Switches Revenue (undefined) Forecast, by Application 2020 & 2033
- Table 48: Russia Passive Bypass Switches Volume (K) Forecast, by Application 2020 & 2033
- Table 49: Benelux Passive Bypass Switches Revenue (undefined) Forecast, by Application 2020 & 2033
- Table 50: Benelux Passive Bypass Switches Volume (K) Forecast, by Application 2020 & 2033
- Table 51: Nordics Passive Bypass Switches Revenue (undefined) Forecast, by Application 2020 & 2033
- Table 52: Nordics Passive Bypass Switches Volume (K) Forecast, by Application 2020 & 2033
- Table 53: Rest of Europe Passive Bypass Switches Revenue (undefined) Forecast, by Application 2020 & 2033
- Table 54: Rest of Europe Passive Bypass Switches Volume (K) Forecast, by Application 2020 & 2033
- Table 55: Global Passive Bypass Switches Revenue undefined Forecast, by Application 2020 & 2033
- Table 56: Global Passive Bypass Switches Volume K Forecast, by Application 2020 & 2033
- Table 57: Global Passive Bypass Switches Revenue undefined Forecast, by Types 2020 & 2033
- Table 58: Global Passive Bypass Switches Volume K Forecast, by Types 2020 & 2033
- Table 59: Global Passive Bypass Switches Revenue undefined Forecast, by Country 2020 & 2033
- Table 60: Global Passive Bypass Switches Volume K Forecast, by Country 2020 & 2033
- Table 61: Turkey Passive Bypass Switches Revenue (undefined) Forecast, by Application 2020 & 2033
- Table 62: Turkey Passive Bypass Switches Volume (K) Forecast, by Application 2020 & 2033
- Table 63: Israel Passive Bypass Switches Revenue (undefined) Forecast, by Application 2020 & 2033
- Table 64: Israel Passive Bypass Switches Volume (K) Forecast, by Application 2020 & 2033
- Table 65: GCC Passive Bypass Switches Revenue (undefined) Forecast, by Application 2020 & 2033
- Table 66: GCC Passive Bypass Switches Volume (K) Forecast, by Application 2020 & 2033
- Table 67: North Africa Passive Bypass Switches Revenue (undefined) Forecast, by Application 2020 & 2033
- Table 68: North Africa Passive Bypass Switches Volume (K) Forecast, by Application 2020 & 2033
- Table 69: South Africa Passive Bypass Switches Revenue (undefined) Forecast, by Application 2020 & 2033
- Table 70: South Africa Passive Bypass Switches Volume (K) Forecast, by Application 2020 & 2033
- Table 71: Rest of Middle East & Africa Passive Bypass Switches Revenue (undefined) Forecast, by Application 2020 & 2033
- Table 72: Rest of Middle East & Africa Passive Bypass Switches Volume (K) Forecast, by Application 2020 & 2033
- Table 73: Global Passive Bypass Switches Revenue undefined Forecast, by Application 2020 & 2033
- Table 74: Global Passive Bypass Switches Volume K Forecast, by Application 2020 & 2033
- Table 75: Global Passive Bypass Switches Revenue undefined Forecast, by Types 2020 & 2033
- Table 76: Global Passive Bypass Switches Volume K Forecast, by Types 2020 & 2033
- Table 77: Global Passive Bypass Switches Revenue undefined Forecast, by Country 2020 & 2033
- Table 78: Global Passive Bypass Switches Volume K Forecast, by Country 2020 & 2033
- Table 79: China Passive Bypass Switches Revenue (undefined) Forecast, by Application 2020 & 2033
- Table 80: China Passive Bypass Switches Volume (K) Forecast, by Application 2020 & 2033
- Table 81: India Passive Bypass Switches Revenue (undefined) Forecast, by Application 2020 & 2033
- Table 82: India Passive Bypass Switches Volume (K) Forecast, by Application 2020 & 2033
- Table 83: Japan Passive Bypass Switches Revenue (undefined) Forecast, by Application 2020 & 2033
- Table 84: Japan Passive Bypass Switches Volume (K) Forecast, by Application 2020 & 2033
- Table 85: South Korea Passive Bypass Switches Revenue (undefined) Forecast, by Application 2020 & 2033
- Table 86: South Korea Passive Bypass Switches Volume (K) Forecast, by Application 2020 & 2033
- Table 87: ASEAN Passive Bypass Switches Revenue (undefined) Forecast, by Application 2020 & 2033
- Table 88: ASEAN Passive Bypass Switches Volume (K) Forecast, by Application 2020 & 2033
- Table 89: Oceania Passive Bypass Switches Revenue (undefined) Forecast, by Application 2020 & 2033
- Table 90: Oceania Passive Bypass Switches Volume (K) Forecast, by Application 2020 & 2033
- Table 91: Rest of Asia Pacific Passive Bypass Switches Revenue (undefined) Forecast, by Application 2020 & 2033
- Table 92: Rest of Asia Pacific Passive Bypass Switches Volume (K) Forecast, by Application 2020 & 2033
Frequently Asked Questions
1. What is the projected Compound Annual Growth Rate (CAGR) of the Passive Bypass Switches?
The projected CAGR is approximately 13.91%.
2. Which companies are prominent players in the Passive Bypass Switches?
Key companies in the market include Keysight Technologies, RAD Group, Schneider Electric, Garland Technology, Gigamon, Niagara Networks, Cubro Network Visibility, Beijer Electronics, Datacom Systems, Advantech, CTC Union Technologies, MAIWE COMMUNICATION, PLANET Technology, Oring.
3. What are the main segments of the Passive Bypass Switches?
The market segments include Application, Types.
4. Can you provide details about the market size?
The market size is estimated to be USD XXX N/A as of 2022.
5. What are some drivers contributing to market growth?
N/A
6. What are the notable trends driving market growth?
N/A
7. Are there any restraints impacting market growth?
N/A
8. Can you provide examples of recent developments in the market?
N/A
9. What pricing options are available for accessing the report?
Pricing options include single-user, multi-user, and enterprise licenses priced at USD 4350.00, USD 6525.00, and USD 8700.00 respectively.
10. Is the market size provided in terms of value or volume?
The market size is provided in terms of value, measured in N/A and volume, measured in K.
11. Are there any specific market keywords associated with the report?
Yes, the market keyword associated with the report is "Passive Bypass Switches," which aids in identifying and referencing the specific market segment covered.
12. How do I determine which pricing option suits my needs best?
The pricing options vary based on user requirements and access needs. Individual users may opt for single-user licenses, while businesses requiring broader access may choose multi-user or enterprise licenses for cost-effective access to the report.
13. Are there any additional resources or data provided in the Passive Bypass Switches report?
While the report offers comprehensive insights, it's advisable to review the specific contents or supplementary materials provided to ascertain if additional resources or data are available.
14. How can I stay updated on further developments or reports in the Passive Bypass Switches?
To stay informed about further developments, trends, and reports in the Passive Bypass Switches, consider subscribing to industry newsletters, following relevant companies and organizations, or regularly checking reputable industry news sources and publications.
Methodology
Step 1 - Identification of Relevant Samples Size from Population Database


Step 2 - Approaches for Defining Global Market Size (Value, Volume* & Price*)

Note*: In applicable scenarios
Step 3 - Data Sources
Primary Research
- Web Analytics
- Survey Reports
- Research Institute
- Latest Research Reports
- Opinion Leaders
Secondary Research
- Annual Reports
- White Paper
- Latest Press Release
- Industry Association
- Paid Database
- Investor Presentations

Step 4 - Data Triangulation
Involves using different sources of information in order to increase the validity of a study
These sources are likely to be stakeholders in a program - participants, other researchers, program staff, other community members, and so on.
Then we put all data in single framework & apply various statistical tools to find out the dynamic on the market.
During the analysis stage, feedback from the stakeholder groups would be compared to determine areas of agreement as well as areas of divergence

