
Key Insights
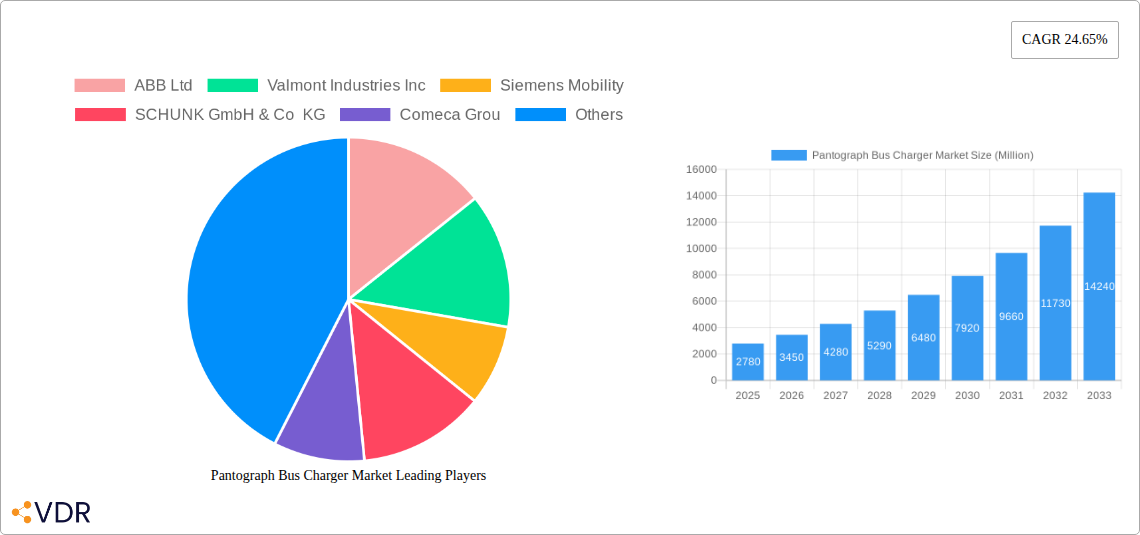
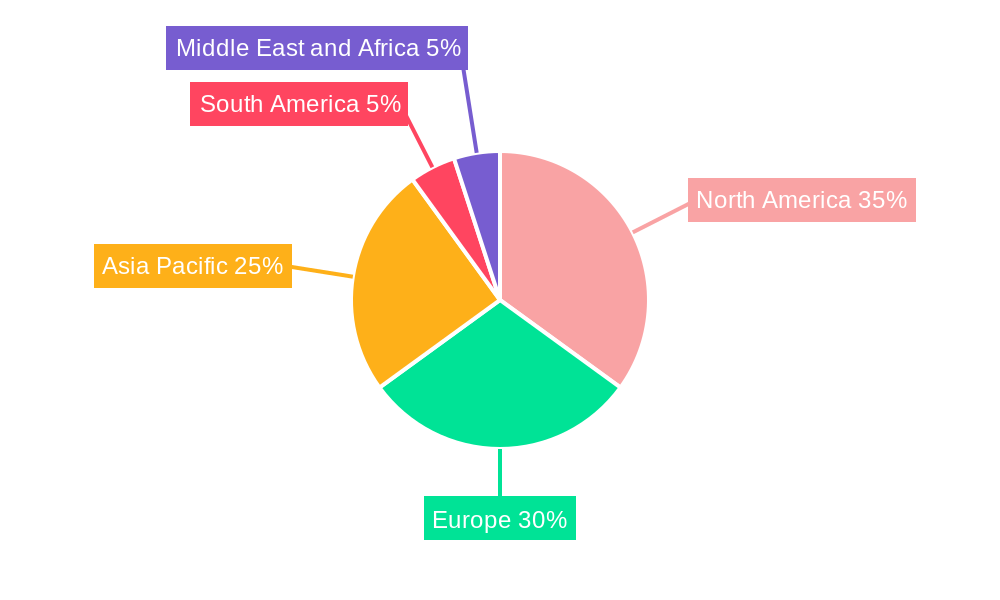
The global Pantograph Bus Charger market is experiencing robust growth, projected to reach \$2.78 billion in 2025 and exhibiting a remarkable Compound Annual Growth Rate (CAGR) of 24.65% from 2025 to 2033. This expansion is fueled by several key drivers. The increasing adoption of electric buses globally to mitigate environmental concerns and improve air quality is a primary catalyst. Governments worldwide are actively promoting electric public transportation through subsidies, incentives, and stringent emission regulations, further bolstering market demand. Technological advancements in pantograph systems, leading to improved efficiency, reliability, and faster charging times, are also contributing significantly. The market is segmented by component type (hardware and software), charging infrastructure type (off-board top-down and on-board bottom-up pantographs), and charging type (Level 2 and DC fast charging). The hardware segment currently dominates, but the software segment is expected to witness significant growth driven by the increasing demand for intelligent charging management systems. Geographically, North America and Europe are currently leading the market, owing to well-established electric bus infrastructure and supportive government policies. However, the Asia-Pacific region is poised for rapid expansion due to significant investments in electric bus fleets and expanding charging infrastructure in major economies like China and India. Competition within the market is intense, with key players including ABB Ltd, Valmont Industries Inc, Siemens Mobility, and others constantly innovating to enhance their product offerings and expand their market share. Challenges include high initial investment costs for infrastructure development and the need for robust grid infrastructure to support widespread electric bus adoption.
The market's future trajectory appears highly promising. The continued focus on sustainable transportation, coupled with technological progress and supportive government initiatives, will propel market growth. The development of advanced charging technologies, such as wireless charging and high-power charging systems, presents significant opportunities for innovation and market expansion. Furthermore, increasing collaborations between charging infrastructure providers, electric bus manufacturers, and government agencies will play a crucial role in driving market penetration. Specific regional growth will depend on the pace of electric bus adoption, government policies, and the availability of funding for infrastructure development in respective markets. The market will likely see increasing consolidation through mergers and acquisitions as companies strive to establish a stronger foothold and gain a competitive advantage.
This comprehensive report provides an in-depth analysis of the Pantograph Bus Charger Market, encompassing market dynamics, growth trends, regional segmentation, product landscape, key players, and future outlook. The study period spans from 2019 to 2033, with 2025 as the base and estimated year. The forecast period covers 2025-2033, while the historical period analyzed is 2019-2024. The report utilizes data from various sources to provide a holistic view of this rapidly evolving market within the broader Electric Vehicle Charging Infrastructure market.
Pantograph Bus Charger Market Market Dynamics & Structure
The Pantograph Bus Charger Market is characterized by a moderately concentrated landscape, with key players such as ABB Ltd, Valmont Industries Inc, Siemens Mobility, SCHUNK GmbH & Co KG, Comeca Group, Schunk Transit Systems GmBH, Wabtech Corporation, Vector Informatik GmbH, and SETEC Power vying for market share. Market concentration is expected to remain relatively stable in the forecast period, although strategic partnerships and acquisitions could reshape the competitive dynamics. Technological innovation, particularly in faster charging technologies and improved system reliability, is a key driver. Stringent environmental regulations promoting electric bus adoption are further accelerating market growth. The market faces competition from alternative charging technologies like inductive charging and plug-in charging. The end-user demographic is primarily public transport operators and municipalities, with a growing focus on optimizing charging infrastructure for efficient fleet management. M&A activity in the parent market of electric vehicle charging infrastructure is expected to remain robust, leading to potential consolidation within the pantograph bus charger segment.
- Market Concentration: Moderately concentrated, with top 10 players holding xx% market share in 2024.
- Technological Innovation: Focus on increasing charging speed, improving reliability, and reducing charging time.
- Regulatory Landscape: Stringent emission regulations are major drivers of electric bus adoption and subsequently pantograph chargers.
- Competitive Landscape: Competition from alternative charging technologies, particularly plug-in and inductive charging.
- M&A Activity: xx major M&A deals in the broader EV charging infrastructure market in 2024, with a projected increase to xx deals annually by 2033.
Pantograph Bus Charger Market Growth Trends & Insights
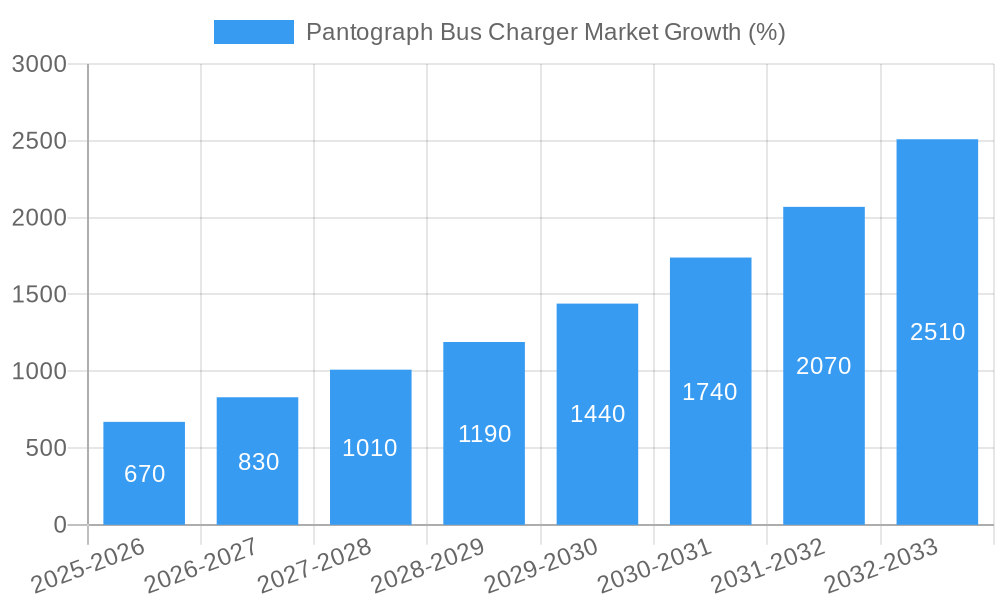
The global Pantograph Bus Charger Market is experiencing significant growth, driven by the increasing adoption of electric buses in urban transportation systems worldwide. The market size, valued at xx Million units in 2024, is projected to reach xx Million units by 2033, exhibiting a CAGR of xx% during the forecast period. This growth is fueled by the escalating demand for sustainable transportation solutions, coupled with government initiatives promoting the electrification of public transport. Technological advancements, such as higher-power charging capabilities and improved energy efficiency, are further accelerating market expansion. Consumer behavior shifts, particularly among urban dwellers, toward environmentally friendly transportation options, also contribute significantly. Market penetration is gradually increasing, with a projected xx% penetration rate by 2033 in major metropolitan areas globally. Disruptions from innovative charging technologies, such as wireless charging and fast-charging solutions, are anticipated to redefine market dynamics in the coming years.
Dominant Regions, Countries, or Segments in Pantograph Bus Charger Market
Europe, particularly countries like Germany, the UK, and France, currently dominates the Pantograph Bus Charger Market due to strong government support for electric bus adoption and well-established public transportation networks. North America and Asia-Pacific are also witnessing substantial growth, with significant investments in electric bus infrastructure.
By Pcomponent Type:
- Hardware: Holds the largest market share (xx%), driven by the need for robust and reliable charging equipment.
- Software: Growing at a faster rate (xx% CAGR) due to the increasing demand for smart charging management systems.
By Charging Infrastructure Type:
- Off-board top-down pantograph: Dominates the market with xx% market share due to its established use and suitability for depot charging.
- On-Board Bottom-Up Pantograph: Represents a smaller but growing segment (xx% market share) with potential for opportunity charging applications.
By Charging Type:
- Direct Current Fast Charging: The fastest-growing segment (xx% CAGR), due to its ability to reduce charging times significantly.
- Level 2 Charging: Maintains a significant market share (xx%), catering to overnight charging needs.
Key Drivers:
- Strong government support and subsidies for electric bus adoption.
- Increasing environmental concerns and the push for sustainable transportation.
- Expanding public transportation networks in urban areas.
- Advancements in battery technology and charging infrastructure.
Pantograph Bus Charger Market Product Landscape
The Pantograph Bus Charger market offers a range of products with varying charging capacities, power outputs, and design features. Innovations focus on enhancing charging speeds, improving energy efficiency, and ensuring safe and reliable operation. Key features include advanced safety mechanisms, remote monitoring capabilities, and intelligent charging management systems. Unique selling propositions often center around faster charging times, reduced operational costs, and enhanced system reliability. Technological advancements in power electronics and control systems continue to drive improvements in charging efficiency and performance.
Key Drivers, Barriers & Challenges in Pantograph Bus Charger Market
Key Drivers:
- Government Regulations: Stringent emission standards and incentives for electric bus adoption are major catalysts.
- Technological Advancements: Improvements in charging speed and efficiency are driving market growth.
- Urbanization and Public Transportation Expansion: Increasing urbanization fuels demand for efficient public transport solutions.
Key Barriers and Challenges:
- High Initial Investment Costs: The cost of deploying pantograph charging infrastructure remains a barrier for some operators.
- Interoperability Issues: Lack of standardization can hinder the seamless integration of different systems.
- Supply Chain Disruptions: Global supply chain challenges impact the availability of key components.
- Infrastructure Limitations: Existing infrastructure may require significant upgrades to accommodate pantograph systems.
Emerging Opportunities in Pantograph Bus Charger Market
- Wireless Charging Technologies: Development of efficient wireless charging systems holds significant promise.
- Smart Charging Management Systems: Integration of AI and IoT technologies for optimized energy management.
- Expansion into Developing Markets: Significant growth potential exists in emerging economies with expanding public transport systems.
- Opportunity Charging: Development of systems that allow rapid charging at bus stops along routes.
Growth Accelerators in the Pantograph Bus Charger Market Industry
Technological advancements in power electronics and battery technology are key growth drivers. Strategic partnerships between charging infrastructure providers and bus manufacturers are streamlining the integration of pantograph systems into electric bus fleets. Expanding government incentives and supportive policies are accelerating market penetration. Furthermore, increasing focus on operational efficiency and reducing charging times is boosting demand.
Key Players Shaping the Pantograph Bus Charger Market Market
- ABB Ltd
- Valmont Industries Inc
- Siemens Mobility
- SCHUNK GmbH & Co KG
- Comeca Group
- Schunk Transit Systems GmBH
- Wabtech Corporation
- Vector Informatik GmbH
- SETEC Power
Notable Milestones in Pantograph Bus Charger Market Sector
- August 2022: First Bus orders 193 electric buses with 150 kW DC and optional 450 kW pantograph charging.
- May 2022: San Diego Metropolitan Transit System installs Schunk SLS 301 pantograph chargers.
- April 2022: Transports Metropolitans de Barcelona tenders for up to 83 electric buses with pantograph charging.
- April 2022: Miejski Zakład Komunikacji in Grudziądz orders 17 electric buses with pantograph chargers.
- November 2021: Moscow launches a pilot project with a bus-down pantograph charging station.
In-Depth Pantograph Bus Charger Market Market Outlook
The Pantograph Bus Charger Market is poised for continued strong growth, driven by the global shift toward electric mobility and the expanding adoption of electric buses. Opportunities exist in developing smart charging solutions, expanding into new markets, and leveraging strategic partnerships to enhance market penetration. Focus on technological innovation, particularly in fast-charging and energy-efficient systems, will be crucial for maintaining a competitive edge. The market presents significant potential for both established players and new entrants to capitalize on the growing demand for sustainable public transportation.
Pantograph Bus Charger Market Segmentation
-
1. Charging Type
- 1.1. Level 1
- 1.2. Level 2
- 1.3. Direct Current Fast Charging
-
2. Pcomponent Type
- 2.1. Hardware
- 2.2. Software
-
3. Charging Infrastructure Type
- 3.1. Off-board top-down pantograph
- 3.2. On-Board Bottom-Up Pantograph
Pantograph Bus Charger Market Segmentation By Geography
-
1. North America
- 1.1. United States
- 1.2. Canada
- 1.3. Rest of North America
-
2. Europe
- 2.1. Germany
- 2.2. United Kingdom
- 2.3. France
- 2.4. Italy
- 2.5. Spain
- 2.6. Rest of Europe
-
3. Asia Pacific
- 3.1. India
- 3.2. China
- 3.3. South Korea
- 3.4. Japan
- 3.5. Rest of Asia Pacific
-
4. South America
- 4.1. Brazil
- 4.2. Aegentina
- 4.3. Rest of the South America
-
5. Middle East and Africa
- 5.1. Saudi Arabia
- 5.2. South Africa
- 5.3. Rest of the Middle East and Africa
Pantograph Bus Charger Market REPORT HIGHLIGHTS
| Aspects | Details |
|---|---|
| Study Period | 2019-2033 |
| Base Year | 2024 |
| Estimated Year | 2025 |
| Forecast Period | 2025-2033 |
| Historical Period | 2019-2024 |
| Growth Rate | CAGR of 24.65% from 2019-2033 |
| Segmentation |
|
Table of Contents
- 1. Introduction
- 1.1. Research Scope
- 1.2. Market Segmentation
- 1.3. Research Methodology
- 1.4. Definitions and Assumptions
- 2. Executive Summary
- 2.1. Introduction
- 3. Market Dynamics
- 3.1. Introduction
- 3.2. Market Drivers
- 3.2.1. Rise in Vehicle Sale
- 3.3. Market Restrains
- 3.3.1. Increase in demand for Electric Vehicles
- 3.4. Market Trends
- 3.4.1. Rising Emphasis of Government on Eco-Friendly Buses
- 4. Market Factor Analysis
- 4.1. Porters Five Forces
- 4.2. Supply/Value Chain
- 4.3. PESTEL analysis
- 4.4. Market Entropy
- 4.5. Patent/Trademark Analysis
- 5. Global Pantograph Bus Charger Market Analysis, Insights and Forecast, 2019-2031
- 5.1. Market Analysis, Insights and Forecast - by Charging Type
- 5.1.1. Level 1
- 5.1.2. Level 2
- 5.1.3. Direct Current Fast Charging
- 5.2. Market Analysis, Insights and Forecast - by Pcomponent Type
- 5.2.1. Hardware
- 5.2.2. Software
- 5.3. Market Analysis, Insights and Forecast - by Charging Infrastructure Type
- 5.3.1. Off-board top-down pantograph
- 5.3.2. On-Board Bottom-Up Pantograph
- 5.4. Market Analysis, Insights and Forecast - by Region
- 5.4.1. North America
- 5.4.2. Europe
- 5.4.3. Asia Pacific
- 5.4.4. South America
- 5.4.5. Middle East and Africa
- 5.1. Market Analysis, Insights and Forecast - by Charging Type
- 6. North America Pantograph Bus Charger Market Analysis, Insights and Forecast, 2019-2031
- 6.1. Market Analysis, Insights and Forecast - by Charging Type
- 6.1.1. Level 1
- 6.1.2. Level 2
- 6.1.3. Direct Current Fast Charging
- 6.2. Market Analysis, Insights and Forecast - by Pcomponent Type
- 6.2.1. Hardware
- 6.2.2. Software
- 6.3. Market Analysis, Insights and Forecast - by Charging Infrastructure Type
- 6.3.1. Off-board top-down pantograph
- 6.3.2. On-Board Bottom-Up Pantograph
- 6.1. Market Analysis, Insights and Forecast - by Charging Type
- 7. Europe Pantograph Bus Charger Market Analysis, Insights and Forecast, 2019-2031
- 7.1. Market Analysis, Insights and Forecast - by Charging Type
- 7.1.1. Level 1
- 7.1.2. Level 2
- 7.1.3. Direct Current Fast Charging
- 7.2. Market Analysis, Insights and Forecast - by Pcomponent Type
- 7.2.1. Hardware
- 7.2.2. Software
- 7.3. Market Analysis, Insights and Forecast - by Charging Infrastructure Type
- 7.3.1. Off-board top-down pantograph
- 7.3.2. On-Board Bottom-Up Pantograph
- 7.1. Market Analysis, Insights and Forecast - by Charging Type
- 8. Asia Pacific Pantograph Bus Charger Market Analysis, Insights and Forecast, 2019-2031
- 8.1. Market Analysis, Insights and Forecast - by Charging Type
- 8.1.1. Level 1
- 8.1.2. Level 2
- 8.1.3. Direct Current Fast Charging
- 8.2. Market Analysis, Insights and Forecast - by Pcomponent Type
- 8.2.1. Hardware
- 8.2.2. Software
- 8.3. Market Analysis, Insights and Forecast - by Charging Infrastructure Type
- 8.3.1. Off-board top-down pantograph
- 8.3.2. On-Board Bottom-Up Pantograph
- 8.1. Market Analysis, Insights and Forecast - by Charging Type
- 9. South America Pantograph Bus Charger Market Analysis, Insights and Forecast, 2019-2031
- 9.1. Market Analysis, Insights and Forecast - by Charging Type
- 9.1.1. Level 1
- 9.1.2. Level 2
- 9.1.3. Direct Current Fast Charging
- 9.2. Market Analysis, Insights and Forecast - by Pcomponent Type
- 9.2.1. Hardware
- 9.2.2. Software
- 9.3. Market Analysis, Insights and Forecast - by Charging Infrastructure Type
- 9.3.1. Off-board top-down pantograph
- 9.3.2. On-Board Bottom-Up Pantograph
- 9.1. Market Analysis, Insights and Forecast - by Charging Type
- 10. Middle East and Africa Pantograph Bus Charger Market Analysis, Insights and Forecast, 2019-2031
- 10.1. Market Analysis, Insights and Forecast - by Charging Type
- 10.1.1. Level 1
- 10.1.2. Level 2
- 10.1.3. Direct Current Fast Charging
- 10.2. Market Analysis, Insights and Forecast - by Pcomponent Type
- 10.2.1. Hardware
- 10.2.2. Software
- 10.3. Market Analysis, Insights and Forecast - by Charging Infrastructure Type
- 10.3.1. Off-board top-down pantograph
- 10.3.2. On-Board Bottom-Up Pantograph
- 10.1. Market Analysis, Insights and Forecast - by Charging Type
- 11. North America Pantograph Bus Charger Market Analysis, Insights and Forecast, 2019-2031
- 11.1. Market Analysis, Insights and Forecast - By Country/Sub-region
- 11.1.1 United States
- 11.1.2 Canada
- 11.1.3 Rest of North America
- 12. Europe Pantograph Bus Charger Market Analysis, Insights and Forecast, 2019-2031
- 12.1. Market Analysis, Insights and Forecast - By Country/Sub-region
- 12.1.1 Germany
- 12.1.2 United Kingdom
- 12.1.3 France
- 12.1.4 Italy
- 12.1.5 Spain
- 12.1.6 Rest of Europe
- 13. Asia Pacific Pantograph Bus Charger Market Analysis, Insights and Forecast, 2019-2031
- 13.1. Market Analysis, Insights and Forecast - By Country/Sub-region
- 13.1.1 India
- 13.1.2 China
- 13.1.3 South Korea
- 13.1.4 Japan
- 13.1.5 Rest of Asia Pacific
- 14. South America Pantograph Bus Charger Market Analysis, Insights and Forecast, 2019-2031
- 14.1. Market Analysis, Insights and Forecast - By Country/Sub-region
- 14.1.1 Brazil
- 14.1.2 Aegentina
- 14.1.3 Rest of the South America
- 15. Middle East and Africa Pantograph Bus Charger Market Analysis, Insights and Forecast, 2019-2031
- 15.1. Market Analysis, Insights and Forecast - By Country/Sub-region
- 15.1.1 Saudi Arabia
- 15.1.2 South Africa
- 15.1.3 Rest of the Middle East and Africa
- 16. Competitive Analysis
- 16.1. Global Market Share Analysis 2024
- 16.2. Company Profiles
- 16.2.1 ABB Ltd
- 16.2.1.1. Overview
- 16.2.1.2. Products
- 16.2.1.3. SWOT Analysis
- 16.2.1.4. Recent Developments
- 16.2.1.5. Financials (Based on Availability)
- 16.2.2 Valmont Industries Inc
- 16.2.2.1. Overview
- 16.2.2.2. Products
- 16.2.2.3. SWOT Analysis
- 16.2.2.4. Recent Developments
- 16.2.2.5. Financials (Based on Availability)
- 16.2.3 Siemens Mobility
- 16.2.3.1. Overview
- 16.2.3.2. Products
- 16.2.3.3. SWOT Analysis
- 16.2.3.4. Recent Developments
- 16.2.3.5. Financials (Based on Availability)
- 16.2.4 SCHUNK GmbH & Co KG
- 16.2.4.1. Overview
- 16.2.4.2. Products
- 16.2.4.3. SWOT Analysis
- 16.2.4.4. Recent Developments
- 16.2.4.5. Financials (Based on Availability)
- 16.2.5 Comeca Grou
- 16.2.5.1. Overview
- 16.2.5.2. Products
- 16.2.5.3. SWOT Analysis
- 16.2.5.4. Recent Developments
- 16.2.5.5. Financials (Based on Availability)
- 16.2.6 Schunk Transit Systems GmBH
- 16.2.6.1. Overview
- 16.2.6.2. Products
- 16.2.6.3. SWOT Analysis
- 16.2.6.4. Recent Developments
- 16.2.6.5. Financials (Based on Availability)
- 16.2.7 Wabtech Corporation
- 16.2.7.1. Overview
- 16.2.7.2. Products
- 16.2.7.3. SWOT Analysis
- 16.2.7.4. Recent Developments
- 16.2.7.5. Financials (Based on Availability)
- 16.2.8 Vector Informatik GmbH
- 16.2.8.1. Overview
- 16.2.8.2. Products
- 16.2.8.3. SWOT Analysis
- 16.2.8.4. Recent Developments
- 16.2.8.5. Financials (Based on Availability)
- 16.2.9 SETEC Power
- 16.2.9.1. Overview
- 16.2.9.2. Products
- 16.2.9.3. SWOT Analysis
- 16.2.9.4. Recent Developments
- 16.2.9.5. Financials (Based on Availability)
- 16.2.1 ABB Ltd
List of Figures
- Figure 1: Global Pantograph Bus Charger Market Revenue Breakdown (Million, %) by Region 2024 & 2032
- Figure 2: North America Pantograph Bus Charger Market Revenue (Million), by Country 2024 & 2032
- Figure 3: North America Pantograph Bus Charger Market Revenue Share (%), by Country 2024 & 2032
- Figure 4: Europe Pantograph Bus Charger Market Revenue (Million), by Country 2024 & 2032
- Figure 5: Europe Pantograph Bus Charger Market Revenue Share (%), by Country 2024 & 2032
- Figure 6: Asia Pacific Pantograph Bus Charger Market Revenue (Million), by Country 2024 & 2032
- Figure 7: Asia Pacific Pantograph Bus Charger Market Revenue Share (%), by Country 2024 & 2032
- Figure 8: South America Pantograph Bus Charger Market Revenue (Million), by Country 2024 & 2032
- Figure 9: South America Pantograph Bus Charger Market Revenue Share (%), by Country 2024 & 2032
- Figure 10: Middle East and Africa Pantograph Bus Charger Market Revenue (Million), by Country 2024 & 2032
- Figure 11: Middle East and Africa Pantograph Bus Charger Market Revenue Share (%), by Country 2024 & 2032
- Figure 12: North America Pantograph Bus Charger Market Revenue (Million), by Charging Type 2024 & 2032
- Figure 13: North America Pantograph Bus Charger Market Revenue Share (%), by Charging Type 2024 & 2032
- Figure 14: North America Pantograph Bus Charger Market Revenue (Million), by Pcomponent Type 2024 & 2032
- Figure 15: North America Pantograph Bus Charger Market Revenue Share (%), by Pcomponent Type 2024 & 2032
- Figure 16: North America Pantograph Bus Charger Market Revenue (Million), by Charging Infrastructure Type 2024 & 2032
- Figure 17: North America Pantograph Bus Charger Market Revenue Share (%), by Charging Infrastructure Type 2024 & 2032
- Figure 18: North America Pantograph Bus Charger Market Revenue (Million), by Country 2024 & 2032
- Figure 19: North America Pantograph Bus Charger Market Revenue Share (%), by Country 2024 & 2032
- Figure 20: Europe Pantograph Bus Charger Market Revenue (Million), by Charging Type 2024 & 2032
- Figure 21: Europe Pantograph Bus Charger Market Revenue Share (%), by Charging Type 2024 & 2032
- Figure 22: Europe Pantograph Bus Charger Market Revenue (Million), by Pcomponent Type 2024 & 2032
- Figure 23: Europe Pantograph Bus Charger Market Revenue Share (%), by Pcomponent Type 2024 & 2032
- Figure 24: Europe Pantograph Bus Charger Market Revenue (Million), by Charging Infrastructure Type 2024 & 2032
- Figure 25: Europe Pantograph Bus Charger Market Revenue Share (%), by Charging Infrastructure Type 2024 & 2032
- Figure 26: Europe Pantograph Bus Charger Market Revenue (Million), by Country 2024 & 2032
- Figure 27: Europe Pantograph Bus Charger Market Revenue Share (%), by Country 2024 & 2032
- Figure 28: Asia Pacific Pantograph Bus Charger Market Revenue (Million), by Charging Type 2024 & 2032
- Figure 29: Asia Pacific Pantograph Bus Charger Market Revenue Share (%), by Charging Type 2024 & 2032
- Figure 30: Asia Pacific Pantograph Bus Charger Market Revenue (Million), by Pcomponent Type 2024 & 2032
- Figure 31: Asia Pacific Pantograph Bus Charger Market Revenue Share (%), by Pcomponent Type 2024 & 2032
- Figure 32: Asia Pacific Pantograph Bus Charger Market Revenue (Million), by Charging Infrastructure Type 2024 & 2032
- Figure 33: Asia Pacific Pantograph Bus Charger Market Revenue Share (%), by Charging Infrastructure Type 2024 & 2032
- Figure 34: Asia Pacific Pantograph Bus Charger Market Revenue (Million), by Country 2024 & 2032
- Figure 35: Asia Pacific Pantograph Bus Charger Market Revenue Share (%), by Country 2024 & 2032
- Figure 36: South America Pantograph Bus Charger Market Revenue (Million), by Charging Type 2024 & 2032
- Figure 37: South America Pantograph Bus Charger Market Revenue Share (%), by Charging Type 2024 & 2032
- Figure 38: South America Pantograph Bus Charger Market Revenue (Million), by Pcomponent Type 2024 & 2032
- Figure 39: South America Pantograph Bus Charger Market Revenue Share (%), by Pcomponent Type 2024 & 2032
- Figure 40: South America Pantograph Bus Charger Market Revenue (Million), by Charging Infrastructure Type 2024 & 2032
- Figure 41: South America Pantograph Bus Charger Market Revenue Share (%), by Charging Infrastructure Type 2024 & 2032
- Figure 42: South America Pantograph Bus Charger Market Revenue (Million), by Country 2024 & 2032
- Figure 43: South America Pantograph Bus Charger Market Revenue Share (%), by Country 2024 & 2032
- Figure 44: Middle East and Africa Pantograph Bus Charger Market Revenue (Million), by Charging Type 2024 & 2032
- Figure 45: Middle East and Africa Pantograph Bus Charger Market Revenue Share (%), by Charging Type 2024 & 2032
- Figure 46: Middle East and Africa Pantograph Bus Charger Market Revenue (Million), by Pcomponent Type 2024 & 2032
- Figure 47: Middle East and Africa Pantograph Bus Charger Market Revenue Share (%), by Pcomponent Type 2024 & 2032
- Figure 48: Middle East and Africa Pantograph Bus Charger Market Revenue (Million), by Charging Infrastructure Type 2024 & 2032
- Figure 49: Middle East and Africa Pantograph Bus Charger Market Revenue Share (%), by Charging Infrastructure Type 2024 & 2032
- Figure 50: Middle East and Africa Pantograph Bus Charger Market Revenue (Million), by Country 2024 & 2032
- Figure 51: Middle East and Africa Pantograph Bus Charger Market Revenue Share (%), by Country 2024 & 2032
List of Tables
- Table 1: Global Pantograph Bus Charger Market Revenue Million Forecast, by Region 2019 & 2032
- Table 2: Global Pantograph Bus Charger Market Revenue Million Forecast, by Charging Type 2019 & 2032
- Table 3: Global Pantograph Bus Charger Market Revenue Million Forecast, by Pcomponent Type 2019 & 2032
- Table 4: Global Pantograph Bus Charger Market Revenue Million Forecast, by Charging Infrastructure Type 2019 & 2032
- Table 5: Global Pantograph Bus Charger Market Revenue Million Forecast, by Region 2019 & 2032
- Table 6: Global Pantograph Bus Charger Market Revenue Million Forecast, by Country 2019 & 2032
- Table 7: United States Pantograph Bus Charger Market Revenue (Million) Forecast, by Application 2019 & 2032
- Table 8: Canada Pantograph Bus Charger Market Revenue (Million) Forecast, by Application 2019 & 2032
- Table 9: Rest of North America Pantograph Bus Charger Market Revenue (Million) Forecast, by Application 2019 & 2032
- Table 10: Global Pantograph Bus Charger Market Revenue Million Forecast, by Country 2019 & 2032
- Table 11: Germany Pantograph Bus Charger Market Revenue (Million) Forecast, by Application 2019 & 2032
- Table 12: United Kingdom Pantograph Bus Charger Market Revenue (Million) Forecast, by Application 2019 & 2032
- Table 13: France Pantograph Bus Charger Market Revenue (Million) Forecast, by Application 2019 & 2032
- Table 14: Italy Pantograph Bus Charger Market Revenue (Million) Forecast, by Application 2019 & 2032
- Table 15: Spain Pantograph Bus Charger Market Revenue (Million) Forecast, by Application 2019 & 2032
- Table 16: Rest of Europe Pantograph Bus Charger Market Revenue (Million) Forecast, by Application 2019 & 2032
- Table 17: Global Pantograph Bus Charger Market Revenue Million Forecast, by Country 2019 & 2032
- Table 18: India Pantograph Bus Charger Market Revenue (Million) Forecast, by Application 2019 & 2032
- Table 19: China Pantograph Bus Charger Market Revenue (Million) Forecast, by Application 2019 & 2032
- Table 20: South Korea Pantograph Bus Charger Market Revenue (Million) Forecast, by Application 2019 & 2032
- Table 21: Japan Pantograph Bus Charger Market Revenue (Million) Forecast, by Application 2019 & 2032
- Table 22: Rest of Asia Pacific Pantograph Bus Charger Market Revenue (Million) Forecast, by Application 2019 & 2032
- Table 23: Global Pantograph Bus Charger Market Revenue Million Forecast, by Country 2019 & 2032
- Table 24: Brazil Pantograph Bus Charger Market Revenue (Million) Forecast, by Application 2019 & 2032
- Table 25: Aegentina Pantograph Bus Charger Market Revenue (Million) Forecast, by Application 2019 & 2032
- Table 26: Rest of the South America Pantograph Bus Charger Market Revenue (Million) Forecast, by Application 2019 & 2032
- Table 27: Global Pantograph Bus Charger Market Revenue Million Forecast, by Country 2019 & 2032
- Table 28: Saudi Arabia Pantograph Bus Charger Market Revenue (Million) Forecast, by Application 2019 & 2032
- Table 29: South Africa Pantograph Bus Charger Market Revenue (Million) Forecast, by Application 2019 & 2032
- Table 30: Rest of the Middle East and Africa Pantograph Bus Charger Market Revenue (Million) Forecast, by Application 2019 & 2032
- Table 31: Global Pantograph Bus Charger Market Revenue Million Forecast, by Charging Type 2019 & 2032
- Table 32: Global Pantograph Bus Charger Market Revenue Million Forecast, by Pcomponent Type 2019 & 2032
- Table 33: Global Pantograph Bus Charger Market Revenue Million Forecast, by Charging Infrastructure Type 2019 & 2032
- Table 34: Global Pantograph Bus Charger Market Revenue Million Forecast, by Country 2019 & 2032
- Table 35: United States Pantograph Bus Charger Market Revenue (Million) Forecast, by Application 2019 & 2032
- Table 36: Canada Pantograph Bus Charger Market Revenue (Million) Forecast, by Application 2019 & 2032
- Table 37: Rest of North America Pantograph Bus Charger Market Revenue (Million) Forecast, by Application 2019 & 2032
- Table 38: Global Pantograph Bus Charger Market Revenue Million Forecast, by Charging Type 2019 & 2032
- Table 39: Global Pantograph Bus Charger Market Revenue Million Forecast, by Pcomponent Type 2019 & 2032
- Table 40: Global Pantograph Bus Charger Market Revenue Million Forecast, by Charging Infrastructure Type 2019 & 2032
- Table 41: Global Pantograph Bus Charger Market Revenue Million Forecast, by Country 2019 & 2032
- Table 42: Germany Pantograph Bus Charger Market Revenue (Million) Forecast, by Application 2019 & 2032
- Table 43: United Kingdom Pantograph Bus Charger Market Revenue (Million) Forecast, by Application 2019 & 2032
- Table 44: France Pantograph Bus Charger Market Revenue (Million) Forecast, by Application 2019 & 2032
- Table 45: Italy Pantograph Bus Charger Market Revenue (Million) Forecast, by Application 2019 & 2032
- Table 46: Spain Pantograph Bus Charger Market Revenue (Million) Forecast, by Application 2019 & 2032
- Table 47: Rest of Europe Pantograph Bus Charger Market Revenue (Million) Forecast, by Application 2019 & 2032
- Table 48: Global Pantograph Bus Charger Market Revenue Million Forecast, by Charging Type 2019 & 2032
- Table 49: Global Pantograph Bus Charger Market Revenue Million Forecast, by Pcomponent Type 2019 & 2032
- Table 50: Global Pantograph Bus Charger Market Revenue Million Forecast, by Charging Infrastructure Type 2019 & 2032
- Table 51: Global Pantograph Bus Charger Market Revenue Million Forecast, by Country 2019 & 2032
- Table 52: India Pantograph Bus Charger Market Revenue (Million) Forecast, by Application 2019 & 2032
- Table 53: China Pantograph Bus Charger Market Revenue (Million) Forecast, by Application 2019 & 2032
- Table 54: South Korea Pantograph Bus Charger Market Revenue (Million) Forecast, by Application 2019 & 2032
- Table 55: Japan Pantograph Bus Charger Market Revenue (Million) Forecast, by Application 2019 & 2032
- Table 56: Rest of Asia Pacific Pantograph Bus Charger Market Revenue (Million) Forecast, by Application 2019 & 2032
- Table 57: Global Pantograph Bus Charger Market Revenue Million Forecast, by Charging Type 2019 & 2032
- Table 58: Global Pantograph Bus Charger Market Revenue Million Forecast, by Pcomponent Type 2019 & 2032
- Table 59: Global Pantograph Bus Charger Market Revenue Million Forecast, by Charging Infrastructure Type 2019 & 2032
- Table 60: Global Pantograph Bus Charger Market Revenue Million Forecast, by Country 2019 & 2032
- Table 61: Brazil Pantograph Bus Charger Market Revenue (Million) Forecast, by Application 2019 & 2032
- Table 62: Aegentina Pantograph Bus Charger Market Revenue (Million) Forecast, by Application 2019 & 2032
- Table 63: Rest of the South America Pantograph Bus Charger Market Revenue (Million) Forecast, by Application 2019 & 2032
- Table 64: Global Pantograph Bus Charger Market Revenue Million Forecast, by Charging Type 2019 & 2032
- Table 65: Global Pantograph Bus Charger Market Revenue Million Forecast, by Pcomponent Type 2019 & 2032
- Table 66: Global Pantograph Bus Charger Market Revenue Million Forecast, by Charging Infrastructure Type 2019 & 2032
- Table 67: Global Pantograph Bus Charger Market Revenue Million Forecast, by Country 2019 & 2032
- Table 68: Saudi Arabia Pantograph Bus Charger Market Revenue (Million) Forecast, by Application 2019 & 2032
- Table 69: South Africa Pantograph Bus Charger Market Revenue (Million) Forecast, by Application 2019 & 2032
- Table 70: Rest of the Middle East and Africa Pantograph Bus Charger Market Revenue (Million) Forecast, by Application 2019 & 2032
Frequently Asked Questions
1. What is the projected Compound Annual Growth Rate (CAGR) of the Pantograph Bus Charger Market?
The projected CAGR is approximately 24.65%.
2. Which companies are prominent players in the Pantograph Bus Charger Market?
Key companies in the market include ABB Ltd, Valmont Industries Inc, Siemens Mobility, SCHUNK GmbH & Co KG, Comeca Grou, Schunk Transit Systems GmBH, Wabtech Corporation, Vector Informatik GmbH, SETEC Power.
3. What are the main segments of the Pantograph Bus Charger Market?
The market segments include Charging Type, Pcomponent Type, Charging Infrastructure Type.
4. Can you provide details about the market size?
The market size is estimated to be USD 2.78 Million as of 2022.
5. What are some drivers contributing to market growth?
Rise in Vehicle Sale.
6. What are the notable trends driving market growth?
Rising Emphasis of Government on Eco-Friendly Buses.
7. Are there any restraints impacting market growth?
Increase in demand for Electric Vehicles.
8. Can you provide examples of recent developments in the market?
August 2022: British bus company First Bus ordered 193 electric buses worth GBP 81 million (~USD 96.4 million) from Northern Irish bus manufacturer Wrightbus. Furthermore, the company initially specifies the DC charging power at 150 kW and optional opportunity charging at 450 kW through pantograph options.
9. What pricing options are available for accessing the report?
Pricing options include single-user, multi-user, and enterprise licenses priced at USD 4750, USD 5250, and USD 8750 respectively.
10. Is the market size provided in terms of value or volume?
The market size is provided in terms of value, measured in Million.
11. Are there any specific market keywords associated with the report?
Yes, the market keyword associated with the report is "Pantograph Bus Charger Market," which aids in identifying and referencing the specific market segment covered.
12. How do I determine which pricing option suits my needs best?
The pricing options vary based on user requirements and access needs. Individual users may opt for single-user licenses, while businesses requiring broader access may choose multi-user or enterprise licenses for cost-effective access to the report.
13. Are there any additional resources or data provided in the Pantograph Bus Charger Market report?
While the report offers comprehensive insights, it's advisable to review the specific contents or supplementary materials provided to ascertain if additional resources or data are available.
14. How can I stay updated on further developments or reports in the Pantograph Bus Charger Market?
To stay informed about further developments, trends, and reports in the Pantograph Bus Charger Market, consider subscribing to industry newsletters, following relevant companies and organizations, or regularly checking reputable industry news sources and publications.
Methodology
Step 1 - Identification of Relevant Samples Size from Population Database


Step 2 - Approaches for Defining Global Market Size (Value, Volume* & Price*)

Note*: In applicable scenarios
Step 3 - Data Sources
Primary Research
- Web Analytics
- Survey Reports
- Research Institute
- Latest Research Reports
- Opinion Leaders
Secondary Research
- Annual Reports
- White Paper
- Latest Press Release
- Industry Association
- Paid Database
- Investor Presentations

Step 4 - Data Triangulation
Involves using different sources of information in order to increase the validity of a study
These sources are likely to be stakeholders in a program - participants, other researchers, program staff, other community members, and so on.
Then we put all data in single framework & apply various statistical tools to find out the dynamic on the market.
During the analysis stage, feedback from the stakeholder groups would be compared to determine areas of agreement as well as areas of divergence


