

Key Insights
The global outdoor bridge market is poised for significant expansion, fueled by the escalating demand for dependable, long-range wireless connectivity across diverse industries. Key growth drivers include the advancement of smart city projects, the widespread adoption of IoT devices, and the critical need for resilient network infrastructure in remote and underserved areas. The market is segmented by technology (point-to-point, point-to-multipoint), frequency bands, and applications such as surveillance, industrial automation, and telecommunications. Leading manufacturers are strategically innovating and forming alliances to bolster their market presence.
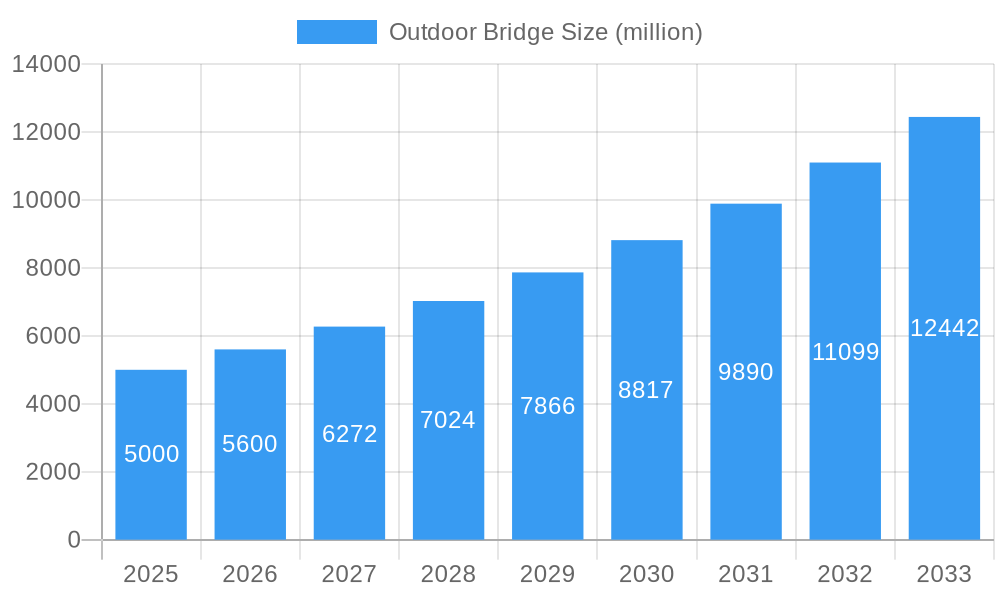
Outdoor Bridge Market Size (In Billion)
Despite challenges like regulatory complexities and deployment costs, particularly in challenging terrains, the long-term market trajectory is strongly positive. Continuous advancements in wireless technologies and the increasing demand for higher bandwidth solutions are key contributors. The market is projected to reach a size of $15.31 billion by 2025, with an estimated Compound Annual Growth Rate (CAGR) of 7.3% from the base year 2025 through 2033. This growth will be further propelled by the ongoing rollout of 5G networks and the broader integration of private LTE solutions, offering enhanced bandwidth and reliability for outdoor bridge applications.
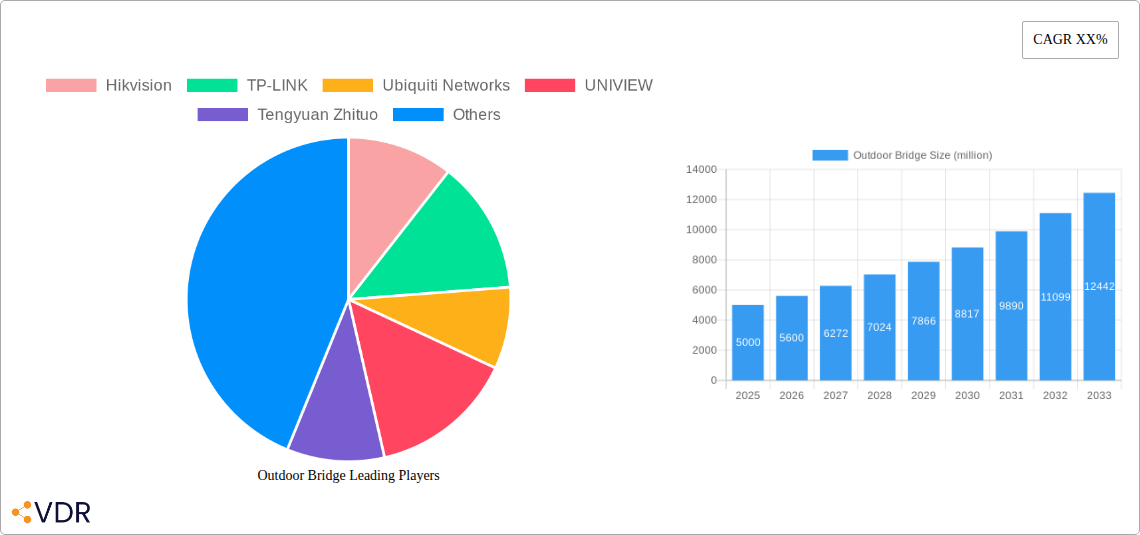
Outdoor Bridge Company Market Share
The competitive landscape is characterized by fragmentation, with numerous vendors offering a wide array of solutions. Companies are prioritizing product innovation, portfolio expansion, and strengthening distribution channels to achieve a competitive advantage. Mergers, acquisitions, and strategic partnerships are expected to significantly influence market dynamics. Geographic growth will be uneven, with regions undergoing rapid infrastructure development and urbanization anticipated to experience higher expansion rates. Emerging economies in Asia-Pacific and Latin America are particularly well-positioned for substantial growth, while mature markets in North America and Europe are expected to exhibit steady, moderate expansion. Emphasis on robust security features and cost-effective solutions will be paramount for market penetration.
Outdoor Bridge Market Report: 2019-2033
This comprehensive report provides an in-depth analysis of the global outdoor bridge market, covering the period 2019-2033. It meticulously examines market dynamics, growth trends, regional dominance, product landscapes, key players, and emerging opportunities, offering invaluable insights for industry professionals, investors, and strategic decision-makers. The report leverages extensive data analysis and expert insights to forecast market size and growth trajectory, enabling stakeholders to make informed decisions and capitalize on future growth potential. The parent market considered is the networking equipment market, while the child market is specifically outdoor wireless connectivity solutions.
Outdoor Bridge Market Dynamics & Structure
The global outdoor bridge market, valued at $XX million in 2025, exhibits a moderately concentrated landscape with key players such as Hikvision, TP-LINK, Ubiquiti Networks, and Huawei holding significant market share. Technological innovation, particularly in long-range wireless technologies and enhanced security features, is a primary growth driver. Stringent regulatory frameworks regarding network security and spectrum allocation influence market development. Competitive substitutes include wired connections and alternative wireless technologies. End-user demographics are diverse, including government agencies, businesses, and residential users in remote areas. M&A activity has been moderate, with xx deals recorded between 2019 and 2024, primarily focusing on strengthening technological capabilities and expanding geographical reach.
- Market Concentration: Moderately concentrated, with top 5 players holding approximately xx% market share in 2025.
- Technological Innovation: Focus on long-range Wi-Fi, 5G/LTE integration, and enhanced security protocols.
- Regulatory Framework: Compliance with network security standards and spectrum allocation regulations varies by region.
- Competitive Substitutes: Wired connections (fiber, copper), other wireless technologies (mesh networks, satellite).
- End-User Demographics: Government, enterprises, residential (rural/remote areas).
- M&A Activity: xx deals (2019-2024), primarily focused on technology acquisition and market expansion.
Outdoor Bridge Growth Trends & Insights
The outdoor bridge market experienced substantial growth during the historical period (2019-2024), driven by increasing demand for reliable wireless connectivity in remote and underserved areas. The market size grew from $xx million in 2019 to $xx million in 2024, exhibiting a CAGR of xx%. Technological advancements, such as the adoption of higher frequency bands and improved antenna designs, have significantly enhanced range and performance. Consumer behavior shifts, including a growing preference for remote work and increased reliance on IoT devices, have further fueled market expansion. The market is projected to maintain strong growth during the forecast period (2025-2033), reaching an estimated value of $xx million by 2033, with a projected CAGR of xx%. Market penetration is expected to increase significantly in developing economies.
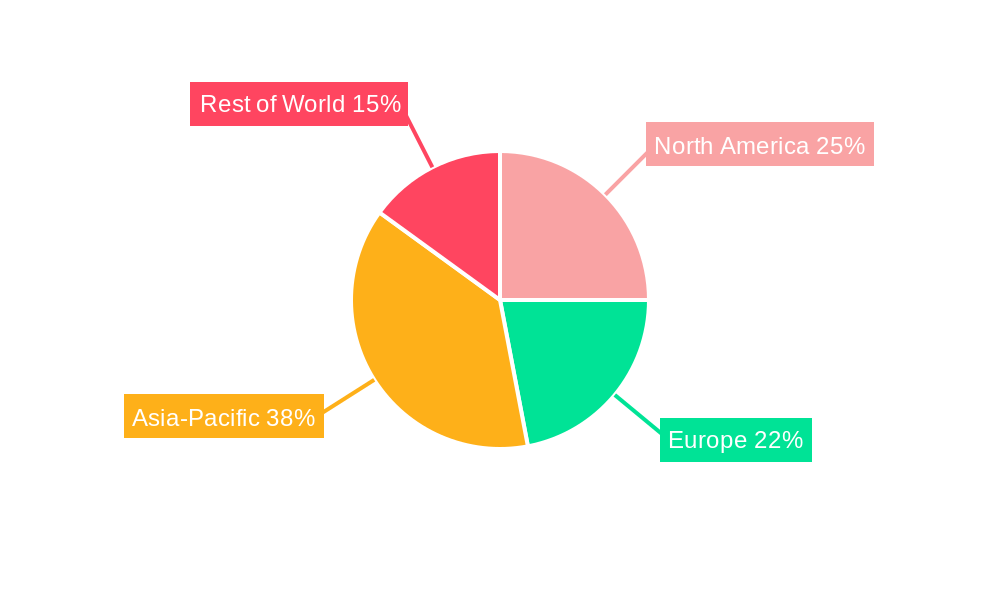
Dominant Regions, Countries, or Segments in Outdoor Bridge
North America currently dominates the outdoor bridge market, followed by Europe and Asia-Pacific. Strong infrastructure investments, coupled with advanced technological adoption rates, contribute to the region’s leadership. The growth in North America is fueled by increasing demand for robust network connectivity in rural areas and government initiatives to bridge the digital divide. Asia-Pacific demonstrates substantial growth potential driven by rapid urbanization, rising industrialization, and increasing government investments in expanding broadband infrastructure.
- Key Drivers in North America: Strong government funding for infrastructure projects, high demand for secure remote connectivity.
- Key Drivers in Asia-Pacific: Rapid urbanization, industrial expansion, increasing government investments in digital infrastructure.
- Market Share: North America (xx%), Europe (xx%), Asia-Pacific (xx%), Rest of World (xx%) in 2025.
- Growth Potential: Asia-Pacific projected to experience the highest growth rate during the forecast period.
Outdoor Bridge Product Landscape
Outdoor bridges encompass a range of products offering varying functionalities, such as long-range Wi-Fi, point-to-point wireless links, and Ethernet extensions. Key features include advanced security protocols, weatherproofing capabilities, and high throughput. Recent innovations include the integration of 5G/LTE technologies and improved power efficiency. Unique selling propositions vary based on specific features such as range, throughput, security and ease of deployment.
Key Drivers, Barriers & Challenges in Outdoor Bridge
Key Drivers: Increasing demand for reliable wireless connectivity in remote areas, growth of IoT applications, government initiatives to expand broadband access, advancements in wireless technologies (e.g., higher frequency bands, MIMO).
Challenges: High initial investment costs, complex deployment requirements, vulnerability to environmental factors (weather, interference), regulatory hurdles surrounding spectrum allocation, supply chain disruptions impacting component availability (xx% impact on production in 2024).
Emerging Opportunities in Outdoor Bridge
Emerging opportunities lie in expanding into untapped markets in developing countries, integrating with emerging technologies such as 5G and IoT platforms, and developing customized solutions for niche applications (e.g., smart agriculture, industrial automation, smart cities). Furthermore, opportunities exist in developing advanced security features and providing managed services to improve reliability and reduce operational costs for end-users.
Growth Accelerators in the Outdoor Bridge Industry
Technological advancements, strategic partnerships to improve distribution channels and market reach, and expansion into emerging markets are key accelerators of long-term growth. Investments in research and development leading to innovative product features and improved performance also drive market growth.
Notable Milestones in Outdoor Bridge Sector
- 2020: Ubiquiti Networks launches a new long-range outdoor bridge with advanced security features.
- 2022: Hikvision acquires a smaller competitor, expanding its product portfolio and market share.
- 2023: Several key players announce partnerships to enhance their distribution networks.
In-Depth Outdoor Bridge Market Outlook
The outdoor bridge market is poised for robust growth over the next decade, driven by continued technological advancements, increasing demand for reliable wireless connectivity, and expanding applications across various sectors. Strategic partnerships, investments in R&D, and expansion into emerging markets will be crucial for sustained success. The market offers significant opportunities for both established players and new entrants to capitalize on the growing demand for high-performance outdoor wireless connectivity solutions.
Outdoor Bridge Segmentation
-
1. Application
- 1.1. Wireless Network Communication
- 1.2. Wireless Security Monitoring
- 1.3. Data Transmission
- 1.4. Others
-
2. Types
- 2.1. Transparent Bridging
- 2.2. Translational Bridge
- 2.3. Encapsulation Bridge
- 2.4. Source Routing Bridge
- 2.5. Others
Outdoor Bridge Segmentation By Geography
-
1. North America
- 1.1. United States
- 1.2. Canada
- 1.3. Mexico
-
2. South America
- 2.1. Brazil
- 2.2. Argentina
- 2.3. Rest of South America
-
3. Europe
- 3.1. United Kingdom
- 3.2. Germany
- 3.3. France
- 3.4. Italy
- 3.5. Spain
- 3.6. Russia
- 3.7. Benelux
- 3.8. Nordics
- 3.9. Rest of Europe
-
4. Middle East & Africa
- 4.1. Turkey
- 4.2. Israel
- 4.3. GCC
- 4.4. North Africa
- 4.5. South Africa
- 4.6. Rest of Middle East & Africa
-
5. Asia Pacific
- 5.1. China
- 5.2. India
- 5.3. Japan
- 5.4. South Korea
- 5.5. ASEAN
- 5.6. Oceania
- 5.7. Rest of Asia Pacific
Outdoor Bridge Regional Market Share
Geographic Coverage of Outdoor Bridge
Outdoor Bridge REPORT HIGHLIGHTS
| Aspects | Details |
|---|---|
| Study Period | 2020-2034 |
| Base Year | 2025 |
| Estimated Year | 2026 |
| Forecast Period | 2026-2034 |
| Historical Period | 2020-2025 |
| Growth Rate | CAGR of 7.3% from 2020-2034 |
| Segmentation |
|
Table of Contents
- 1. Introduction
- 1.1. Research Scope
- 1.2. Market Segmentation
- 1.3. Research Objective
- 1.4. Definitions and Assumptions
- 2. Executive Summary
- 2.1. Market Snapshot
- 3. Market Dynamics
- 3.1. Market Drivers
- 3.2. Market Restrains
- 3.3. Market Trends
- 3.4. Market Opportunities
- 4. Market Factor Analysis
- 4.1. Porters Five Forces
- 4.1.1. Bargaining Power of Suppliers
- 4.1.2. Bargaining Power of Buyers
- 4.1.3. Threat of New Entrants
- 4.1.4. Threat of Substitutes
- 4.1.5. Competitive Rivalry
- 4.2. PESTEL analysis
- 4.3. BCG Analysis
- 4.3.1. Stars (High Growth, High Market Share)
- 4.3.2. Cash Cows (Low Growth, High Market Share)
- 4.3.3. Question Mark (High Growth, Low Market Share)
- 4.3.4. Dogs (Low Growth, Low Market Share)
- 4.4. Ansoff Matrix Analysis
- 4.5. Supply Chain Analysis
- 4.6. Regulatory Landscape
- 4.7. Current Market Potential and Opportunity Assessment (TAM–SAM–SOM Framework)
- 4.8. VDR Analyst Note
- 4.1. Porters Five Forces
- 5. Market Analysis, Insights and Forecast 2021-2033
- 5.1. Market Analysis, Insights and Forecast - by Application
- 5.1.1. Wireless Network Communication
- 5.1.2. Wireless Security Monitoring
- 5.1.3. Data Transmission
- 5.1.4. Others
- 5.2. Market Analysis, Insights and Forecast - by Types
- 5.2.1. Transparent Bridging
- 5.2.2. Translational Bridge
- 5.2.3. Encapsulation Bridge
- 5.2.4. Source Routing Bridge
- 5.2.5. Others
- 5.3. Market Analysis, Insights and Forecast - by Region
- 5.3.1. North America
- 5.3.2. South America
- 5.3.3. Europe
- 5.3.4. Middle East & Africa
- 5.3.5. Asia Pacific
- 5.1. Market Analysis, Insights and Forecast - by Application
- 6. Global Outdoor Bridge Analysis, Insights and Forecast, 2021-2033
- 6.1. Market Analysis, Insights and Forecast - by Application
- 6.1.1. Wireless Network Communication
- 6.1.2. Wireless Security Monitoring
- 6.1.3. Data Transmission
- 6.1.4. Others
- 6.2. Market Analysis, Insights and Forecast - by Types
- 6.2.1. Transparent Bridging
- 6.2.2. Translational Bridge
- 6.2.3. Encapsulation Bridge
- 6.2.4. Source Routing Bridge
- 6.2.5. Others
- 6.1. Market Analysis, Insights and Forecast - by Application
- 7. North America Outdoor Bridge Analysis, Insights and Forecast, 2021-2033
- 7.1. Market Analysis, Insights and Forecast - by Application
- 7.1.1. Wireless Network Communication
- 7.1.2. Wireless Security Monitoring
- 7.1.3. Data Transmission
- 7.1.4. Others
- 7.2. Market Analysis, Insights and Forecast - by Types
- 7.2.1. Transparent Bridging
- 7.2.2. Translational Bridge
- 7.2.3. Encapsulation Bridge
- 7.2.4. Source Routing Bridge
- 7.2.5. Others
- 7.1. Market Analysis, Insights and Forecast - by Application
- 8. South America Outdoor Bridge Analysis, Insights and Forecast, 2021-2033
- 8.1. Market Analysis, Insights and Forecast - by Application
- 8.1.1. Wireless Network Communication
- 8.1.2. Wireless Security Monitoring
- 8.1.3. Data Transmission
- 8.1.4. Others
- 8.2. Market Analysis, Insights and Forecast - by Types
- 8.2.1. Transparent Bridging
- 8.2.2. Translational Bridge
- 8.2.3. Encapsulation Bridge
- 8.2.4. Source Routing Bridge
- 8.2.5. Others
- 8.1. Market Analysis, Insights and Forecast - by Application
- 9. Europe Outdoor Bridge Analysis, Insights and Forecast, 2021-2033
- 9.1. Market Analysis, Insights and Forecast - by Application
- 9.1.1. Wireless Network Communication
- 9.1.2. Wireless Security Monitoring
- 9.1.3. Data Transmission
- 9.1.4. Others
- 9.2. Market Analysis, Insights and Forecast - by Types
- 9.2.1. Transparent Bridging
- 9.2.2. Translational Bridge
- 9.2.3. Encapsulation Bridge
- 9.2.4. Source Routing Bridge
- 9.2.5. Others
- 9.1. Market Analysis, Insights and Forecast - by Application
- 10. Middle East & Africa Outdoor Bridge Analysis, Insights and Forecast, 2021-2033
- 10.1. Market Analysis, Insights and Forecast - by Application
- 10.1.1. Wireless Network Communication
- 10.1.2. Wireless Security Monitoring
- 10.1.3. Data Transmission
- 10.1.4. Others
- 10.2. Market Analysis, Insights and Forecast - by Types
- 10.2.1. Transparent Bridging
- 10.2.2. Translational Bridge
- 10.2.3. Encapsulation Bridge
- 10.2.4. Source Routing Bridge
- 10.2.5. Others
- 10.1. Market Analysis, Insights and Forecast - by Application
- 11. Asia Pacific Outdoor Bridge Analysis, Insights and Forecast, 2021-2033
- 11.1. Market Analysis, Insights and Forecast - by Application
- 11.1.1. Wireless Network Communication
- 11.1.2. Wireless Security Monitoring
- 11.1.3. Data Transmission
- 11.1.4. Others
- 11.2. Market Analysis, Insights and Forecast - by Types
- 11.2.1. Transparent Bridging
- 11.2.2. Translational Bridge
- 11.2.3. Encapsulation Bridge
- 11.2.4. Source Routing Bridge
- 11.2.5. Others
- 11.1. Market Analysis, Insights and Forecast - by Application
- 12. Competitive Analysis
- 12.1. Company Profiles
- 12.1.1 Hikvision
- 12.1.1.1. Company Overview
- 12.1.1.2. Products
- 12.1.1.3. Company Financials
- 12.1.1.4. SWOT Analysis
- 12.1.2 TP-LINK
- 12.1.2.1. Company Overview
- 12.1.2.2. Products
- 12.1.2.3. Company Financials
- 12.1.2.4. SWOT Analysis
- 12.1.3 Ubiquiti Networks
- 12.1.3.1. Company Overview
- 12.1.3.2. Products
- 12.1.3.3. Company Financials
- 12.1.3.4. SWOT Analysis
- 12.1.4 UNIVIEW
- 12.1.4.1. Company Overview
- 12.1.4.2. Products
- 12.1.4.3. Company Financials
- 12.1.4.4. SWOT Analysis
- 12.1.5 Tengyuan Zhituo
- 12.1.5.1. Company Overview
- 12.1.5.2. Products
- 12.1.5.3. Company Financials
- 12.1.5.4. SWOT Analysis
- 12.1.6 Huawei
- 12.1.6.1. Company Overview
- 12.1.6.2. Products
- 12.1.6.3. Company Financials
- 12.1.6.4. SWOT Analysis
- 12.1.7 Cisco
- 12.1.7.1. Company Overview
- 12.1.7.2. Products
- 12.1.7.3. Company Financials
- 12.1.7.4. SWOT Analysis
- 12.1.8 MOTORALA
- 12.1.8.1. Company Overview
- 12.1.8.2. Products
- 12.1.8.3. Company Financials
- 12.1.8.4. SWOT Analysis
- 12.1.9 Ruijie Network
- 12.1.9.1. Company Overview
- 12.1.9.2. Products
- 12.1.9.3. Company Financials
- 12.1.9.4. SWOT Analysis
- 12.1.10 LeGuang
- 12.1.10.1. Company Overview
- 12.1.10.2. Products
- 12.1.10.3. Company Financials
- 12.1.10.4. SWOT Analysis
- 12.1.1 Hikvision
- 12.2. Market Entropy
- 12.2.1 Company's Key Areas Served
- 12.2.2 Recent Developments
- 12.3. Company Market Share Analysis 2025
- 12.3.1 Top 5 Companies Market Share Analysis
- 12.3.2 Top 3 Companies Market Share Analysis
- 12.4. List of Potential Customers
- 13. Research Methodology
List of Figures
- Figure 1: Global Outdoor Bridge Revenue Breakdown (billion, %) by Region 2025 & 2033
- Figure 2: Global Outdoor Bridge Volume Breakdown (K, %) by Region 2025 & 2033
- Figure 3: North America Outdoor Bridge Revenue (billion), by Application 2025 & 2033
- Figure 4: North America Outdoor Bridge Volume (K), by Application 2025 & 2033
- Figure 5: North America Outdoor Bridge Revenue Share (%), by Application 2025 & 2033
- Figure 6: North America Outdoor Bridge Volume Share (%), by Application 2025 & 2033
- Figure 7: North America Outdoor Bridge Revenue (billion), by Types 2025 & 2033
- Figure 8: North America Outdoor Bridge Volume (K), by Types 2025 & 2033
- Figure 9: North America Outdoor Bridge Revenue Share (%), by Types 2025 & 2033
- Figure 10: North America Outdoor Bridge Volume Share (%), by Types 2025 & 2033
- Figure 11: North America Outdoor Bridge Revenue (billion), by Country 2025 & 2033
- Figure 12: North America Outdoor Bridge Volume (K), by Country 2025 & 2033
- Figure 13: North America Outdoor Bridge Revenue Share (%), by Country 2025 & 2033
- Figure 14: North America Outdoor Bridge Volume Share (%), by Country 2025 & 2033
- Figure 15: South America Outdoor Bridge Revenue (billion), by Application 2025 & 2033
- Figure 16: South America Outdoor Bridge Volume (K), by Application 2025 & 2033
- Figure 17: South America Outdoor Bridge Revenue Share (%), by Application 2025 & 2033
- Figure 18: South America Outdoor Bridge Volume Share (%), by Application 2025 & 2033
- Figure 19: South America Outdoor Bridge Revenue (billion), by Types 2025 & 2033
- Figure 20: South America Outdoor Bridge Volume (K), by Types 2025 & 2033
- Figure 21: South America Outdoor Bridge Revenue Share (%), by Types 2025 & 2033
- Figure 22: South America Outdoor Bridge Volume Share (%), by Types 2025 & 2033
- Figure 23: South America Outdoor Bridge Revenue (billion), by Country 2025 & 2033
- Figure 24: South America Outdoor Bridge Volume (K), by Country 2025 & 2033
- Figure 25: South America Outdoor Bridge Revenue Share (%), by Country 2025 & 2033
- Figure 26: South America Outdoor Bridge Volume Share (%), by Country 2025 & 2033
- Figure 27: Europe Outdoor Bridge Revenue (billion), by Application 2025 & 2033
- Figure 28: Europe Outdoor Bridge Volume (K), by Application 2025 & 2033
- Figure 29: Europe Outdoor Bridge Revenue Share (%), by Application 2025 & 2033
- Figure 30: Europe Outdoor Bridge Volume Share (%), by Application 2025 & 2033
- Figure 31: Europe Outdoor Bridge Revenue (billion), by Types 2025 & 2033
- Figure 32: Europe Outdoor Bridge Volume (K), by Types 2025 & 2033
- Figure 33: Europe Outdoor Bridge Revenue Share (%), by Types 2025 & 2033
- Figure 34: Europe Outdoor Bridge Volume Share (%), by Types 2025 & 2033
- Figure 35: Europe Outdoor Bridge Revenue (billion), by Country 2025 & 2033
- Figure 36: Europe Outdoor Bridge Volume (K), by Country 2025 & 2033
- Figure 37: Europe Outdoor Bridge Revenue Share (%), by Country 2025 & 2033
- Figure 38: Europe Outdoor Bridge Volume Share (%), by Country 2025 & 2033
- Figure 39: Middle East & Africa Outdoor Bridge Revenue (billion), by Application 2025 & 2033
- Figure 40: Middle East & Africa Outdoor Bridge Volume (K), by Application 2025 & 2033
- Figure 41: Middle East & Africa Outdoor Bridge Revenue Share (%), by Application 2025 & 2033
- Figure 42: Middle East & Africa Outdoor Bridge Volume Share (%), by Application 2025 & 2033
- Figure 43: Middle East & Africa Outdoor Bridge Revenue (billion), by Types 2025 & 2033
- Figure 44: Middle East & Africa Outdoor Bridge Volume (K), by Types 2025 & 2033
- Figure 45: Middle East & Africa Outdoor Bridge Revenue Share (%), by Types 2025 & 2033
- Figure 46: Middle East & Africa Outdoor Bridge Volume Share (%), by Types 2025 & 2033
- Figure 47: Middle East & Africa Outdoor Bridge Revenue (billion), by Country 2025 & 2033
- Figure 48: Middle East & Africa Outdoor Bridge Volume (K), by Country 2025 & 2033
- Figure 49: Middle East & Africa Outdoor Bridge Revenue Share (%), by Country 2025 & 2033
- Figure 50: Middle East & Africa Outdoor Bridge Volume Share (%), by Country 2025 & 2033
- Figure 51: Asia Pacific Outdoor Bridge Revenue (billion), by Application 2025 & 2033
- Figure 52: Asia Pacific Outdoor Bridge Volume (K), by Application 2025 & 2033
- Figure 53: Asia Pacific Outdoor Bridge Revenue Share (%), by Application 2025 & 2033
- Figure 54: Asia Pacific Outdoor Bridge Volume Share (%), by Application 2025 & 2033
- Figure 55: Asia Pacific Outdoor Bridge Revenue (billion), by Types 2025 & 2033
- Figure 56: Asia Pacific Outdoor Bridge Volume (K), by Types 2025 & 2033
- Figure 57: Asia Pacific Outdoor Bridge Revenue Share (%), by Types 2025 & 2033
- Figure 58: Asia Pacific Outdoor Bridge Volume Share (%), by Types 2025 & 2033
- Figure 59: Asia Pacific Outdoor Bridge Revenue (billion), by Country 2025 & 2033
- Figure 60: Asia Pacific Outdoor Bridge Volume (K), by Country 2025 & 2033
- Figure 61: Asia Pacific Outdoor Bridge Revenue Share (%), by Country 2025 & 2033
- Figure 62: Asia Pacific Outdoor Bridge Volume Share (%), by Country 2025 & 2033
List of Tables
- Table 1: Global Outdoor Bridge Revenue billion Forecast, by Application 2020 & 2033
- Table 2: Global Outdoor Bridge Volume K Forecast, by Application 2020 & 2033
- Table 3: Global Outdoor Bridge Revenue billion Forecast, by Types 2020 & 2033
- Table 4: Global Outdoor Bridge Volume K Forecast, by Types 2020 & 2033
- Table 5: Global Outdoor Bridge Revenue billion Forecast, by Region 2020 & 2033
- Table 6: Global Outdoor Bridge Volume K Forecast, by Region 2020 & 2033
- Table 7: Global Outdoor Bridge Revenue billion Forecast, by Application 2020 & 2033
- Table 8: Global Outdoor Bridge Volume K Forecast, by Application 2020 & 2033
- Table 9: Global Outdoor Bridge Revenue billion Forecast, by Types 2020 & 2033
- Table 10: Global Outdoor Bridge Volume K Forecast, by Types 2020 & 2033
- Table 11: Global Outdoor Bridge Revenue billion Forecast, by Country 2020 & 2033
- Table 12: Global Outdoor Bridge Volume K Forecast, by Country 2020 & 2033
- Table 13: United States Outdoor Bridge Revenue (billion) Forecast, by Application 2020 & 2033
- Table 14: United States Outdoor Bridge Volume (K) Forecast, by Application 2020 & 2033
- Table 15: Canada Outdoor Bridge Revenue (billion) Forecast, by Application 2020 & 2033
- Table 16: Canada Outdoor Bridge Volume (K) Forecast, by Application 2020 & 2033
- Table 17: Mexico Outdoor Bridge Revenue (billion) Forecast, by Application 2020 & 2033
- Table 18: Mexico Outdoor Bridge Volume (K) Forecast, by Application 2020 & 2033
- Table 19: Global Outdoor Bridge Revenue billion Forecast, by Application 2020 & 2033
- Table 20: Global Outdoor Bridge Volume K Forecast, by Application 2020 & 2033
- Table 21: Global Outdoor Bridge Revenue billion Forecast, by Types 2020 & 2033
- Table 22: Global Outdoor Bridge Volume K Forecast, by Types 2020 & 2033
- Table 23: Global Outdoor Bridge Revenue billion Forecast, by Country 2020 & 2033
- Table 24: Global Outdoor Bridge Volume K Forecast, by Country 2020 & 2033
- Table 25: Brazil Outdoor Bridge Revenue (billion) Forecast, by Application 2020 & 2033
- Table 26: Brazil Outdoor Bridge Volume (K) Forecast, by Application 2020 & 2033
- Table 27: Argentina Outdoor Bridge Revenue (billion) Forecast, by Application 2020 & 2033
- Table 28: Argentina Outdoor Bridge Volume (K) Forecast, by Application 2020 & 2033
- Table 29: Rest of South America Outdoor Bridge Revenue (billion) Forecast, by Application 2020 & 2033
- Table 30: Rest of South America Outdoor Bridge Volume (K) Forecast, by Application 2020 & 2033
- Table 31: Global Outdoor Bridge Revenue billion Forecast, by Application 2020 & 2033
- Table 32: Global Outdoor Bridge Volume K Forecast, by Application 2020 & 2033
- Table 33: Global Outdoor Bridge Revenue billion Forecast, by Types 2020 & 2033
- Table 34: Global Outdoor Bridge Volume K Forecast, by Types 2020 & 2033
- Table 35: Global Outdoor Bridge Revenue billion Forecast, by Country 2020 & 2033
- Table 36: Global Outdoor Bridge Volume K Forecast, by Country 2020 & 2033
- Table 37: United Kingdom Outdoor Bridge Revenue (billion) Forecast, by Application 2020 & 2033
- Table 38: United Kingdom Outdoor Bridge Volume (K) Forecast, by Application 2020 & 2033
- Table 39: Germany Outdoor Bridge Revenue (billion) Forecast, by Application 2020 & 2033
- Table 40: Germany Outdoor Bridge Volume (K) Forecast, by Application 2020 & 2033
- Table 41: France Outdoor Bridge Revenue (billion) Forecast, by Application 2020 & 2033
- Table 42: France Outdoor Bridge Volume (K) Forecast, by Application 2020 & 2033
- Table 43: Italy Outdoor Bridge Revenue (billion) Forecast, by Application 2020 & 2033
- Table 44: Italy Outdoor Bridge Volume (K) Forecast, by Application 2020 & 2033
- Table 45: Spain Outdoor Bridge Revenue (billion) Forecast, by Application 2020 & 2033
- Table 46: Spain Outdoor Bridge Volume (K) Forecast, by Application 2020 & 2033
- Table 47: Russia Outdoor Bridge Revenue (billion) Forecast, by Application 2020 & 2033
- Table 48: Russia Outdoor Bridge Volume (K) Forecast, by Application 2020 & 2033
- Table 49: Benelux Outdoor Bridge Revenue (billion) Forecast, by Application 2020 & 2033
- Table 50: Benelux Outdoor Bridge Volume (K) Forecast, by Application 2020 & 2033
- Table 51: Nordics Outdoor Bridge Revenue (billion) Forecast, by Application 2020 & 2033
- Table 52: Nordics Outdoor Bridge Volume (K) Forecast, by Application 2020 & 2033
- Table 53: Rest of Europe Outdoor Bridge Revenue (billion) Forecast, by Application 2020 & 2033
- Table 54: Rest of Europe Outdoor Bridge Volume (K) Forecast, by Application 2020 & 2033
- Table 55: Global Outdoor Bridge Revenue billion Forecast, by Application 2020 & 2033
- Table 56: Global Outdoor Bridge Volume K Forecast, by Application 2020 & 2033
- Table 57: Global Outdoor Bridge Revenue billion Forecast, by Types 2020 & 2033
- Table 58: Global Outdoor Bridge Volume K Forecast, by Types 2020 & 2033
- Table 59: Global Outdoor Bridge Revenue billion Forecast, by Country 2020 & 2033
- Table 60: Global Outdoor Bridge Volume K Forecast, by Country 2020 & 2033
- Table 61: Turkey Outdoor Bridge Revenue (billion) Forecast, by Application 2020 & 2033
- Table 62: Turkey Outdoor Bridge Volume (K) Forecast, by Application 2020 & 2033
- Table 63: Israel Outdoor Bridge Revenue (billion) Forecast, by Application 2020 & 2033
- Table 64: Israel Outdoor Bridge Volume (K) Forecast, by Application 2020 & 2033
- Table 65: GCC Outdoor Bridge Revenue (billion) Forecast, by Application 2020 & 2033
- Table 66: GCC Outdoor Bridge Volume (K) Forecast, by Application 2020 & 2033
- Table 67: North Africa Outdoor Bridge Revenue (billion) Forecast, by Application 2020 & 2033
- Table 68: North Africa Outdoor Bridge Volume (K) Forecast, by Application 2020 & 2033
- Table 69: South Africa Outdoor Bridge Revenue (billion) Forecast, by Application 2020 & 2033
- Table 70: South Africa Outdoor Bridge Volume (K) Forecast, by Application 2020 & 2033
- Table 71: Rest of Middle East & Africa Outdoor Bridge Revenue (billion) Forecast, by Application 2020 & 2033
- Table 72: Rest of Middle East & Africa Outdoor Bridge Volume (K) Forecast, by Application 2020 & 2033
- Table 73: Global Outdoor Bridge Revenue billion Forecast, by Application 2020 & 2033
- Table 74: Global Outdoor Bridge Volume K Forecast, by Application 2020 & 2033
- Table 75: Global Outdoor Bridge Revenue billion Forecast, by Types 2020 & 2033
- Table 76: Global Outdoor Bridge Volume K Forecast, by Types 2020 & 2033
- Table 77: Global Outdoor Bridge Revenue billion Forecast, by Country 2020 & 2033
- Table 78: Global Outdoor Bridge Volume K Forecast, by Country 2020 & 2033
- Table 79: China Outdoor Bridge Revenue (billion) Forecast, by Application 2020 & 2033
- Table 80: China Outdoor Bridge Volume (K) Forecast, by Application 2020 & 2033
- Table 81: India Outdoor Bridge Revenue (billion) Forecast, by Application 2020 & 2033
- Table 82: India Outdoor Bridge Volume (K) Forecast, by Application 2020 & 2033
- Table 83: Japan Outdoor Bridge Revenue (billion) Forecast, by Application 2020 & 2033
- Table 84: Japan Outdoor Bridge Volume (K) Forecast, by Application 2020 & 2033
- Table 85: South Korea Outdoor Bridge Revenue (billion) Forecast, by Application 2020 & 2033
- Table 86: South Korea Outdoor Bridge Volume (K) Forecast, by Application 2020 & 2033
- Table 87: ASEAN Outdoor Bridge Revenue (billion) Forecast, by Application 2020 & 2033
- Table 88: ASEAN Outdoor Bridge Volume (K) Forecast, by Application 2020 & 2033
- Table 89: Oceania Outdoor Bridge Revenue (billion) Forecast, by Application 2020 & 2033
- Table 90: Oceania Outdoor Bridge Volume (K) Forecast, by Application 2020 & 2033
- Table 91: Rest of Asia Pacific Outdoor Bridge Revenue (billion) Forecast, by Application 2020 & 2033
- Table 92: Rest of Asia Pacific Outdoor Bridge Volume (K) Forecast, by Application 2020 & 2033
Frequently Asked Questions
1. What is the projected Compound Annual Growth Rate (CAGR) of the Outdoor Bridge?
The projected CAGR is approximately 7.3%.
2. Which companies are prominent players in the Outdoor Bridge?
Key companies in the market include Hikvision, TP-LINK, Ubiquiti Networks, UNIVIEW, Tengyuan Zhituo, Huawei, Cisco, MOTORALA, Ruijie Network, LeGuang.
3. What are the main segments of the Outdoor Bridge?
The market segments include Application, Types.
4. Can you provide details about the market size?
The market size is estimated to be USD 15.31 billion as of 2022.
5. What are some drivers contributing to market growth?
N/A
6. What are the notable trends driving market growth?
N/A
7. Are there any restraints impacting market growth?
N/A
8. Can you provide examples of recent developments in the market?
N/A
9. What pricing options are available for accessing the report?
Pricing options include single-user, multi-user, and enterprise licenses priced at USD 3950.00, USD 5925.00, and USD 7900.00 respectively.
10. Is the market size provided in terms of value or volume?
The market size is provided in terms of value, measured in billion and volume, measured in K.
11. Are there any specific market keywords associated with the report?
Yes, the market keyword associated with the report is "Outdoor Bridge," which aids in identifying and referencing the specific market segment covered.
12. How do I determine which pricing option suits my needs best?
The pricing options vary based on user requirements and access needs. Individual users may opt for single-user licenses, while businesses requiring broader access may choose multi-user or enterprise licenses for cost-effective access to the report.
13. Are there any additional resources or data provided in the Outdoor Bridge report?
While the report offers comprehensive insights, it's advisable to review the specific contents or supplementary materials provided to ascertain if additional resources or data are available.
14. How can I stay updated on further developments or reports in the Outdoor Bridge?
To stay informed about further developments, trends, and reports in the Outdoor Bridge, consider subscribing to industry newsletters, following relevant companies and organizations, or regularly checking reputable industry news sources and publications.
Methodology
Step 1 - Identification of Relevant Samples Size from Population Database


Step 2 - Approaches for Defining Global Market Size (Value, Volume* & Price*)

Note*: In applicable scenarios
Step 3 - Data Sources
Primary Research
- Web Analytics
- Survey Reports
- Research Institute
- Latest Research Reports
- Opinion Leaders
Secondary Research
- Annual Reports
- White Paper
- Latest Press Release
- Industry Association
- Paid Database
- Investor Presentations

Step 4 - Data Triangulation
Involves using different sources of information in order to increase the validity of a study
These sources are likely to be stakeholders in a program - participants, other researchers, program staff, other community members, and so on.
Then we put all data in single framework & apply various statistical tools to find out the dynamic on the market.
During the analysis stage, feedback from the stakeholder groups would be compared to determine areas of agreement as well as areas of divergence