

Key Insights
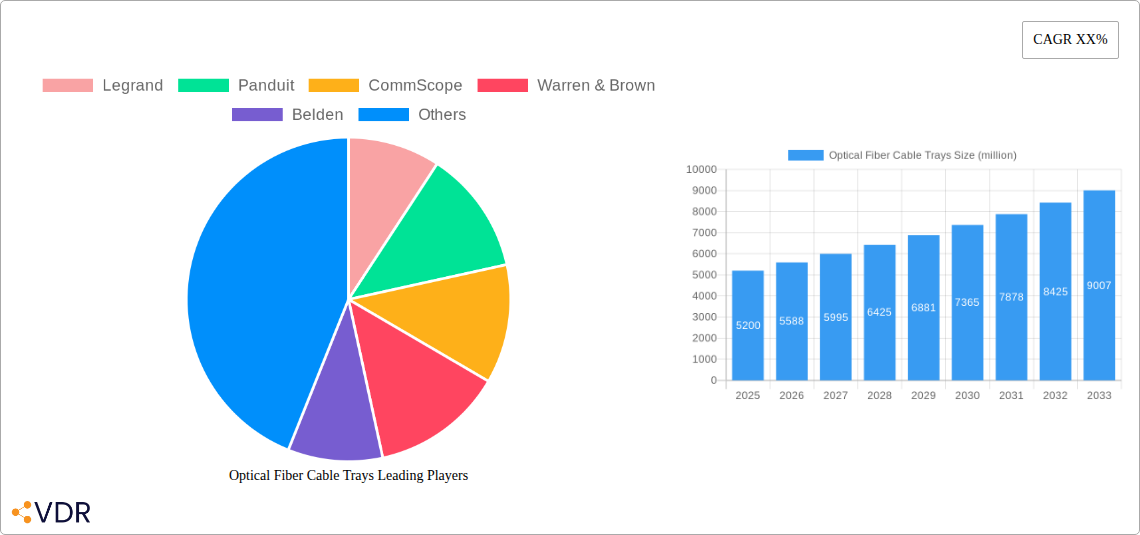
The global Optical Fiber Cable Trays market is poised for significant expansion, projected to reach a substantial market size of approximately $5.2 billion by 2025, driven by a robust Compound Annual Growth Rate (CAGR) of around 7.5%. This growth is primarily fueled by the escalating demand for high-speed data transmission across various sectors. The burgeoning adoption of 5G technology, the exponential increase in data center infrastructure to support cloud computing and big data analytics, and the continuous evolution of communication networks are key market drivers. Furthermore, the increasing deployment of fiber-to-the-home (FTTH) initiatives globally is creating a sustained demand for reliable and organized cable management solutions, directly benefiting the optical fiber cable tray market. The "300mm Above" segment is expected to dominate, reflecting the trend towards higher density deployments and advanced networking needs, while the "Data Center" application segment will continue to be the primary revenue generator due to its critical role in modern digital economies.
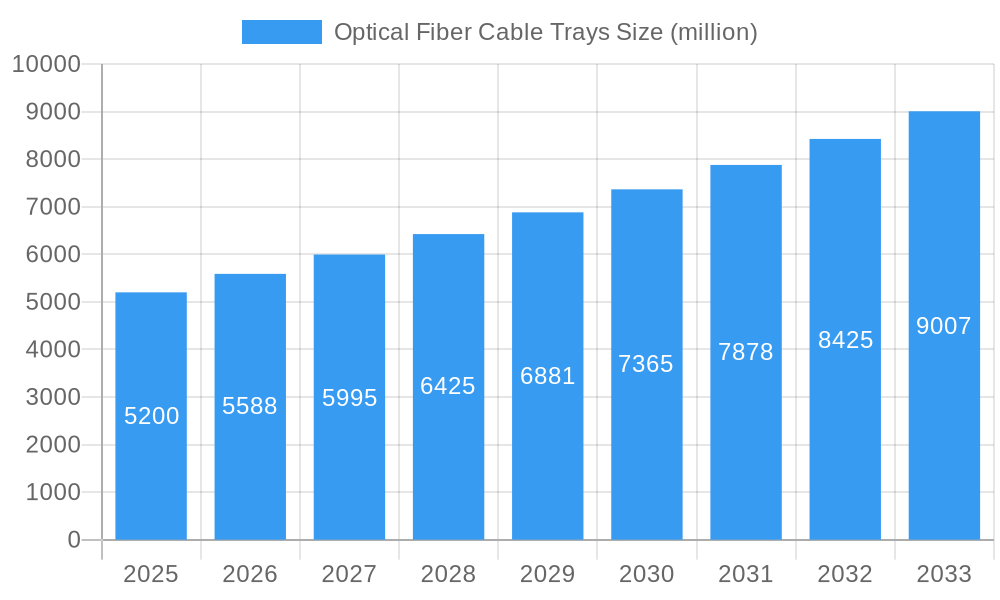
Optical Fiber Cable Trays Market Size (In Billion)
The market, however, is not without its challenges. Restraints such as the high initial cost of advanced fiber optic infrastructure and the availability of alternative cable management solutions, albeit less specialized, could temper rapid adoption in certain regions or sectors. Despite these hurdles, the pervasive need for efficient, secure, and organized routing of optical fiber cables in demanding environments like telecommunications facilities and industrial settings will sustain market momentum. Emerging markets in Asia Pacific, particularly China and India, are expected to exhibit remarkable growth due to substantial investments in digital infrastructure and expanding telecommunications networks. Key players like CommScope, Panduit, and Legrand are actively innovating and expanding their product portfolios to cater to these evolving market needs, focusing on solutions that enhance cable density, ease of installation, and environmental resilience.
Optical Fiber Cable Trays Company Market Share
This in-depth market research report provides a definitive analysis of the global Optical Fiber Cable Trays market, encompassing a comprehensive study period from 2019 to 2033, with the base year of 2025. We delve into the intricate dynamics, growth trends, regional dominance, product innovations, key drivers, emerging opportunities, and competitive landscape of this critical infrastructure component. This report is an indispensable resource for industry stakeholders, investors, and decision-makers seeking to understand and capitalize on the evolving optical fiber cable tray market.
Optical Fiber Cable Trays Market Dynamics & Structure
The optical fiber cable tray market exhibits a moderate to high concentration, with key players investing heavily in technological advancements and product diversification. The primary drivers of innovation stem from the increasing demand for high-speed data transmission in data centers and telecommunication facilities, pushing the boundaries of cable management solutions. Regulatory frameworks, particularly those focused on safety standards and environmental impact, are also shaping product development and manufacturing processes. Competitive product substitutes, though present in the form of alternative cabling systems, are largely outpaced by the superior performance and scalability offered by optical fiber solutions. End-user demographics are dominated by large enterprises, telecommunications providers, and cloud service operators, with a growing interest from emerging markets and smart city initiatives. Mergers and acquisitions (M&A) activity, valued at an estimated xx million units in recent years, is a strategic tool for market consolidation and expansion of product portfolios, further influencing market structure. Barriers to entry include substantial capital investment for manufacturing facilities and the need for specialized expertise in product design and installation.
- Market Concentration: Moderate to High, driven by strategic M&A and technological investments.
- Technological Innovation Drivers: Demand for higher bandwidth, miniaturization, and enhanced protection for optical cables.
- Regulatory Frameworks: Emphasis on safety, fire resistance, and environmental sustainability standards.
- Competitive Product Substitutes: Limited impact due to superior optical fiber performance and dedicated tray solutions.
- End-User Demographics: Enterprise data centers, telecommunication networks, cloud providers, and expanding smart city infrastructure.
- M&A Trends: Strategic acquisitions to gain market share, expand product lines, and enter new geographies. Estimated M&A deal volume: xx million units.
- Innovation Barriers: High R&D costs, specialized manufacturing processes, and long product development cycles.
Optical Fiber Cable Trays Growth Trends & Insights
The global optical fiber cable trays market is projected to experience robust growth, driven by the relentless surge in data traffic and the expansion of digital infrastructure worldwide. Market size evolution is characterized by a steady upward trajectory, fueled by the increasing deployment of 5G networks, the proliferation of IoT devices, and the exponential growth of cloud computing. Adoption rates for optical fiber cable trays are directly correlated with the expansion of telecommunication networks and the modernization of data centers. Technological disruptions, such as advancements in cable tray materials for enhanced durability and fire resistance, alongside innovative designs for easier installation and maintenance, are continuously reshaping the market. Consumer behavior shifts are evident in the growing preference for integrated cable management solutions that offer superior protection, organization, and scalability for increasingly complex fiber optic networks. We project a Compound Annual Growth Rate (CAGR) of xx% over the forecast period. The market penetration of optical fiber cable trays is expected to reach xx% by 2033. This sustained growth is underpinned by significant investments in telecommunications infrastructure and data center expansion globally. The demand for higher bandwidth and lower latency applications continues to drive the adoption of fiber optic technology, making robust cable management systems like optical fiber cable trays indispensable. Emerging economies are increasingly recognizing the strategic importance of advanced telecommunication networks, leading to accelerated infrastructure development and a corresponding increase in the demand for optical fiber cable trays. The integration of smart technologies within cable management systems, offering real-time monitoring and diagnostics, is also gaining traction, further enhancing their value proposition for end-users.
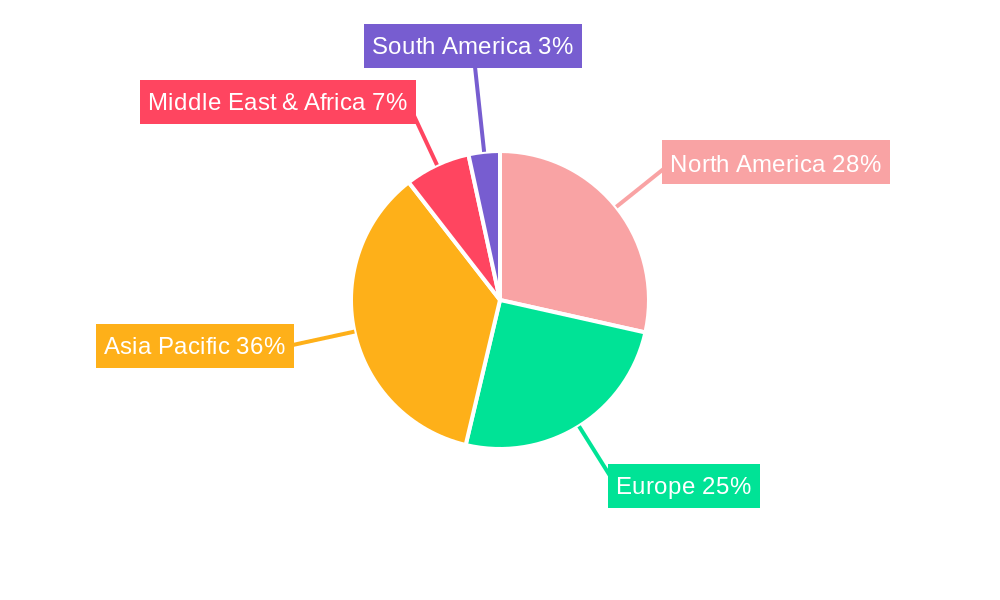
Dominant Regions, Countries, or Segments in Optical Fiber Cable Trays
The Data Center application segment, particularly for 300mm Above type optical fiber cable trays, stands as a dominant force driving market growth globally. This dominance is attributed to the insatiable demand for high-density computing power and vast data storage, necessitating sophisticated and scalable cable management solutions. North America and Europe currently lead in market share, driven by established data center ecosystems and significant ongoing investments in infrastructure upgrades to support hyperscale data centers and cloud services. The United States, in particular, represents a substantial market due to the presence of major technology companies and cloud providers. Asia Pacific, however, is emerging as the fastest-growing region, propelled by rapid digitalization, increasing investments in telecommunication infrastructure, and the expansion of smart city initiatives. Countries like China and India are witnessing massive deployments of fiber optic networks and data centers, creating a significant demand for optical fiber cable trays. Key drivers in these regions include supportive government policies, increasing disposable incomes, and a burgeoning digital economy. Economic policies favoring technological advancement and infrastructure development, such as tax incentives for data center construction and broadband expansion programs, play a crucial role. Infrastructure development, including the rollout of 5G networks and the expansion of submarine cable landing stations, directly fuels the demand for high-capacity cable management solutions. The market share for the Data Center segment is estimated at xx% of the total market. The 300mm Above type trays are favored for their capacity to manage the dense cabling required in modern data centers, offering superior airflow and accessibility. Growth potential in this segment remains exceptionally high, as organizations continue to invest in expanding their data processing and storage capabilities.
- Dominant Segment: Data Center Application.
- Dominant Type: 300mm Above.
- Leading Regions: North America, Europe.
- Fastest Growing Region: Asia Pacific.
- Key Drivers:
- Hyperscale data center expansion and upgrades.
- 5G network deployments and fiber-to-the-home (FTTH) initiatives.
- Growth of cloud computing services.
- Smart city development projects.
- Supportive government policies and investments in digital infrastructure.
- Market Share (Data Center Segment): xx%
- Growth Potential: High, driven by continuous demand for increased data capacity and performance.
Optical Fiber Cable Trays Product Landscape
The optical fiber cable tray market is characterized by continuous product innovation focused on enhanced durability, ease of installation, and superior cable protection. Manufacturers are developing trays made from advanced composite materials that offer increased strength, corrosion resistance, and lighter weight. Innovations include modular designs for flexible configurations, integrated bend radius control to prevent fiber damage, and advanced fire-retardant properties for increased safety. Applications span from high-density data centers to outdoor telecommunication infrastructure, with each segment benefiting from tailored product features. Performance metrics are continually being improved, with a focus on load-bearing capacity, thermal management, and electromagnetic interference (EMI) shielding. Unique selling propositions often revolve around patented locking mechanisms for secure assembly, extended warranty periods, and customized solutions for complex installations. Technological advancements are also driving the development of smart cable trays equipped with sensors for environmental monitoring and cable integrity checks.
Key Drivers, Barriers & Challenges in Optical Fiber Cable Trays
Key Drivers: The optical fiber cable trays market is propelled by the exponential growth of data consumption, the widespread adoption of 5G technology, and the continuous expansion of data center infrastructure. Increased government investments in telecommunications and digital infrastructure, coupled with the demand for high-speed internet connectivity, are significant growth accelerators. Technological advancements leading to more durable, lightweight, and easier-to-install cable tray solutions also play a vital role.
Key Barriers & Challenges: Supply chain disruptions and rising raw material costs can impact manufacturing and pricing strategies. Stringent regulatory requirements and the need for product certifications can pose hurdles for new entrants. Intense competition among established players and the emergence of low-cost alternatives from emerging markets present pricing pressures. Furthermore, the initial capital investment for deploying advanced fiber optic infrastructure can be a restraint for some end-users. The complexity of large-scale installations and the need for skilled labor can also present challenges.
Emerging Opportunities in Optical Fiber Cable Trays
Emerging opportunities lie in the increasing demand for intelligent cable management systems that integrate IoT sensors for real-time monitoring of environmental conditions and cable health. The expansion of smart city initiatives worldwide presents a significant untapped market for robust and scalable optical fiber cable tray solutions. Furthermore, the growing adoption of augmented reality (AR) and virtual reality (VR) technologies, which require ultra-low latency and high bandwidth, will drive further demand for advanced fiber optic infrastructure and, consequently, specialized cable trays. There is also an opportunity in developing sustainable and eco-friendly cable tray materials.
Growth Accelerators in the Optical Fiber Cable Trays Industry
Long-term growth in the optical fiber cable trays industry is being accelerated by several key catalysts. Technological breakthroughs in material science are leading to stronger, lighter, and more cost-effective cable trays. Strategic partnerships between cable tray manufacturers and telecommunication equipment providers are fostering integrated solutions and expanding market reach. Aggressive market expansion strategies by leading companies, focusing on penetrating emerging economies and offering comprehensive end-to-end solutions, are also driving significant growth. The increasing trend towards network centralization and edge computing further fuels the need for high-density cable management.
Key Players Shaping the Optical Fiber Cable Trays Market
- Legrand
- Panduit
- CommScope
- Warren & Brown
- Belden
- Leviton
- Rosenberger OSI
- R&M (Reichle & De-Massari AG)
- Canovate
- Eaton
- Vericom Global Solutions
- Fiber Tech Composite
- Vichnet Technology
- Ningbo Longxing Telecommunications
- Ningbo Lepin
- szzltx
- Beijing Shuanglongsheng Cable Bridge Making
- Yuhao Tongxin
- Junhe Tongxin
Notable Milestones in Optical Fiber Cable Trays Sector
- 2019: Introduction of high-density, modular cable tray systems for data centers.
- 2020: Launch of advanced fire-resistant composite cable trays meeting stringent safety standards.
- 2021: Significant increase in M&A activity as major players consolidated market presence.
- 2022: Development of smart cable trays with integrated sensor technology for environmental monitoring.
- 2023: Increased focus on sustainable manufacturing processes and eco-friendly materials.
- 2024: Expansion of product lines to cater to the growing demands of 5G infrastructure deployments.
- 2025 (Estimated): Introduction of next-generation lightweight and ultra-strong composite trays.
In-Depth Optical Fiber Cable Trays Market Outlook
The future of the optical fiber cable trays market is exceptionally bright, fueled by sustained global investments in digital infrastructure. Growth accelerators such as the relentless demand for bandwidth, the ongoing expansion of 5G networks, and the proliferation of data centers will continue to drive market expansion. Strategic collaborations and technological innovations will further enhance product offerings, leading to more efficient, secure, and scalable cable management solutions. The increasing emphasis on smart cities and the Internet of Things (IoT) presents significant untapped potential, making the optical fiber cable tray market a critical component of future technological advancements and a promising investment opportunity. The projected market growth of xx% underscores the strategic importance of this sector.
Optical Fiber Cable Trays Segmentation
-
1. Application
- 1.1. Data Center
- 1.2. Communication Facilities
- 1.3. Others
-
2. Types
- 2.1. 200mm Below
- 2.2. 200-300mm
- 2.3. 300mm Above
Optical Fiber Cable Trays Segmentation By Geography
-
1. North America
- 1.1. United States
- 1.2. Canada
- 1.3. Mexico
-
2. South America
- 2.1. Brazil
- 2.2. Argentina
- 2.3. Rest of South America
-
3. Europe
- 3.1. United Kingdom
- 3.2. Germany
- 3.3. France
- 3.4. Italy
- 3.5. Spain
- 3.6. Russia
- 3.7. Benelux
- 3.8. Nordics
- 3.9. Rest of Europe
-
4. Middle East & Africa
- 4.1. Turkey
- 4.2. Israel
- 4.3. GCC
- 4.4. North Africa
- 4.5. South Africa
- 4.6. Rest of Middle East & Africa
-
5. Asia Pacific
- 5.1. China
- 5.2. India
- 5.3. Japan
- 5.4. South Korea
- 5.5. ASEAN
- 5.6. Oceania
- 5.7. Rest of Asia Pacific
Optical Fiber Cable Trays Regional Market Share
Geographic Coverage of Optical Fiber Cable Trays
Optical Fiber Cable Trays REPORT HIGHLIGHTS
| Aspects | Details |
|---|---|
| Study Period | 2020-2034 |
| Base Year | 2025 |
| Estimated Year | 2026 |
| Forecast Period | 2026-2034 |
| Historical Period | 2020-2025 |
| Growth Rate | CAGR of 6.86% from 2020-2034 |
| Segmentation |
|
Table of Contents
- 1. Introduction
- 1.1. Research Scope
- 1.2. Market Segmentation
- 1.3. Research Objective
- 1.4. Definitions and Assumptions
- 2. Executive Summary
- 2.1. Market Snapshot
- 3. Market Dynamics
- 3.1. Market Drivers
- 3.2. Market Restrains
- 3.3. Market Trends
- 3.4. Market Opportunities
- 4. Market Factor Analysis
- 4.1. Porters Five Forces
- 4.1.1. Bargaining Power of Suppliers
- 4.1.2. Bargaining Power of Buyers
- 4.1.3. Threat of New Entrants
- 4.1.4. Threat of Substitutes
- 4.1.5. Competitive Rivalry
- 4.2. PESTEL analysis
- 4.3. BCG Analysis
- 4.3.1. Stars (High Growth, High Market Share)
- 4.3.2. Cash Cows (Low Growth, High Market Share)
- 4.3.3. Question Mark (High Growth, Low Market Share)
- 4.3.4. Dogs (Low Growth, Low Market Share)
- 4.4. Ansoff Matrix Analysis
- 4.5. Supply Chain Analysis
- 4.6. Regulatory Landscape
- 4.7. Current Market Potential and Opportunity Assessment (TAM–SAM–SOM Framework)
- 4.8. VDR Analyst Note
- 4.1. Porters Five Forces
- 5. Market Analysis, Insights and Forecast 2021-2033
- 5.1. Market Analysis, Insights and Forecast - by Application
- 5.1.1. Data Center
- 5.1.2. Communication Facilities
- 5.1.3. Others
- 5.2. Market Analysis, Insights and Forecast - by Types
- 5.2.1. 200mm Below
- 5.2.2. 200-300mm
- 5.2.3. 300mm Above
- 5.3. Market Analysis, Insights and Forecast - by Region
- 5.3.1. North America
- 5.3.2. South America
- 5.3.3. Europe
- 5.3.4. Middle East & Africa
- 5.3.5. Asia Pacific
- 5.1. Market Analysis, Insights and Forecast - by Application
- 6. Global Optical Fiber Cable Trays Analysis, Insights and Forecast, 2021-2033
- 6.1. Market Analysis, Insights and Forecast - by Application
- 6.1.1. Data Center
- 6.1.2. Communication Facilities
- 6.1.3. Others
- 6.2. Market Analysis, Insights and Forecast - by Types
- 6.2.1. 200mm Below
- 6.2.2. 200-300mm
- 6.2.3. 300mm Above
- 6.1. Market Analysis, Insights and Forecast - by Application
- 7. North America Optical Fiber Cable Trays Analysis, Insights and Forecast, 2021-2033
- 7.1. Market Analysis, Insights and Forecast - by Application
- 7.1.1. Data Center
- 7.1.2. Communication Facilities
- 7.1.3. Others
- 7.2. Market Analysis, Insights and Forecast - by Types
- 7.2.1. 200mm Below
- 7.2.2. 200-300mm
- 7.2.3. 300mm Above
- 7.1. Market Analysis, Insights and Forecast - by Application
- 8. South America Optical Fiber Cable Trays Analysis, Insights and Forecast, 2021-2033
- 8.1. Market Analysis, Insights and Forecast - by Application
- 8.1.1. Data Center
- 8.1.2. Communication Facilities
- 8.1.3. Others
- 8.2. Market Analysis, Insights and Forecast - by Types
- 8.2.1. 200mm Below
- 8.2.2. 200-300mm
- 8.2.3. 300mm Above
- 8.1. Market Analysis, Insights and Forecast - by Application
- 9. Europe Optical Fiber Cable Trays Analysis, Insights and Forecast, 2021-2033
- 9.1. Market Analysis, Insights and Forecast - by Application
- 9.1.1. Data Center
- 9.1.2. Communication Facilities
- 9.1.3. Others
- 9.2. Market Analysis, Insights and Forecast - by Types
- 9.2.1. 200mm Below
- 9.2.2. 200-300mm
- 9.2.3. 300mm Above
- 9.1. Market Analysis, Insights and Forecast - by Application
- 10. Middle East & Africa Optical Fiber Cable Trays Analysis, Insights and Forecast, 2021-2033
- 10.1. Market Analysis, Insights and Forecast - by Application
- 10.1.1. Data Center
- 10.1.2. Communication Facilities
- 10.1.3. Others
- 10.2. Market Analysis, Insights and Forecast - by Types
- 10.2.1. 200mm Below
- 10.2.2. 200-300mm
- 10.2.3. 300mm Above
- 10.1. Market Analysis, Insights and Forecast - by Application
- 11. Asia Pacific Optical Fiber Cable Trays Analysis, Insights and Forecast, 2021-2033
- 11.1. Market Analysis, Insights and Forecast - by Application
- 11.1.1. Data Center
- 11.1.2. Communication Facilities
- 11.1.3. Others
- 11.2. Market Analysis, Insights and Forecast - by Types
- 11.2.1. 200mm Below
- 11.2.2. 200-300mm
- 11.2.3. 300mm Above
- 11.1. Market Analysis, Insights and Forecast - by Application
- 12. Competitive Analysis
- 12.1. Company Profiles
- 12.1.1 Legrand
- 12.1.1.1. Company Overview
- 12.1.1.2. Products
- 12.1.1.3. Company Financials
- 12.1.1.4. SWOT Analysis
- 12.1.2 Panduit
- 12.1.2.1. Company Overview
- 12.1.2.2. Products
- 12.1.2.3. Company Financials
- 12.1.2.4. SWOT Analysis
- 12.1.3 CommScope
- 12.1.3.1. Company Overview
- 12.1.3.2. Products
- 12.1.3.3. Company Financials
- 12.1.3.4. SWOT Analysis
- 12.1.4 Warren & Brown
- 12.1.4.1. Company Overview
- 12.1.4.2. Products
- 12.1.4.3. Company Financials
- 12.1.4.4. SWOT Analysis
- 12.1.5 Belden
- 12.1.5.1. Company Overview
- 12.1.5.2. Products
- 12.1.5.3. Company Financials
- 12.1.5.4. SWOT Analysis
- 12.1.6 Leviton
- 12.1.6.1. Company Overview
- 12.1.6.2. Products
- 12.1.6.3. Company Financials
- 12.1.6.4. SWOT Analysis
- 12.1.7 Rosenberger OSI
- 12.1.7.1. Company Overview
- 12.1.7.2. Products
- 12.1.7.3. Company Financials
- 12.1.7.4. SWOT Analysis
- 12.1.8 R&M (Reichle & De-Massari AG)
- 12.1.8.1. Company Overview
- 12.1.8.2. Products
- 12.1.8.3. Company Financials
- 12.1.8.4. SWOT Analysis
- 12.1.9 Canovate
- 12.1.9.1. Company Overview
- 12.1.9.2. Products
- 12.1.9.3. Company Financials
- 12.1.9.4. SWOT Analysis
- 12.1.10 Eaton
- 12.1.10.1. Company Overview
- 12.1.10.2. Products
- 12.1.10.3. Company Financials
- 12.1.10.4. SWOT Analysis
- 12.1.11 Vericom Global Solutions
- 12.1.11.1. Company Overview
- 12.1.11.2. Products
- 12.1.11.3. Company Financials
- 12.1.11.4. SWOT Analysis
- 12.1.12 Fiber Tech Composite
- 12.1.12.1. Company Overview
- 12.1.12.2. Products
- 12.1.12.3. Company Financials
- 12.1.12.4. SWOT Analysis
- 12.1.13 Vichnet Technology
- 12.1.13.1. Company Overview
- 12.1.13.2. Products
- 12.1.13.3. Company Financials
- 12.1.13.4. SWOT Analysis
- 12.1.14 Ningbo Longxing Telecommunications
- 12.1.14.1. Company Overview
- 12.1.14.2. Products
- 12.1.14.3. Company Financials
- 12.1.14.4. SWOT Analysis
- 12.1.15 Ningbo Lepin
- 12.1.15.1. Company Overview
- 12.1.15.2. Products
- 12.1.15.3. Company Financials
- 12.1.15.4. SWOT Analysis
- 12.1.16 szzltx
- 12.1.16.1. Company Overview
- 12.1.16.2. Products
- 12.1.16.3. Company Financials
- 12.1.16.4. SWOT Analysis
- 12.1.17 Beijing Shuanglongsheng Cable Bridge Making
- 12.1.17.1. Company Overview
- 12.1.17.2. Products
- 12.1.17.3. Company Financials
- 12.1.17.4. SWOT Analysis
- 12.1.18 Yuhao Tongxin
- 12.1.18.1. Company Overview
- 12.1.18.2. Products
- 12.1.18.3. Company Financials
- 12.1.18.4. SWOT Analysis
- 12.1.19 Junhe Tongxin
- 12.1.19.1. Company Overview
- 12.1.19.2. Products
- 12.1.19.3. Company Financials
- 12.1.19.4. SWOT Analysis
- 12.1.1 Legrand
- 12.2. Market Entropy
- 12.2.1 Company's Key Areas Served
- 12.2.2 Recent Developments
- 12.3. Company Market Share Analysis 2025
- 12.3.1 Top 5 Companies Market Share Analysis
- 12.3.2 Top 3 Companies Market Share Analysis
- 12.4. List of Potential Customers
- 13. Research Methodology
List of Figures
- Figure 1: Global Optical Fiber Cable Trays Revenue Breakdown (undefined, %) by Region 2025 & 2033
- Figure 2: North America Optical Fiber Cable Trays Revenue (undefined), by Application 2025 & 2033
- Figure 3: North America Optical Fiber Cable Trays Revenue Share (%), by Application 2025 & 2033
- Figure 4: North America Optical Fiber Cable Trays Revenue (undefined), by Types 2025 & 2033
- Figure 5: North America Optical Fiber Cable Trays Revenue Share (%), by Types 2025 & 2033
- Figure 6: North America Optical Fiber Cable Trays Revenue (undefined), by Country 2025 & 2033
- Figure 7: North America Optical Fiber Cable Trays Revenue Share (%), by Country 2025 & 2033
- Figure 8: South America Optical Fiber Cable Trays Revenue (undefined), by Application 2025 & 2033
- Figure 9: South America Optical Fiber Cable Trays Revenue Share (%), by Application 2025 & 2033
- Figure 10: South America Optical Fiber Cable Trays Revenue (undefined), by Types 2025 & 2033
- Figure 11: South America Optical Fiber Cable Trays Revenue Share (%), by Types 2025 & 2033
- Figure 12: South America Optical Fiber Cable Trays Revenue (undefined), by Country 2025 & 2033
- Figure 13: South America Optical Fiber Cable Trays Revenue Share (%), by Country 2025 & 2033
- Figure 14: Europe Optical Fiber Cable Trays Revenue (undefined), by Application 2025 & 2033
- Figure 15: Europe Optical Fiber Cable Trays Revenue Share (%), by Application 2025 & 2033
- Figure 16: Europe Optical Fiber Cable Trays Revenue (undefined), by Types 2025 & 2033
- Figure 17: Europe Optical Fiber Cable Trays Revenue Share (%), by Types 2025 & 2033
- Figure 18: Europe Optical Fiber Cable Trays Revenue (undefined), by Country 2025 & 2033
- Figure 19: Europe Optical Fiber Cable Trays Revenue Share (%), by Country 2025 & 2033
- Figure 20: Middle East & Africa Optical Fiber Cable Trays Revenue (undefined), by Application 2025 & 2033
- Figure 21: Middle East & Africa Optical Fiber Cable Trays Revenue Share (%), by Application 2025 & 2033
- Figure 22: Middle East & Africa Optical Fiber Cable Trays Revenue (undefined), by Types 2025 & 2033
- Figure 23: Middle East & Africa Optical Fiber Cable Trays Revenue Share (%), by Types 2025 & 2033
- Figure 24: Middle East & Africa Optical Fiber Cable Trays Revenue (undefined), by Country 2025 & 2033
- Figure 25: Middle East & Africa Optical Fiber Cable Trays Revenue Share (%), by Country 2025 & 2033
- Figure 26: Asia Pacific Optical Fiber Cable Trays Revenue (undefined), by Application 2025 & 2033
- Figure 27: Asia Pacific Optical Fiber Cable Trays Revenue Share (%), by Application 2025 & 2033
- Figure 28: Asia Pacific Optical Fiber Cable Trays Revenue (undefined), by Types 2025 & 2033
- Figure 29: Asia Pacific Optical Fiber Cable Trays Revenue Share (%), by Types 2025 & 2033
- Figure 30: Asia Pacific Optical Fiber Cable Trays Revenue (undefined), by Country 2025 & 2033
- Figure 31: Asia Pacific Optical Fiber Cable Trays Revenue Share (%), by Country 2025 & 2033
List of Tables
- Table 1: Global Optical Fiber Cable Trays Revenue undefined Forecast, by Application 2020 & 2033
- Table 2: Global Optical Fiber Cable Trays Revenue undefined Forecast, by Types 2020 & 2033
- Table 3: Global Optical Fiber Cable Trays Revenue undefined Forecast, by Region 2020 & 2033
- Table 4: Global Optical Fiber Cable Trays Revenue undefined Forecast, by Application 2020 & 2033
- Table 5: Global Optical Fiber Cable Trays Revenue undefined Forecast, by Types 2020 & 2033
- Table 6: Global Optical Fiber Cable Trays Revenue undefined Forecast, by Country 2020 & 2033
- Table 7: United States Optical Fiber Cable Trays Revenue (undefined) Forecast, by Application 2020 & 2033
- Table 8: Canada Optical Fiber Cable Trays Revenue (undefined) Forecast, by Application 2020 & 2033
- Table 9: Mexico Optical Fiber Cable Trays Revenue (undefined) Forecast, by Application 2020 & 2033
- Table 10: Global Optical Fiber Cable Trays Revenue undefined Forecast, by Application 2020 & 2033
- Table 11: Global Optical Fiber Cable Trays Revenue undefined Forecast, by Types 2020 & 2033
- Table 12: Global Optical Fiber Cable Trays Revenue undefined Forecast, by Country 2020 & 2033
- Table 13: Brazil Optical Fiber Cable Trays Revenue (undefined) Forecast, by Application 2020 & 2033
- Table 14: Argentina Optical Fiber Cable Trays Revenue (undefined) Forecast, by Application 2020 & 2033
- Table 15: Rest of South America Optical Fiber Cable Trays Revenue (undefined) Forecast, by Application 2020 & 2033
- Table 16: Global Optical Fiber Cable Trays Revenue undefined Forecast, by Application 2020 & 2033
- Table 17: Global Optical Fiber Cable Trays Revenue undefined Forecast, by Types 2020 & 2033
- Table 18: Global Optical Fiber Cable Trays Revenue undefined Forecast, by Country 2020 & 2033
- Table 19: United Kingdom Optical Fiber Cable Trays Revenue (undefined) Forecast, by Application 2020 & 2033
- Table 20: Germany Optical Fiber Cable Trays Revenue (undefined) Forecast, by Application 2020 & 2033
- Table 21: France Optical Fiber Cable Trays Revenue (undefined) Forecast, by Application 2020 & 2033
- Table 22: Italy Optical Fiber Cable Trays Revenue (undefined) Forecast, by Application 2020 & 2033
- Table 23: Spain Optical Fiber Cable Trays Revenue (undefined) Forecast, by Application 2020 & 2033
- Table 24: Russia Optical Fiber Cable Trays Revenue (undefined) Forecast, by Application 2020 & 2033
- Table 25: Benelux Optical Fiber Cable Trays Revenue (undefined) Forecast, by Application 2020 & 2033
- Table 26: Nordics Optical Fiber Cable Trays Revenue (undefined) Forecast, by Application 2020 & 2033
- Table 27: Rest of Europe Optical Fiber Cable Trays Revenue (undefined) Forecast, by Application 2020 & 2033
- Table 28: Global Optical Fiber Cable Trays Revenue undefined Forecast, by Application 2020 & 2033
- Table 29: Global Optical Fiber Cable Trays Revenue undefined Forecast, by Types 2020 & 2033
- Table 30: Global Optical Fiber Cable Trays Revenue undefined Forecast, by Country 2020 & 2033
- Table 31: Turkey Optical Fiber Cable Trays Revenue (undefined) Forecast, by Application 2020 & 2033
- Table 32: Israel Optical Fiber Cable Trays Revenue (undefined) Forecast, by Application 2020 & 2033
- Table 33: GCC Optical Fiber Cable Trays Revenue (undefined) Forecast, by Application 2020 & 2033
- Table 34: North Africa Optical Fiber Cable Trays Revenue (undefined) Forecast, by Application 2020 & 2033
- Table 35: South Africa Optical Fiber Cable Trays Revenue (undefined) Forecast, by Application 2020 & 2033
- Table 36: Rest of Middle East & Africa Optical Fiber Cable Trays Revenue (undefined) Forecast, by Application 2020 & 2033
- Table 37: Global Optical Fiber Cable Trays Revenue undefined Forecast, by Application 2020 & 2033
- Table 38: Global Optical Fiber Cable Trays Revenue undefined Forecast, by Types 2020 & 2033
- Table 39: Global Optical Fiber Cable Trays Revenue undefined Forecast, by Country 2020 & 2033
- Table 40: China Optical Fiber Cable Trays Revenue (undefined) Forecast, by Application 2020 & 2033
- Table 41: India Optical Fiber Cable Trays Revenue (undefined) Forecast, by Application 2020 & 2033
- Table 42: Japan Optical Fiber Cable Trays Revenue (undefined) Forecast, by Application 2020 & 2033
- Table 43: South Korea Optical Fiber Cable Trays Revenue (undefined) Forecast, by Application 2020 & 2033
- Table 44: ASEAN Optical Fiber Cable Trays Revenue (undefined) Forecast, by Application 2020 & 2033
- Table 45: Oceania Optical Fiber Cable Trays Revenue (undefined) Forecast, by Application 2020 & 2033
- Table 46: Rest of Asia Pacific Optical Fiber Cable Trays Revenue (undefined) Forecast, by Application 2020 & 2033
Frequently Asked Questions
1. What is the projected Compound Annual Growth Rate (CAGR) of the Optical Fiber Cable Trays?
The projected CAGR is approximately 6.86%.
2. Which companies are prominent players in the Optical Fiber Cable Trays?
Key companies in the market include Legrand, Panduit, CommScope, Warren & Brown, Belden, Leviton, Rosenberger OSI, R&M (Reichle & De-Massari AG), Canovate, Eaton, Vericom Global Solutions, Fiber Tech Composite, Vichnet Technology, Ningbo Longxing Telecommunications, Ningbo Lepin, szzltx, Beijing Shuanglongsheng Cable Bridge Making, Yuhao Tongxin, Junhe Tongxin.
3. What are the main segments of the Optical Fiber Cable Trays?
The market segments include Application, Types.
4. Can you provide details about the market size?
The market size is estimated to be USD XXX N/A as of 2022.
5. What are some drivers contributing to market growth?
N/A
6. What are the notable trends driving market growth?
N/A
7. Are there any restraints impacting market growth?
N/A
8. Can you provide examples of recent developments in the market?
N/A
9. What pricing options are available for accessing the report?
Pricing options include single-user, multi-user, and enterprise licenses priced at USD 2900.00, USD 4350.00, and USD 5800.00 respectively.
10. Is the market size provided in terms of value or volume?
The market size is provided in terms of value, measured in N/A.
11. Are there any specific market keywords associated with the report?
Yes, the market keyword associated with the report is "Optical Fiber Cable Trays," which aids in identifying and referencing the specific market segment covered.
12. How do I determine which pricing option suits my needs best?
The pricing options vary based on user requirements and access needs. Individual users may opt for single-user licenses, while businesses requiring broader access may choose multi-user or enterprise licenses for cost-effective access to the report.
13. Are there any additional resources or data provided in the Optical Fiber Cable Trays report?
While the report offers comprehensive insights, it's advisable to review the specific contents or supplementary materials provided to ascertain if additional resources or data are available.
14. How can I stay updated on further developments or reports in the Optical Fiber Cable Trays?
To stay informed about further developments, trends, and reports in the Optical Fiber Cable Trays, consider subscribing to industry newsletters, following relevant companies and organizations, or regularly checking reputable industry news sources and publications.
Methodology
Step 1 - Identification of Relevant Samples Size from Population Database


Step 2 - Approaches for Defining Global Market Size (Value, Volume* & Price*)

Note*: In applicable scenarios
Step 3 - Data Sources
Primary Research
- Web Analytics
- Survey Reports
- Research Institute
- Latest Research Reports
- Opinion Leaders
Secondary Research
- Annual Reports
- White Paper
- Latest Press Release
- Industry Association
- Paid Database
- Investor Presentations

Step 4 - Data Triangulation
Involves using different sources of information in order to increase the validity of a study
These sources are likely to be stakeholders in a program - participants, other researchers, program staff, other community members, and so on.
Then we put all data in single framework & apply various statistical tools to find out the dynamic on the market.
During the analysis stage, feedback from the stakeholder groups would be compared to determine areas of agreement as well as areas of divergence