Key Insights
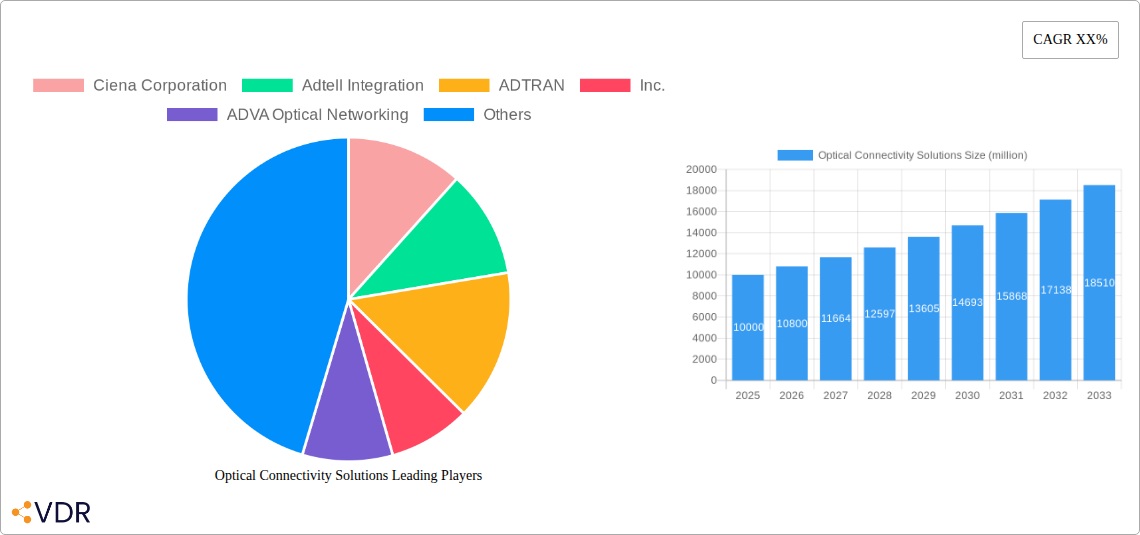
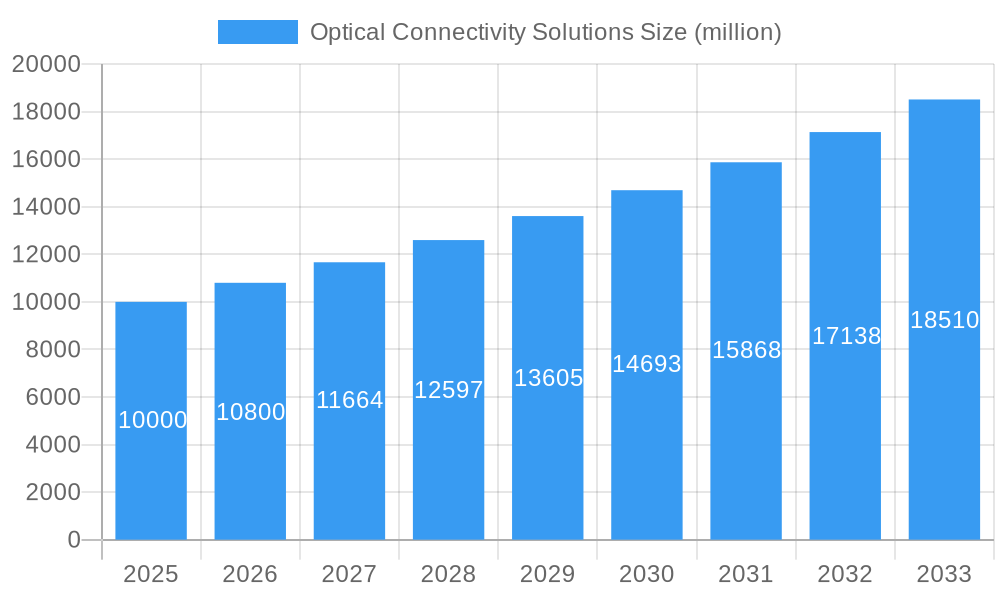
The global market for Optical Connectivity Solutions is experiencing robust expansion, driven by the escalating demand for high-speed data transmission and the increasing adoption of advanced technologies across various industries. Valued at approximately $10 billion in 2025, the market is projected to grow at a Compound Annual Growth Rate (CAGR) of around 8% over the forecast period from 2025 to 2033. This growth is propelled by critical drivers such as the burgeoning data centers, the rapid deployment of 5G networks, and the growing need for efficient bandwidth in sectors like telecommunications, cloud computing, and enterprise networks. The shift towards more powerful computing and storage solutions, coupled with the proliferation of Internet of Things (IoT) devices, further fuels the demand for reliable and high-capacity optical connectivity.
Optical Connectivity Solutions Market Size (In Billion)
Key trends shaping this market include the miniaturization of optical components, the development of pluggable optical transceivers, and the increasing integration of software-defined networking (SDN) and network function virtualization (NFV) with optical infrastructure. These advancements are enabling more agile and cost-effective network management. However, the market faces certain restraints, including the high cost of initial deployment for some advanced optical technologies and the complexity associated with integrating new solutions into existing legacy systems. Geographically, the Asia Pacific region is expected to witness the fastest growth due to significant investments in digital infrastructure, particularly in China and India. North America and Europe remain mature but substantial markets, driven by ongoing upgrades to existing networks and the demand from established enterprises and telecommunications providers. The Oil and Gas and Mining sectors are also showing increasing adoption of optical connectivity for enhanced operational efficiency and safety, contributing to market diversification.
Optical Connectivity Solutions Company Market Share
This in-depth market research report provides a granular analysis of the global Optical Connectivity Solutions market, a critical infrastructure segment enabling high-speed data transmission across diverse industries. With a meticulous study period from 2019–2033, a base year of 2025, and a forecast period from 2025–2033, this report offers unparalleled insights into market dynamics, growth trajectories, and future potential. Dive deep into the parent market for Telecommunications Infrastructure and the child markets of Fiber Optic Cables and Optical Transceivers, understanding their intricate relationships and contributions to the overarching optical connectivity landscape.
This report is essential for industry leaders, investors, policymakers, and technology providers seeking to navigate the complexities of the optical network solutions landscape, identify lucrative investment avenues, and formulate robust growth strategies.
Optical Connectivity Solutions Market Dynamics & Structure
The Optical Connectivity Solutions market exhibits a moderately concentrated structure, with a few key players dominating innovation and market share, while a larger number of specialized vendors cater to niche segments. Technological innovation remains the primary driver, fueled by the insatiable demand for higher bandwidth, lower latency, and enhanced network agility. Advancements in coherent optics, silicon photonics, and optical switching technologies are continuously pushing the boundaries of performance and efficiency. Regulatory frameworks, particularly those promoting digital transformation and 5G deployment, indirectly stimulate market growth by mandating robust infrastructure. Competitive product substitutes, primarily in the form of advanced copper cabling for shorter distances and emerging wireless technologies, pose a moderate threat, though optical solutions remain indispensable for long-haul and high-capacity applications. End-user demographics are shifting towards industries heavily reliant on data-intensive operations, including cloud computing, artificial intelligence, and the Internet of Things (IoT). Mergers and acquisitions (M&A) are a recurring theme, driven by the desire for market consolidation, technology acquisition, and expanded geographical reach.
- Market Concentration: Key players hold significant market share, estimated at 65% in 2025.
- Technological Innovation Drivers: Increasing data traffic, demand for 5G, AI/ML, and cloud adoption.
- Regulatory Frameworks: Government initiatives for digital infrastructure upgrades and broadband expansion.
- Competitive Product Substitutes: High-speed copper solutions (for short runs), advanced wireless technologies.
- End-User Demographics: Dominance of telecommunications, data centers, and enterprises.
- M&A Trends: Increased consolidation to gain economies of scale and technological expertise.
Optical Connectivity Solutions Growth Trends & Insights
The global Optical Connectivity Solutions market is poised for substantial expansion, driven by a confluence of factors that are fundamentally reshaping data transmission paradigms. The market size, estimated at $XX million in 2025, is projected to reach $YY million by 2033, exhibiting a Compound Annual Growth Rate (CAGR) of approximately XX% during the forecast period. This robust growth trajectory is underpinned by escalating data consumption, the relentless proliferation of connected devices, and the imperative for ultra-reliable, high-speed communication networks. The ongoing global rollout of 5G networks represents a significant catalyst, demanding substantial upgrades in fiber optic infrastructure to support increased bandwidth and reduced latency. Furthermore, the burgeoning growth of data centers, driven by cloud computing, big data analytics, and artificial intelligence (AI) workloads, necessitates advanced optical connectivity solutions to handle immense data volumes.
Adoption rates for high-speed optical technologies are accelerating across a broad spectrum of industries. The shift towards Software-Defined Networking (SDN) and Network Functions Virtualization (NFV) is also driving the demand for more agile and programmable optical solutions. Technological disruptions, such as the advancement of coherent optics for longer reach and higher data rates, and the integration of silicon photonics for more cost-effective and scalable transceiver modules, are redefining market capabilities. Consumer behavior is increasingly characterized by a demand for seamless, high-quality digital experiences, from immersive gaming and virtual reality to high-definition streaming and instantaneous cloud access, all of which are heavily reliant on robust optical connectivity. The penetration of fiber-to-the-home (FTTH) services continues to expand, bringing high-speed internet access to a wider population and fueling further demand for optical components and infrastructure. The increasing adoption of Ethernet and InfiniBand technologies in enterprise networks and high-performance computing environments further contributes to the market's upward momentum. The development of next-generation optical components, including tunable lasers and advanced modulators, will continue to drive performance improvements and cost efficiencies, thereby democratizing access to high-speed optical networks.
Dominant Regions, Countries, or Segments in Optical Connectivity Solutions
The Optical Connectivity Solutions market is witnessing dynamic growth across various regions and application segments. North America, particularly the United States, stands as a dominant force, driven by significant investments in advanced communication infrastructure, a mature telecommunications sector, and a high concentration of data centers supporting cloud computing and AI development. The country's proactive regulatory environment and substantial private sector investment in network upgrades are key accelerators. The continuous expansion of 5G networks and the increasing demand for high-speed broadband services for both residential and enterprise users further solidify North America's leading position.
In terms of application segments, the Electric Substation application is emerging as a critical driver for optical connectivity solutions. The modernization of power grids, the integration of renewable energy sources like wind power, and the increasing adoption of smart grid technologies necessitate robust, high-bandwidth, and reliable communication networks within substations. These networks are crucial for real-time monitoring, control, and data acquisition, enabling greater efficiency, stability, and security of the power supply. The Wind Power sector, in particular, is experiencing a surge in demand for reliable optical connectivity to manage distributed wind farms, transmit vast amounts of operational data, and facilitate remote monitoring and control systems.
The Hardware type segment within optical connectivity solutions commands a significant market share. This includes optical transceivers, fiber optic cables, connectors, splitters, and passive optical components, all of which are fundamental building blocks of any optical network. The increasing deployment of high-density data centers and the expansion of telecommunication networks are directly fueling the demand for these hardware components. The Oil and Gas sector, while traditionally reliant on robust and resilient infrastructure, is increasingly adopting optical solutions for enhanced safety, remote monitoring of exploration and production sites, and efficient data management. While Mining also benefits from improved connectivity for operational efficiency and safety, its current adoption pace for optical solutions is relatively lower compared to the aforementioned segments. The "Others" category, encompassing diverse industrial applications and research institutions, also contributes to the market's growth, albeit with varying adoption rates. The continuous evolution of optical hardware, characterized by miniaturization, increased speed, and reduced power consumption, further reinforces its dominance in the market.
Optical Connectivity Solutions Product Landscape
The product landscape for optical connectivity solutions is characterized by rapid innovation and a diverse range of offerings designed to meet evolving network demands. Key product categories include high-speed optical transceivers (e.g., 100GbE, 400GbE, 800GbE), essential for data center interconnects and telecommunications backbone networks. Advanced fiber optic cables, including single-mode and multi-mode fibers with enhanced transmission capabilities, are crucial for high-bandwidth applications. The market also features a wide array of passive optical components such as connectors, splitters, and multiplexers, critical for network infrastructure. Emerging product innovations focus on silicon photonics for cost-effective transceiver integration, coherent optics for extended reach and higher data rates, and optical switching solutions for enhanced network agility. These advancements are driving improvements in data transmission speeds, reducing latency, and increasing overall network efficiency, catering to the growing needs of industries like telecommunications, data centers, and enterprises.
Key Drivers, Barriers & Challenges in Optical Connectivity Solutions
Key Drivers: The optical connectivity solutions market is propelled by several key drivers: the exponential growth of data traffic driven by 5G, cloud computing, AI, and IoT; the ongoing digital transformation initiatives across industries; significant investments in telecom infrastructure upgrades and FTTH deployments; and the increasing demand for high-speed, low-latency networks in data centers and enterprise environments.
Barriers & Challenges: Despite strong growth, the market faces challenges such as the high initial cost of deployment for fiber optic infrastructure; supply chain constraints for critical components, particularly semiconductors; intense price competition among vendors; and the need for specialized skilled labor for installation and maintenance. Regulatory hurdles and standards fragmentation in certain regions can also pose challenges. The slow adoption in some traditional industries and the competition from advanced wireless technologies for specific use cases also present restraints. The impact of supply chain disruptions on component availability and lead times is a significant concern, potentially delaying project timelines and increasing costs.
Emerging Opportunities in Optical Connectivity Solutions
Emerging opportunities in the optical connectivity solutions sector are vast and span several key areas. The burgeoning growth of edge computing presents a significant opportunity for compact and high-performance optical modules. The increasing adoption of optical technologies in industrial automation, particularly in smart factories and Industry 4.0 initiatives, offers a growing market. The development of specialized optical solutions for emerging applications like autonomous vehicles and advanced healthcare monitoring also holds considerable promise. Furthermore, the drive towards more sustainable and energy-efficient data centers is creating demand for innovative optical solutions that reduce power consumption and improve thermal management. The expansion of optical networks into underserved rural areas and developing economies also represents a significant untapped market potential.
Growth Accelerators in the Optical Connectivity Solutions Industry
Several catalysts are accelerating long-term growth within the optical connectivity solutions industry. The continuous evolution of networking standards, such as the ongoing development towards 800GbE and beyond, ensures a sustained demand for next-generation optical components. Strategic partnerships between component manufacturers and network equipment providers are crucial for driving innovation and ensuring seamless integration of new technologies. The increasing adoption of modular and disaggregated network architectures favors vendors offering flexible and scalable optical solutions. Market expansion strategies targeting emerging economies and specific industry verticals, coupled with a focus on developing more cost-effective and power-efficient optical technologies, will further fuel sustained growth. The industry's ability to adapt to new technological paradigms, such as the integration of optical and electronic processing, will be a key differentiator.
Key Players Shaping the Optical Connectivity Solutions Market
- Ciena Corporation
- Adtell Integration
- ADTRAN, Inc.
- ADVA Optical Networking
- Broadcom, Inc.
- Cisco Systems, Inc.
- Finisar Corporation
- Fujitsu Optical Components Ltd.
- Hamamatsu Photonics
Notable Milestones in Optical Connectivity Solutions Sector
- 2019: Introduction of 400GbE technology into mainstream data center deployments.
- 2020: Significant advancements in silicon photonics enabling more cost-effective optical transceiver production.
- 2021: Increased M&A activity as larger players acquire specialized optical technology firms.
- 2022: Growing focus on optical solutions for 5G backhaul and fronthaul infrastructure.
- 2023: Emergence of co-packaged optics as a potential future architecture for high-density computing.
- 2024: Advancements in coherent optics paving the way for even higher data rates over longer distances.
In-Depth Optical Connectivity Solutions Market Outlook
The future outlook for the optical connectivity solutions market is exceptionally strong, driven by sustained demand for higher bandwidth and lower latency across a multitude of applications. Growth accelerators, including ongoing 5G rollouts, the relentless expansion of data centers, and the increasing adoption of AI and cloud technologies, will continue to shape market dynamics. Strategic opportunities lie in serving emerging markets, developing innovative solutions for edge computing and industrial automation, and contributing to the sustainability goals of the digital infrastructure. The industry's capacity to innovate and adapt to technological shifts, such as the advancements in silicon photonics and coherent optics, will be paramount in meeting future connectivity demands and ensuring its continued expansion.
Optical Connectivity Solutions Segmentation
-
1. Application
- 1.1. Mining
- 1.2. Oil and Gas
- 1.3. Wind Power
- 1.4. Electric Substation
- 1.5. Others
-
2. Types
- 2.1. Harsware
- 2.2. Software
Optical Connectivity Solutions Segmentation By Geography
-
1. North America
- 1.1. United States
- 1.2. Canada
- 1.3. Mexico
-
2. South America
- 2.1. Brazil
- 2.2. Argentina
- 2.3. Rest of South America
-
3. Europe
- 3.1. United Kingdom
- 3.2. Germany
- 3.3. France
- 3.4. Italy
- 3.5. Spain
- 3.6. Russia
- 3.7. Benelux
- 3.8. Nordics
- 3.9. Rest of Europe
-
4. Middle East & Africa
- 4.1. Turkey
- 4.2. Israel
- 4.3. GCC
- 4.4. North Africa
- 4.5. South Africa
- 4.6. Rest of Middle East & Africa
-
5. Asia Pacific
- 5.1. China
- 5.2. India
- 5.3. Japan
- 5.4. South Korea
- 5.5. ASEAN
- 5.6. Oceania
- 5.7. Rest of Asia Pacific
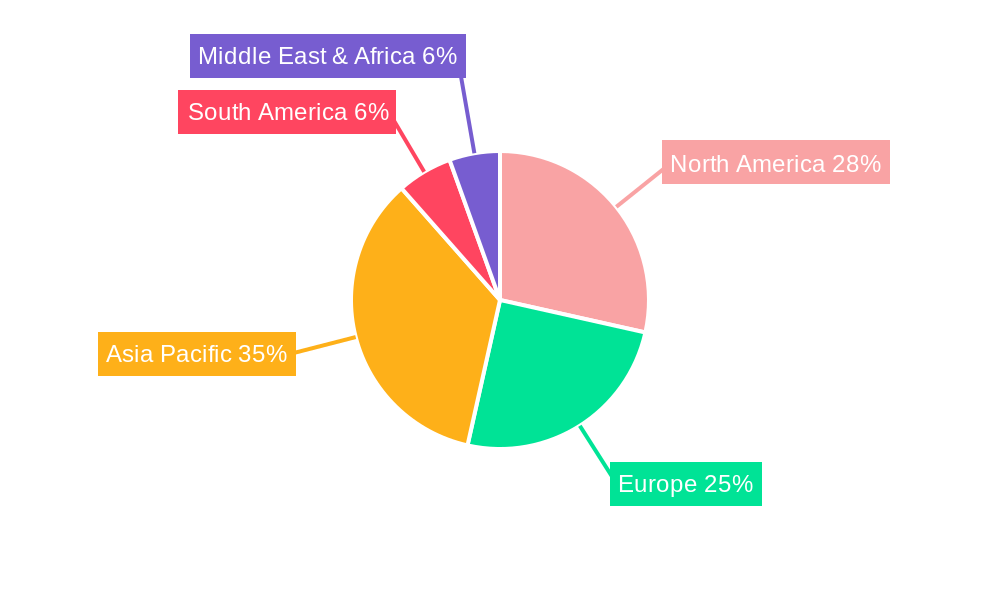
Optical Connectivity Solutions Regional Market Share
Geographic Coverage of Optical Connectivity Solutions
Optical Connectivity Solutions REPORT HIGHLIGHTS
| Aspects | Details |
|---|---|
| Study Period | 2020-2034 |
| Base Year | 2025 |
| Estimated Year | 2026 |
| Forecast Period | 2026-2034 |
| Historical Period | 2020-2025 |
| Growth Rate | CAGR of XX% from 2020-2034 |
| Segmentation |
|
Table of Contents
- 1. Introduction
- 1.1. Research Scope
- 1.2. Market Segmentation
- 1.3. Research Objective
- 1.4. Definitions and Assumptions
- 2. Executive Summary
- 2.1. Market Snapshot
- 3. Market Dynamics
- 3.1. Market Drivers
- 3.2. Market Restrains
- 3.3. Market Trends
- 3.4. Market Opportunities
- 4. Market Factor Analysis
- 4.1. Porters Five Forces
- 4.1.1. Bargaining Power of Suppliers
- 4.1.2. Bargaining Power of Buyers
- 4.1.3. Threat of New Entrants
- 4.1.4. Threat of Substitutes
- 4.1.5. Competitive Rivalry
- 4.2. PESTEL analysis
- 4.3. BCG Analysis
- 4.3.1. Stars (High Growth, High Market Share)
- 4.3.2. Cash Cows (Low Growth, High Market Share)
- 4.3.3. Question Mark (High Growth, Low Market Share)
- 4.3.4. Dogs (Low Growth, Low Market Share)
- 4.4. Ansoff Matrix Analysis
- 4.5. Supply Chain Analysis
- 4.6. Regulatory Landscape
- 4.7. Current Market Potential and Opportunity Assessment (TAM–SAM–SOM Framework)
- 4.8. VDR Analyst Note
- 4.1. Porters Five Forces
- 5. Market Analysis, Insights and Forecast 2021-2033
- 5.1. Market Analysis, Insights and Forecast - by Application
- 5.1.1. Mining
- 5.1.2. Oil and Gas
- 5.1.3. Wind Power
- 5.1.4. Electric Substation
- 5.1.5. Others
- 5.2. Market Analysis, Insights and Forecast - by Types
- 5.2.1. Harsware
- 5.2.2. Software
- 5.3. Market Analysis, Insights and Forecast - by Region
- 5.3.1. North America
- 5.3.2. South America
- 5.3.3. Europe
- 5.3.4. Middle East & Africa
- 5.3.5. Asia Pacific
- 5.1. Market Analysis, Insights and Forecast - by Application
- 6. Global Optical Connectivity Solutions Analysis, Insights and Forecast, 2021-2033
- 6.1. Market Analysis, Insights and Forecast - by Application
- 6.1.1. Mining
- 6.1.2. Oil and Gas
- 6.1.3. Wind Power
- 6.1.4. Electric Substation
- 6.1.5. Others
- 6.2. Market Analysis, Insights and Forecast - by Types
- 6.2.1. Harsware
- 6.2.2. Software
- 6.1. Market Analysis, Insights and Forecast - by Application
- 7. North America Optical Connectivity Solutions Analysis, Insights and Forecast, 2021-2033
- 7.1. Market Analysis, Insights and Forecast - by Application
- 7.1.1. Mining
- 7.1.2. Oil and Gas
- 7.1.3. Wind Power
- 7.1.4. Electric Substation
- 7.1.5. Others
- 7.2. Market Analysis, Insights and Forecast - by Types
- 7.2.1. Harsware
- 7.2.2. Software
- 7.1. Market Analysis, Insights and Forecast - by Application
- 8. South America Optical Connectivity Solutions Analysis, Insights and Forecast, 2021-2033
- 8.1. Market Analysis, Insights and Forecast - by Application
- 8.1.1. Mining
- 8.1.2. Oil and Gas
- 8.1.3. Wind Power
- 8.1.4. Electric Substation
- 8.1.5. Others
- 8.2. Market Analysis, Insights and Forecast - by Types
- 8.2.1. Harsware
- 8.2.2. Software
- 8.1. Market Analysis, Insights and Forecast - by Application
- 9. Europe Optical Connectivity Solutions Analysis, Insights and Forecast, 2021-2033
- 9.1. Market Analysis, Insights and Forecast - by Application
- 9.1.1. Mining
- 9.1.2. Oil and Gas
- 9.1.3. Wind Power
- 9.1.4. Electric Substation
- 9.1.5. Others
- 9.2. Market Analysis, Insights and Forecast - by Types
- 9.2.1. Harsware
- 9.2.2. Software
- 9.1. Market Analysis, Insights and Forecast - by Application
- 10. Middle East & Africa Optical Connectivity Solutions Analysis, Insights and Forecast, 2021-2033
- 10.1. Market Analysis, Insights and Forecast - by Application
- 10.1.1. Mining
- 10.1.2. Oil and Gas
- 10.1.3. Wind Power
- 10.1.4. Electric Substation
- 10.1.5. Others
- 10.2. Market Analysis, Insights and Forecast - by Types
- 10.2.1. Harsware
- 10.2.2. Software
- 10.1. Market Analysis, Insights and Forecast - by Application
- 11. Asia Pacific Optical Connectivity Solutions Analysis, Insights and Forecast, 2021-2033
- 11.1. Market Analysis, Insights and Forecast - by Application
- 11.1.1. Mining
- 11.1.2. Oil and Gas
- 11.1.3. Wind Power
- 11.1.4. Electric Substation
- 11.1.5. Others
- 11.2. Market Analysis, Insights and Forecast - by Types
- 11.2.1. Harsware
- 11.2.2. Software
- 11.1. Market Analysis, Insights and Forecast - by Application
- 12. Competitive Analysis
- 12.1. Company Profiles
- 12.1.1 Ciena Corporation
- 12.1.1.1. Company Overview
- 12.1.1.2. Products
- 12.1.1.3. Company Financials
- 12.1.1.4. SWOT Analysis
- 12.1.2 Adtell Integration
- 12.1.2.1. Company Overview
- 12.1.2.2. Products
- 12.1.2.3. Company Financials
- 12.1.2.4. SWOT Analysis
- 12.1.3 ADTRAN
- 12.1.3.1. Company Overview
- 12.1.3.2. Products
- 12.1.3.3. Company Financials
- 12.1.3.4. SWOT Analysis
- 12.1.4 Inc.
- 12.1.4.1. Company Overview
- 12.1.4.2. Products
- 12.1.4.3. Company Financials
- 12.1.4.4. SWOT Analysis
- 12.1.5 ADVA Optical Networking
- 12.1.5.1. Company Overview
- 12.1.5.2. Products
- 12.1.5.3. Company Financials
- 12.1.5.4. SWOT Analysis
- 12.1.6 Broadcom
- 12.1.6.1. Company Overview
- 12.1.6.2. Products
- 12.1.6.3. Company Financials
- 12.1.6.4. SWOT Analysis
- 12.1.7 Inc.
- 12.1.7.1. Company Overview
- 12.1.7.2. Products
- 12.1.7.3. Company Financials
- 12.1.7.4. SWOT Analysis
- 12.1.8 Cisco Systems
- 12.1.8.1. Company Overview
- 12.1.8.2. Products
- 12.1.8.3. Company Financials
- 12.1.8.4. SWOT Analysis
- 12.1.9 Inc.
- 12.1.9.1. Company Overview
- 12.1.9.2. Products
- 12.1.9.3. Company Financials
- 12.1.9.4. SWOT Analysis
- 12.1.10 Finisar Corporation
- 12.1.10.1. Company Overview
- 12.1.10.2. Products
- 12.1.10.3. Company Financials
- 12.1.10.4. SWOT Analysis
- 12.1.11 Fujitsu Optical Components Ltd.
- 12.1.11.1. Company Overview
- 12.1.11.2. Products
- 12.1.11.3. Company Financials
- 12.1.11.4. SWOT Analysis
- 12.1.12 Hamamatsu Photonics
- 12.1.12.1. Company Overview
- 12.1.12.2. Products
- 12.1.12.3. Company Financials
- 12.1.12.4. SWOT Analysis
- 12.1.1 Ciena Corporation
- 12.2. Market Entropy
- 12.2.1 Company's Key Areas Served
- 12.2.2 Recent Developments
- 12.3. Company Market Share Analysis 2025
- 12.3.1 Top 5 Companies Market Share Analysis
- 12.3.2 Top 3 Companies Market Share Analysis
- 12.4. List of Potential Customers
- 13. Research Methodology
List of Figures
- Figure 1: Global Optical Connectivity Solutions Revenue Breakdown (million, %) by Region 2025 & 2033
- Figure 2: North America Optical Connectivity Solutions Revenue (million), by Application 2025 & 2033
- Figure 3: North America Optical Connectivity Solutions Revenue Share (%), by Application 2025 & 2033
- Figure 4: North America Optical Connectivity Solutions Revenue (million), by Types 2025 & 2033
- Figure 5: North America Optical Connectivity Solutions Revenue Share (%), by Types 2025 & 2033
- Figure 6: North America Optical Connectivity Solutions Revenue (million), by Country 2025 & 2033
- Figure 7: North America Optical Connectivity Solutions Revenue Share (%), by Country 2025 & 2033
- Figure 8: South America Optical Connectivity Solutions Revenue (million), by Application 2025 & 2033
- Figure 9: South America Optical Connectivity Solutions Revenue Share (%), by Application 2025 & 2033
- Figure 10: South America Optical Connectivity Solutions Revenue (million), by Types 2025 & 2033
- Figure 11: South America Optical Connectivity Solutions Revenue Share (%), by Types 2025 & 2033
- Figure 12: South America Optical Connectivity Solutions Revenue (million), by Country 2025 & 2033
- Figure 13: South America Optical Connectivity Solutions Revenue Share (%), by Country 2025 & 2033
- Figure 14: Europe Optical Connectivity Solutions Revenue (million), by Application 2025 & 2033
- Figure 15: Europe Optical Connectivity Solutions Revenue Share (%), by Application 2025 & 2033
- Figure 16: Europe Optical Connectivity Solutions Revenue (million), by Types 2025 & 2033
- Figure 17: Europe Optical Connectivity Solutions Revenue Share (%), by Types 2025 & 2033
- Figure 18: Europe Optical Connectivity Solutions Revenue (million), by Country 2025 & 2033
- Figure 19: Europe Optical Connectivity Solutions Revenue Share (%), by Country 2025 & 2033
- Figure 20: Middle East & Africa Optical Connectivity Solutions Revenue (million), by Application 2025 & 2033
- Figure 21: Middle East & Africa Optical Connectivity Solutions Revenue Share (%), by Application 2025 & 2033
- Figure 22: Middle East & Africa Optical Connectivity Solutions Revenue (million), by Types 2025 & 2033
- Figure 23: Middle East & Africa Optical Connectivity Solutions Revenue Share (%), by Types 2025 & 2033
- Figure 24: Middle East & Africa Optical Connectivity Solutions Revenue (million), by Country 2025 & 2033
- Figure 25: Middle East & Africa Optical Connectivity Solutions Revenue Share (%), by Country 2025 & 2033
- Figure 26: Asia Pacific Optical Connectivity Solutions Revenue (million), by Application 2025 & 2033
- Figure 27: Asia Pacific Optical Connectivity Solutions Revenue Share (%), by Application 2025 & 2033
- Figure 28: Asia Pacific Optical Connectivity Solutions Revenue (million), by Types 2025 & 2033
- Figure 29: Asia Pacific Optical Connectivity Solutions Revenue Share (%), by Types 2025 & 2033
- Figure 30: Asia Pacific Optical Connectivity Solutions Revenue (million), by Country 2025 & 2033
- Figure 31: Asia Pacific Optical Connectivity Solutions Revenue Share (%), by Country 2025 & 2033
List of Tables
- Table 1: Global Optical Connectivity Solutions Revenue million Forecast, by Application 2020 & 2033
- Table 2: Global Optical Connectivity Solutions Revenue million Forecast, by Types 2020 & 2033
- Table 3: Global Optical Connectivity Solutions Revenue million Forecast, by Region 2020 & 2033
- Table 4: Global Optical Connectivity Solutions Revenue million Forecast, by Application 2020 & 2033
- Table 5: Global Optical Connectivity Solutions Revenue million Forecast, by Types 2020 & 2033
- Table 6: Global Optical Connectivity Solutions Revenue million Forecast, by Country 2020 & 2033
- Table 7: United States Optical Connectivity Solutions Revenue (million) Forecast, by Application 2020 & 2033
- Table 8: Canada Optical Connectivity Solutions Revenue (million) Forecast, by Application 2020 & 2033
- Table 9: Mexico Optical Connectivity Solutions Revenue (million) Forecast, by Application 2020 & 2033
- Table 10: Global Optical Connectivity Solutions Revenue million Forecast, by Application 2020 & 2033
- Table 11: Global Optical Connectivity Solutions Revenue million Forecast, by Types 2020 & 2033
- Table 12: Global Optical Connectivity Solutions Revenue million Forecast, by Country 2020 & 2033
- Table 13: Brazil Optical Connectivity Solutions Revenue (million) Forecast, by Application 2020 & 2033
- Table 14: Argentina Optical Connectivity Solutions Revenue (million) Forecast, by Application 2020 & 2033
- Table 15: Rest of South America Optical Connectivity Solutions Revenue (million) Forecast, by Application 2020 & 2033
- Table 16: Global Optical Connectivity Solutions Revenue million Forecast, by Application 2020 & 2033
- Table 17: Global Optical Connectivity Solutions Revenue million Forecast, by Types 2020 & 2033
- Table 18: Global Optical Connectivity Solutions Revenue million Forecast, by Country 2020 & 2033
- Table 19: United Kingdom Optical Connectivity Solutions Revenue (million) Forecast, by Application 2020 & 2033
- Table 20: Germany Optical Connectivity Solutions Revenue (million) Forecast, by Application 2020 & 2033
- Table 21: France Optical Connectivity Solutions Revenue (million) Forecast, by Application 2020 & 2033
- Table 22: Italy Optical Connectivity Solutions Revenue (million) Forecast, by Application 2020 & 2033
- Table 23: Spain Optical Connectivity Solutions Revenue (million) Forecast, by Application 2020 & 2033
- Table 24: Russia Optical Connectivity Solutions Revenue (million) Forecast, by Application 2020 & 2033
- Table 25: Benelux Optical Connectivity Solutions Revenue (million) Forecast, by Application 2020 & 2033
- Table 26: Nordics Optical Connectivity Solutions Revenue (million) Forecast, by Application 2020 & 2033
- Table 27: Rest of Europe Optical Connectivity Solutions Revenue (million) Forecast, by Application 2020 & 2033
- Table 28: Global Optical Connectivity Solutions Revenue million Forecast, by Application 2020 & 2033
- Table 29: Global Optical Connectivity Solutions Revenue million Forecast, by Types 2020 & 2033
- Table 30: Global Optical Connectivity Solutions Revenue million Forecast, by Country 2020 & 2033
- Table 31: Turkey Optical Connectivity Solutions Revenue (million) Forecast, by Application 2020 & 2033
- Table 32: Israel Optical Connectivity Solutions Revenue (million) Forecast, by Application 2020 & 2033
- Table 33: GCC Optical Connectivity Solutions Revenue (million) Forecast, by Application 2020 & 2033
- Table 34: North Africa Optical Connectivity Solutions Revenue (million) Forecast, by Application 2020 & 2033
- Table 35: South Africa Optical Connectivity Solutions Revenue (million) Forecast, by Application 2020 & 2033
- Table 36: Rest of Middle East & Africa Optical Connectivity Solutions Revenue (million) Forecast, by Application 2020 & 2033
- Table 37: Global Optical Connectivity Solutions Revenue million Forecast, by Application 2020 & 2033
- Table 38: Global Optical Connectivity Solutions Revenue million Forecast, by Types 2020 & 2033
- Table 39: Global Optical Connectivity Solutions Revenue million Forecast, by Country 2020 & 2033
- Table 40: China Optical Connectivity Solutions Revenue (million) Forecast, by Application 2020 & 2033
- Table 41: India Optical Connectivity Solutions Revenue (million) Forecast, by Application 2020 & 2033
- Table 42: Japan Optical Connectivity Solutions Revenue (million) Forecast, by Application 2020 & 2033
- Table 43: South Korea Optical Connectivity Solutions Revenue (million) Forecast, by Application 2020 & 2033
- Table 44: ASEAN Optical Connectivity Solutions Revenue (million) Forecast, by Application 2020 & 2033
- Table 45: Oceania Optical Connectivity Solutions Revenue (million) Forecast, by Application 2020 & 2033
- Table 46: Rest of Asia Pacific Optical Connectivity Solutions Revenue (million) Forecast, by Application 2020 & 2033
Frequently Asked Questions
1. What is the projected Compound Annual Growth Rate (CAGR) of the Optical Connectivity Solutions?
The projected CAGR is approximately XX%.
2. Which companies are prominent players in the Optical Connectivity Solutions?
Key companies in the market include Ciena Corporation, Adtell Integration, ADTRAN, Inc., ADVA Optical Networking, Broadcom, Inc., Cisco Systems, Inc., Finisar Corporation, Fujitsu Optical Components Ltd., Hamamatsu Photonics.
3. What are the main segments of the Optical Connectivity Solutions?
The market segments include Application, Types.
4. Can you provide details about the market size?
The market size is estimated to be USD XXX million as of 2022.
5. What are some drivers contributing to market growth?
N/A
6. What are the notable trends driving market growth?
N/A
7. Are there any restraints impacting market growth?
N/A
8. Can you provide examples of recent developments in the market?
N/A
9. What pricing options are available for accessing the report?
Pricing options include single-user, multi-user, and enterprise licenses priced at USD 2900.00, USD 4350.00, and USD 5800.00 respectively.
10. Is the market size provided in terms of value or volume?
The market size is provided in terms of value, measured in million.
11. Are there any specific market keywords associated with the report?
Yes, the market keyword associated with the report is "Optical Connectivity Solutions," which aids in identifying and referencing the specific market segment covered.
12. How do I determine which pricing option suits my needs best?
The pricing options vary based on user requirements and access needs. Individual users may opt for single-user licenses, while businesses requiring broader access may choose multi-user or enterprise licenses for cost-effective access to the report.
13. Are there any additional resources or data provided in the Optical Connectivity Solutions report?
While the report offers comprehensive insights, it's advisable to review the specific contents or supplementary materials provided to ascertain if additional resources or data are available.
14. How can I stay updated on further developments or reports in the Optical Connectivity Solutions?
To stay informed about further developments, trends, and reports in the Optical Connectivity Solutions, consider subscribing to industry newsletters, following relevant companies and organizations, or regularly checking reputable industry news sources and publications.
Methodology
Step 1 - Identification of Relevant Samples Size from Population Database


Step 2 - Approaches for Defining Global Market Size (Value, Volume* & Price*)

Note*: In applicable scenarios
Step 3 - Data Sources
Primary Research
- Web Analytics
- Survey Reports
- Research Institute
- Latest Research Reports
- Opinion Leaders
Secondary Research
- Annual Reports
- White Paper
- Latest Press Release
- Industry Association
- Paid Database
- Investor Presentations

Step 4 - Data Triangulation
Involves using different sources of information in order to increase the validity of a study
These sources are likely to be stakeholders in a program - participants, other researchers, program staff, other community members, and so on.
Then we put all data in single framework & apply various statistical tools to find out the dynamic on the market.
During the analysis stage, feedback from the stakeholder groups would be compared to determine areas of agreement as well as areas of divergence

