
Key Insights
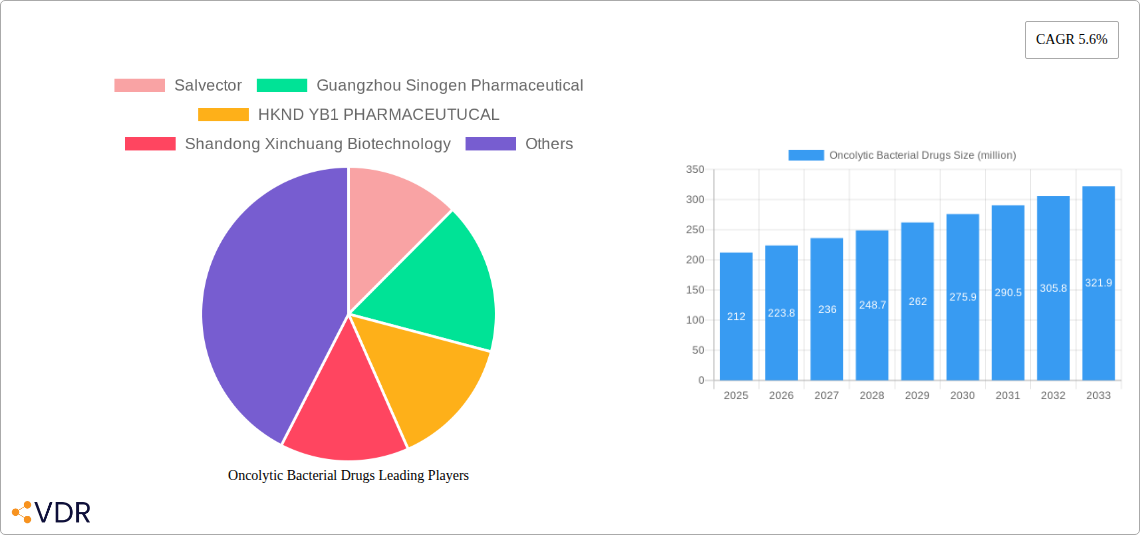
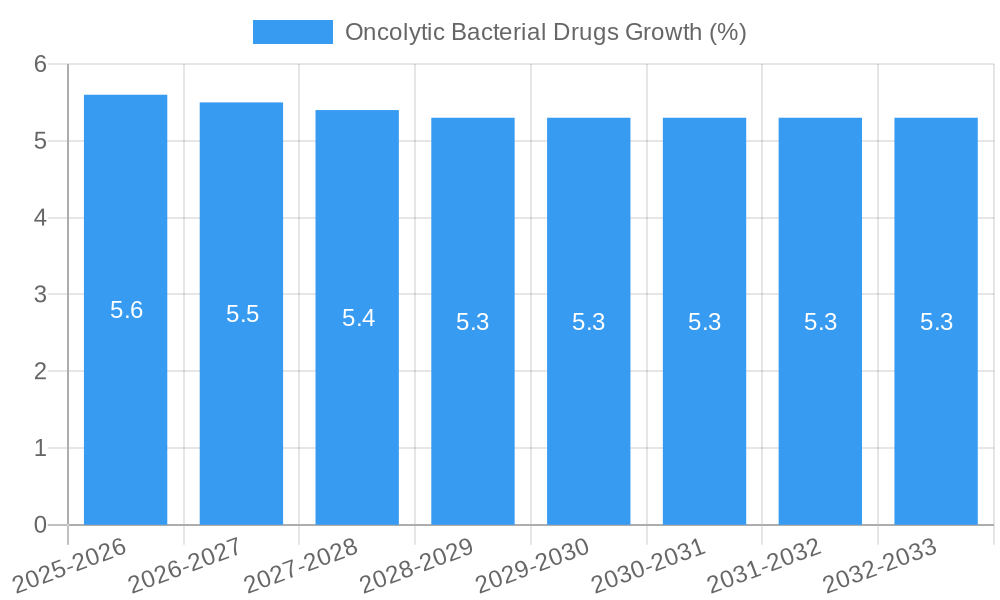
The global Oncolytic Bacterial Drugs market is poised for significant expansion, projected to reach an estimated market size of $212 million by 2025, with a robust Compound Annual Growth Rate (CAGR) of 5.6% expected to sustain this trajectory through 2033. This growth is primarily fueled by advancements in precision medicine and the increasing demand for targeted cancer therapies that offer improved efficacy and reduced side effects compared to traditional treatments. The development of novel bacterial strains engineered to selectively target and destroy cancer cells, while stimulating the host's immune system, is a key driver. Furthermore, a growing understanding of the tumor microenvironment and the potential of bacteria to colonize and proliferate within tumors is opening new avenues for therapeutic development. The rising incidence of various cancers globally also contributes to the market's upward trend.
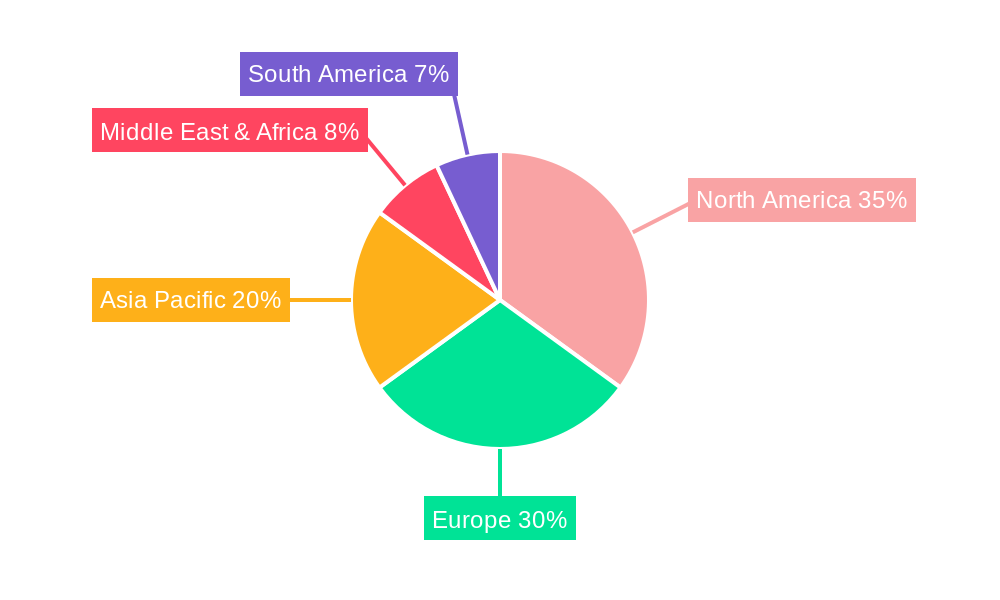
The market segmentation reveals a strong focus on applications within hospitals and clinics, reflecting the clinical settings where these advanced therapies are likely to be administered. Both intratumoral and intravenous injection methods are critical for drug delivery, with ongoing research aimed at optimizing these techniques for maximum therapeutic benefit and patient convenience. Key players in this dynamic market include Salvector, Guangzhou Sinogen Pharmaceutical, HKND YB1 PHARMACEUTUCAL, and Shandong Xinchuang Biotechnology, who are actively engaged in research, development, and clinical trials. Geographically, North America and Europe are expected to lead market share due to advanced healthcare infrastructure, substantial R&D investments, and favorable regulatory environments for innovative therapies. The Asia Pacific region, particularly China and India, is anticipated to witness rapid growth driven by a large patient pool, increasing healthcare expenditure, and a burgeoning biopharmaceutical industry. Restraints, such as the complex regulatory pathways for live bacterial therapies and the need for robust clinical validation, are being addressed through collaborative efforts and innovative trial designs.
Comprehensive Report on the Global Oncolytic Bacterial Drugs Market: Forecast 2025-2033
This in-depth market research report offers a detailed analysis of the global oncolytic bacterial drugs market, providing critical insights into its dynamics, growth trajectory, and future potential. Covering the period from 2019 to 2033, with a base year of 2025 and a forecast period of 2025–2033, this report is an essential resource for stakeholders seeking to understand and capitalize on this rapidly evolving sector of cancer therapeutics. We delve into parent and child market segments, analyze market concentration, technological innovations, regulatory frameworks, competitive landscapes, and emerging opportunities, presenting quantitative data and qualitative assessments to inform strategic decision-making.
Oncolytic Bacterial Drugs Market Dynamics & Structure
The oncolytic bacterial drugs market is characterized by a moderate concentration, with a handful of key players actively investing in research and development. Technological innovation is a primary driver, fueled by advancements in genetic engineering and drug delivery systems that enhance bacterial targeting and efficacy. Regulatory frameworks, though still evolving, are becoming more defined, impacting the pace of new drug approvals. Competitive product substitutes include other forms of oncolytic virotherapy, immunotherapy, and conventional cancer treatments, necessitating a clear demonstration of therapeutic advantage. End-user demographics primarily consist of oncologists and research institutions within hospitals and specialized clinics. Merger and acquisition (M&A) trends are observed as companies seek to acquire promising technologies and expand their portfolios, with an estimated xx million units in deal volumes historically. The innovation barriers include the inherent complexity of biological systems, potential for off-target effects, and the need for extensive clinical validation.
- Market Concentration: Moderate, with a growing number of innovative startups entering the space.
- Technological Innovation Drivers:
- Genetic modification for enhanced tumor selectivity.
- Improved delivery mechanisms to overcome biological barriers.
- Development of combination therapies.
- Regulatory Frameworks: Evolving FDA and EMA guidelines for gene and cell therapies are influencing development pathways.
- Competitive Product Substitutes: Oncolytic viruses, CAR-T therapies, checkpoint inhibitors.
- End-User Demographics: Hospitals (60% of adoption), Clinics (30%), Others (research institutions, academic centers - 10%).
- M&A Trends: Strategic acquisitions of early-stage companies with promising drug candidates.
- Innovation Barriers: High R&D costs, long clinical trial durations, potential immune responses.
Oncolytic Bacterial Drugs Growth Trends & Insights
The global oncolytic bacterial drugs market is poised for significant expansion, driven by a growing unmet need for novel cancer therapies and increasing recognition of their therapeutic potential. The market size is projected to witness a robust Compound Annual Growth Rate (CAGR) of xx% from 2025 to 2033, reaching an estimated xx million units by the end of the forecast period. Historical data from 2019-2024 indicates a steady upward trend in research funding and preclinical successes, laying a strong foundation for future commercialization. Adoption rates, though currently nascent for widespread clinical use, are expected to accelerate as more drugs gain regulatory approval and demonstrate favorable clinical outcomes. Technological disruptions, such as the development of attenuated bacterial strains with enhanced tumor-homing capabilities and the integration of imaging and diagnostic tools, are revolutionizing treatment approaches. Consumer behavior shifts are also playing a crucial role, with patients and physicians increasingly seeking personalized and less toxic cancer treatment options. The market penetration is anticipated to increase from xx% in 2025 to xx% by 2033. Furthermore, the development of genetically engineered bacteria capable of expressing therapeutic payloads, such as cytokines and immunostimulatory agents, is expanding the therapeutic applications beyond direct tumor lysis. The focus on improving the safety profile and managing potential side effects associated with bacterial therapies is also a key area of ongoing research and development. The growing understanding of the tumor microenvironment and the intricate interactions between bacteria and the host immune system are unlocking new avenues for therapeutic intervention, making oncolytic bacterial drugs a promising frontier in oncology.
Dominant Regions, Countries, or Segments in Oncolytic Bacterial Drugs
The Hospital application segment is projected to be the dominant force driving growth in the global oncolytic bacterial drugs market, accounting for an estimated 60% of market share in 2025 and expected to maintain its lead throughout the forecast period. This dominance stems from the established infrastructure and specialized expertise present in hospital settings, which are crucial for administering complex biological therapies and managing patient care during treatment. The Intratumoral Injection type of administration is expected to hold the largest share, driven by its targeted delivery approach, which minimizes systemic exposure and potentially reduces side effects.
- Leading Segment by Application: Hospitals, due to their comprehensive cancer treatment facilities and expert medical teams.
- Market Share (2025): ~60%
- Growth Potential: High, driven by increasing adoption of novel therapies.
- Key Drivers: Availability of specialized oncology departments, advanced medical technology, and physician training.
- Leading Segment by Type: Intratumoral Injection, offering precise tumor targeting and potentially improved efficacy.
- Market Share (2025): ~55%
- Growth Potential: Robust, as it aligns with precision medicine approaches.
- Key Drivers: Reduced systemic toxicity, direct impact on tumor microenvironment, development of advanced delivery systems.
- Dominant Regions: North America and Europe are expected to lead the market, driven by strong R&D investments, supportive regulatory environments, and a high prevalence of cancer.
- North America Market Share (2025): ~35%
- Europe Market Share (2025): ~30%
- Key Drivers: Robust pharmaceutical industry, government funding for cancer research, established healthcare systems, and a large patient pool.
- Country-Specific Dominance: The United States and Germany are anticipated to be key market players within their respective regions, characterized by leading research institutions and pharmaceutical companies.
- United States Market Share (2025): ~25%
- Germany Market Share (2025): ~15%
- Key Drivers: Advanced clinical trial infrastructure, favorable reimbursement policies, and a high rate of technological adoption.
Oncolytic Bacterial Drugs Product Landscape
The product landscape for oncolytic bacterial drugs is characterized by continuous innovation in engineered bacterial strains designed for enhanced tumor targeting and payload delivery. Key products leverage attenuated bacteria, such as Listeria monocytogenes and Salmonella Typhimurium, genetically modified to express immunomodulatory proteins or cytotoxic agents directly within the tumor microenvironment. Performance metrics are being rigorously assessed through clinical trials, focusing on objective response rates, duration of response, and overall survival. Unique selling propositions include their potential for self-replication at the tumor site, selective accumulation in hypoxic tumor regions, and their ability to stimulate a robust anti-tumor immune response. Technological advancements are focused on improving bacterial persistence, reducing immunogenicity, and developing companion diagnostics for patient stratification.
Key Drivers, Barriers & Challenges in Oncolytic Bacterial Drugs
Key Drivers:
- Unmet Medical Needs: The persistent demand for more effective and less toxic cancer treatments.
- Technological Advancements: Progress in genetic engineering and synthetic biology enabling sophisticated bacterial designs.
- Immune System Modulation: Potential to stimulate a potent and lasting anti-tumor immune response.
- Targeted Delivery: Ability of bacteria to selectively colonize and replicate within tumor tissues.
- Investments in R&D: Significant funding from pharmaceutical companies and venture capitalists.
Key Barriers & Challenges:
- Safety Concerns: Potential for off-target toxicity, bacterial infections, and immune-related adverse events.
- Regulatory Hurdles: Complex and evolving regulatory pathways for live bacterial therapeutics.
- Manufacturing and Scalability: Challenges in consistently producing high-quality, sterile biological products at scale.
- Patient Compliance and Administration: Need for specialized administration protocols and skilled healthcare professionals.
- Immunogenicity: Potential for the host immune system to clear the bacteria before they can exert their therapeutic effect.
- Competitive Landscape: Competition from established cancer therapies and other oncolytic modalities.
- Supply Chain Complexity: Maintaining the viability and integrity of live bacterial products throughout the supply chain.
- Cost of Development and Treatment: High R&D expenses and potentially expensive treatment regimens.
Emerging Opportunities in Oncolytic Bacterial Drugs
Emerging opportunities in the oncolytic bacterial drugs market lie in the development of combination therapies, where bacterial agents are used in conjunction with other cancer treatments like immunotherapy or chemotherapy to achieve synergistic effects. The exploration of novel bacterial chassis with inherent tumor-homing properties and improved safety profiles presents another significant avenue. Furthermore, the expansion into new cancer indications beyond solid tumors, such as hematological malignancies, is a promising area. The development of sophisticated delivery systems and personalized bacterial therapies tailored to individual patient genetics and tumor characteristics also holds immense potential. Untapped markets in developing economies with a growing cancer burden also represent a significant opportunity for future growth.
Growth Accelerators in the Oncolytic Bacterial Drugs Industry
Long-term growth in the oncolytic bacterial drugs industry will be significantly propelled by ongoing technological breakthroughs in gene editing and metabolic engineering, enabling the creation of highly specific and potent therapeutic bacteria. Strategic partnerships between academic institutions and pharmaceutical companies will accelerate the translation of promising research from bench to bedside. Market expansion strategies, including targeting rare cancers and exploring combination therapies for resistant tumors, will broaden the therapeutic utility. Furthermore, advancements in manufacturing processes that improve efficiency and reduce costs will be crucial for wider adoption and market penetration. The development of robust preclinical and clinical models that accurately predict human response will de-risk development and speed up the approval process.
Key Players Shaping the Oncolytic Bacterial Drugs Market
- Salvector
- Guangzhou Sinogen Pharmaceutical
- HKND YB1 PHARMACEUTUCAL
- Shandong Xinchuang Biotechnology
Notable Milestones in Oncolytic Bacterial Drugs Sector
- 2019: Initial promising preclinical data published on genetically engineered E. coli for targeted drug delivery.
- 2020: First human trial initiated for an oncolytic bacterial therapy targeting metastatic colorectal cancer.
- 2021: Regulatory approval for a novel oncolytic bacterium in China, marking a significant market entry.
- 2022: Strategic funding round for a biotech startup focusing on next-generation oncolytic bacterial platforms.
- 2023: Presentation of positive Phase II clinical trial results for an intratumoral bacterial therapy in melanoma.
- 2024: Expansion of a key player's manufacturing capacity to meet anticipated commercial demand.
In-Depth Oncolytic Bacterial Drugs Market Outlook
The future outlook for the oncolytic bacterial drugs market is exceptionally bright, characterized by a strong pipeline of innovative therapies and increasing clinical validation. Growth accelerators, including breakthroughs in synthetic biology and immune engineering, will continue to fuel the development of more sophisticated and safer bacterial agents. Strategic collaborations and the exploration of novel therapeutic applications will expand the market's reach and impact. The increasing understanding of the tumor microenvironment and the host immune response will enable the design of highly personalized and effective treatments. This sector is poised to become a cornerstone of cancer therapy, offering a potent and potentially curative approach for a wide range of malignancies.
Oncolytic Bacterial Drugs Segmentation
-
1. Application
- 1.1. Hospital
- 1.2. Clinic
- 1.3. Others
-
2. Type
- 2.1. Intratumoral Injection
- 2.2. Intravenous Injection
Oncolytic Bacterial Drugs Segmentation By Geography
-
1. North America
- 1.1. United States
- 1.2. Canada
- 1.3. Mexico
-
2. South America
- 2.1. Brazil
- 2.2. Argentina
- 2.3. Rest of South America
-
3. Europe
- 3.1. United Kingdom
- 3.2. Germany
- 3.3. France
- 3.4. Italy
- 3.5. Spain
- 3.6. Russia
- 3.7. Benelux
- 3.8. Nordics
- 3.9. Rest of Europe
-
4. Middle East & Africa
- 4.1. Turkey
- 4.2. Israel
- 4.3. GCC
- 4.4. North Africa
- 4.5. South Africa
- 4.6. Rest of Middle East & Africa
-
5. Asia Pacific
- 5.1. China
- 5.2. India
- 5.3. Japan
- 5.4. South Korea
- 5.5. ASEAN
- 5.6. Oceania
- 5.7. Rest of Asia Pacific
Oncolytic Bacterial Drugs REPORT HIGHLIGHTS
| Aspects | Details |
|---|---|
| Study Period | 2019-2033 |
| Base Year | 2024 |
| Estimated Year | 2025 |
| Forecast Period | 2025-2033 |
| Historical Period | 2019-2024 |
| Growth Rate | CAGR of 5.6% from 2019-2033 |
| Segmentation |
|
Table of Contents
- 1. Introduction
- 1.1. Research Scope
- 1.2. Market Segmentation
- 1.3. Research Methodology
- 1.4. Definitions and Assumptions
- 2. Executive Summary
- 2.1. Introduction
- 3. Market Dynamics
- 3.1. Introduction
- 3.2. Market Drivers
- 3.3. Market Restrains
- 3.4. Market Trends
- 4. Market Factor Analysis
- 4.1. Porters Five Forces
- 4.2. Supply/Value Chain
- 4.3. PESTEL analysis
- 4.4. Market Entropy
- 4.5. Patent/Trademark Analysis
- 5. Global Oncolytic Bacterial Drugs Analysis, Insights and Forecast, 2019-2031
- 5.1. Market Analysis, Insights and Forecast - by Application
- 5.1.1. Hospital
- 5.1.2. Clinic
- 5.1.3. Others
- 5.2. Market Analysis, Insights and Forecast - by Type
- 5.2.1. Intratumoral Injection
- 5.2.2. Intravenous Injection
- 5.3. Market Analysis, Insights and Forecast - by Region
- 5.3.1. North America
- 5.3.2. South America
- 5.3.3. Europe
- 5.3.4. Middle East & Africa
- 5.3.5. Asia Pacific
- 5.1. Market Analysis, Insights and Forecast - by Application
- 6. North America Oncolytic Bacterial Drugs Analysis, Insights and Forecast, 2019-2031
- 6.1. Market Analysis, Insights and Forecast - by Application
- 6.1.1. Hospital
- 6.1.2. Clinic
- 6.1.3. Others
- 6.2. Market Analysis, Insights and Forecast - by Type
- 6.2.1. Intratumoral Injection
- 6.2.2. Intravenous Injection
- 6.1. Market Analysis, Insights and Forecast - by Application
- 7. South America Oncolytic Bacterial Drugs Analysis, Insights and Forecast, 2019-2031
- 7.1. Market Analysis, Insights and Forecast - by Application
- 7.1.1. Hospital
- 7.1.2. Clinic
- 7.1.3. Others
- 7.2. Market Analysis, Insights and Forecast - by Type
- 7.2.1. Intratumoral Injection
- 7.2.2. Intravenous Injection
- 7.1. Market Analysis, Insights and Forecast - by Application
- 8. Europe Oncolytic Bacterial Drugs Analysis, Insights and Forecast, 2019-2031
- 8.1. Market Analysis, Insights and Forecast - by Application
- 8.1.1. Hospital
- 8.1.2. Clinic
- 8.1.3. Others
- 8.2. Market Analysis, Insights and Forecast - by Type
- 8.2.1. Intratumoral Injection
- 8.2.2. Intravenous Injection
- 8.1. Market Analysis, Insights and Forecast - by Application
- 9. Middle East & Africa Oncolytic Bacterial Drugs Analysis, Insights and Forecast, 2019-2031
- 9.1. Market Analysis, Insights and Forecast - by Application
- 9.1.1. Hospital
- 9.1.2. Clinic
- 9.1.3. Others
- 9.2. Market Analysis, Insights and Forecast - by Type
- 9.2.1. Intratumoral Injection
- 9.2.2. Intravenous Injection
- 9.1. Market Analysis, Insights and Forecast - by Application
- 10. Asia Pacific Oncolytic Bacterial Drugs Analysis, Insights and Forecast, 2019-2031
- 10.1. Market Analysis, Insights and Forecast - by Application
- 10.1.1. Hospital
- 10.1.2. Clinic
- 10.1.3. Others
- 10.2. Market Analysis, Insights and Forecast - by Type
- 10.2.1. Intratumoral Injection
- 10.2.2. Intravenous Injection
- 10.1. Market Analysis, Insights and Forecast - by Application
- 11. Competitive Analysis
- 11.1. Global Market Share Analysis 2024
- 11.2. Company Profiles
- 11.2.1 Salvector
- 11.2.1.1. Overview
- 11.2.1.2. Products
- 11.2.1.3. SWOT Analysis
- 11.2.1.4. Recent Developments
- 11.2.1.5. Financials (Based on Availability)
- 11.2.2 Guangzhou Sinogen Pharmaceutical
- 11.2.2.1. Overview
- 11.2.2.2. Products
- 11.2.2.3. SWOT Analysis
- 11.2.2.4. Recent Developments
- 11.2.2.5. Financials (Based on Availability)
- 11.2.3 HKND YB1 PHARMACEUTUCAL
- 11.2.3.1. Overview
- 11.2.3.2. Products
- 11.2.3.3. SWOT Analysis
- 11.2.3.4. Recent Developments
- 11.2.3.5. Financials (Based on Availability)
- 11.2.4 Shandong Xinchuang Biotechnology
- 11.2.4.1. Overview
- 11.2.4.2. Products
- 11.2.4.3. SWOT Analysis
- 11.2.4.4. Recent Developments
- 11.2.4.5. Financials (Based on Availability)
- 11.2.1 Salvector
List of Figures
- Figure 1: Global Oncolytic Bacterial Drugs Revenue Breakdown (million, %) by Region 2024 & 2032
- Figure 2: North America Oncolytic Bacterial Drugs Revenue (million), by Application 2024 & 2032
- Figure 3: North America Oncolytic Bacterial Drugs Revenue Share (%), by Application 2024 & 2032
- Figure 4: North America Oncolytic Bacterial Drugs Revenue (million), by Type 2024 & 2032
- Figure 5: North America Oncolytic Bacterial Drugs Revenue Share (%), by Type 2024 & 2032
- Figure 6: North America Oncolytic Bacterial Drugs Revenue (million), by Country 2024 & 2032
- Figure 7: North America Oncolytic Bacterial Drugs Revenue Share (%), by Country 2024 & 2032
- Figure 8: South America Oncolytic Bacterial Drugs Revenue (million), by Application 2024 & 2032
- Figure 9: South America Oncolytic Bacterial Drugs Revenue Share (%), by Application 2024 & 2032
- Figure 10: South America Oncolytic Bacterial Drugs Revenue (million), by Type 2024 & 2032
- Figure 11: South America Oncolytic Bacterial Drugs Revenue Share (%), by Type 2024 & 2032
- Figure 12: South America Oncolytic Bacterial Drugs Revenue (million), by Country 2024 & 2032
- Figure 13: South America Oncolytic Bacterial Drugs Revenue Share (%), by Country 2024 & 2032
- Figure 14: Europe Oncolytic Bacterial Drugs Revenue (million), by Application 2024 & 2032
- Figure 15: Europe Oncolytic Bacterial Drugs Revenue Share (%), by Application 2024 & 2032
- Figure 16: Europe Oncolytic Bacterial Drugs Revenue (million), by Type 2024 & 2032
- Figure 17: Europe Oncolytic Bacterial Drugs Revenue Share (%), by Type 2024 & 2032
- Figure 18: Europe Oncolytic Bacterial Drugs Revenue (million), by Country 2024 & 2032
- Figure 19: Europe Oncolytic Bacterial Drugs Revenue Share (%), by Country 2024 & 2032
- Figure 20: Middle East & Africa Oncolytic Bacterial Drugs Revenue (million), by Application 2024 & 2032
- Figure 21: Middle East & Africa Oncolytic Bacterial Drugs Revenue Share (%), by Application 2024 & 2032
- Figure 22: Middle East & Africa Oncolytic Bacterial Drugs Revenue (million), by Type 2024 & 2032
- Figure 23: Middle East & Africa Oncolytic Bacterial Drugs Revenue Share (%), by Type 2024 & 2032
- Figure 24: Middle East & Africa Oncolytic Bacterial Drugs Revenue (million), by Country 2024 & 2032
- Figure 25: Middle East & Africa Oncolytic Bacterial Drugs Revenue Share (%), by Country 2024 & 2032
- Figure 26: Asia Pacific Oncolytic Bacterial Drugs Revenue (million), by Application 2024 & 2032
- Figure 27: Asia Pacific Oncolytic Bacterial Drugs Revenue Share (%), by Application 2024 & 2032
- Figure 28: Asia Pacific Oncolytic Bacterial Drugs Revenue (million), by Type 2024 & 2032
- Figure 29: Asia Pacific Oncolytic Bacterial Drugs Revenue Share (%), by Type 2024 & 2032
- Figure 30: Asia Pacific Oncolytic Bacterial Drugs Revenue (million), by Country 2024 & 2032
- Figure 31: Asia Pacific Oncolytic Bacterial Drugs Revenue Share (%), by Country 2024 & 2032
List of Tables
- Table 1: Global Oncolytic Bacterial Drugs Revenue million Forecast, by Region 2019 & 2032
- Table 2: Global Oncolytic Bacterial Drugs Revenue million Forecast, by Application 2019 & 2032
- Table 3: Global Oncolytic Bacterial Drugs Revenue million Forecast, by Type 2019 & 2032
- Table 4: Global Oncolytic Bacterial Drugs Revenue million Forecast, by Region 2019 & 2032
- Table 5: Global Oncolytic Bacterial Drugs Revenue million Forecast, by Application 2019 & 2032
- Table 6: Global Oncolytic Bacterial Drugs Revenue million Forecast, by Type 2019 & 2032
- Table 7: Global Oncolytic Bacterial Drugs Revenue million Forecast, by Country 2019 & 2032
- Table 8: United States Oncolytic Bacterial Drugs Revenue (million) Forecast, by Application 2019 & 2032
- Table 9: Canada Oncolytic Bacterial Drugs Revenue (million) Forecast, by Application 2019 & 2032
- Table 10: Mexico Oncolytic Bacterial Drugs Revenue (million) Forecast, by Application 2019 & 2032
- Table 11: Global Oncolytic Bacterial Drugs Revenue million Forecast, by Application 2019 & 2032
- Table 12: Global Oncolytic Bacterial Drugs Revenue million Forecast, by Type 2019 & 2032
- Table 13: Global Oncolytic Bacterial Drugs Revenue million Forecast, by Country 2019 & 2032
- Table 14: Brazil Oncolytic Bacterial Drugs Revenue (million) Forecast, by Application 2019 & 2032
- Table 15: Argentina Oncolytic Bacterial Drugs Revenue (million) Forecast, by Application 2019 & 2032
- Table 16: Rest of South America Oncolytic Bacterial Drugs Revenue (million) Forecast, by Application 2019 & 2032
- Table 17: Global Oncolytic Bacterial Drugs Revenue million Forecast, by Application 2019 & 2032
- Table 18: Global Oncolytic Bacterial Drugs Revenue million Forecast, by Type 2019 & 2032
- Table 19: Global Oncolytic Bacterial Drugs Revenue million Forecast, by Country 2019 & 2032
- Table 20: United Kingdom Oncolytic Bacterial Drugs Revenue (million) Forecast, by Application 2019 & 2032
- Table 21: Germany Oncolytic Bacterial Drugs Revenue (million) Forecast, by Application 2019 & 2032
- Table 22: France Oncolytic Bacterial Drugs Revenue (million) Forecast, by Application 2019 & 2032
- Table 23: Italy Oncolytic Bacterial Drugs Revenue (million) Forecast, by Application 2019 & 2032
- Table 24: Spain Oncolytic Bacterial Drugs Revenue (million) Forecast, by Application 2019 & 2032
- Table 25: Russia Oncolytic Bacterial Drugs Revenue (million) Forecast, by Application 2019 & 2032
- Table 26: Benelux Oncolytic Bacterial Drugs Revenue (million) Forecast, by Application 2019 & 2032
- Table 27: Nordics Oncolytic Bacterial Drugs Revenue (million) Forecast, by Application 2019 & 2032
- Table 28: Rest of Europe Oncolytic Bacterial Drugs Revenue (million) Forecast, by Application 2019 & 2032
- Table 29: Global Oncolytic Bacterial Drugs Revenue million Forecast, by Application 2019 & 2032
- Table 30: Global Oncolytic Bacterial Drugs Revenue million Forecast, by Type 2019 & 2032
- Table 31: Global Oncolytic Bacterial Drugs Revenue million Forecast, by Country 2019 & 2032
- Table 32: Turkey Oncolytic Bacterial Drugs Revenue (million) Forecast, by Application 2019 & 2032
- Table 33: Israel Oncolytic Bacterial Drugs Revenue (million) Forecast, by Application 2019 & 2032
- Table 34: GCC Oncolytic Bacterial Drugs Revenue (million) Forecast, by Application 2019 & 2032
- Table 35: North Africa Oncolytic Bacterial Drugs Revenue (million) Forecast, by Application 2019 & 2032
- Table 36: South Africa Oncolytic Bacterial Drugs Revenue (million) Forecast, by Application 2019 & 2032
- Table 37: Rest of Middle East & Africa Oncolytic Bacterial Drugs Revenue (million) Forecast, by Application 2019 & 2032
- Table 38: Global Oncolytic Bacterial Drugs Revenue million Forecast, by Application 2019 & 2032
- Table 39: Global Oncolytic Bacterial Drugs Revenue million Forecast, by Type 2019 & 2032
- Table 40: Global Oncolytic Bacterial Drugs Revenue million Forecast, by Country 2019 & 2032
- Table 41: China Oncolytic Bacterial Drugs Revenue (million) Forecast, by Application 2019 & 2032
- Table 42: India Oncolytic Bacterial Drugs Revenue (million) Forecast, by Application 2019 & 2032
- Table 43: Japan Oncolytic Bacterial Drugs Revenue (million) Forecast, by Application 2019 & 2032
- Table 44: South Korea Oncolytic Bacterial Drugs Revenue (million) Forecast, by Application 2019 & 2032
- Table 45: ASEAN Oncolytic Bacterial Drugs Revenue (million) Forecast, by Application 2019 & 2032
- Table 46: Oceania Oncolytic Bacterial Drugs Revenue (million) Forecast, by Application 2019 & 2032
- Table 47: Rest of Asia Pacific Oncolytic Bacterial Drugs Revenue (million) Forecast, by Application 2019 & 2032
Frequently Asked Questions
1. What is the projected Compound Annual Growth Rate (CAGR) of the Oncolytic Bacterial Drugs?
The projected CAGR is approximately 5.6%.
2. Which companies are prominent players in the Oncolytic Bacterial Drugs?
Key companies in the market include Salvector, Guangzhou Sinogen Pharmaceutical, HKND YB1 PHARMACEUTUCAL, Shandong Xinchuang Biotechnology.
3. What are the main segments of the Oncolytic Bacterial Drugs?
The market segments include Application, Type.
4. Can you provide details about the market size?
The market size is estimated to be USD 212 million as of 2022.
5. What are some drivers contributing to market growth?
N/A
6. What are the notable trends driving market growth?
N/A
7. Are there any restraints impacting market growth?
N/A
8. Can you provide examples of recent developments in the market?
N/A
9. What pricing options are available for accessing the report?
Pricing options include single-user, multi-user, and enterprise licenses priced at USD 4900.00, USD 7350.00, and USD 9800.00 respectively.
10. Is the market size provided in terms of value or volume?
The market size is provided in terms of value, measured in million.
11. Are there any specific market keywords associated with the report?
Yes, the market keyword associated with the report is "Oncolytic Bacterial Drugs," which aids in identifying and referencing the specific market segment covered.
12. How do I determine which pricing option suits my needs best?
The pricing options vary based on user requirements and access needs. Individual users may opt for single-user licenses, while businesses requiring broader access may choose multi-user or enterprise licenses for cost-effective access to the report.
13. Are there any additional resources or data provided in the Oncolytic Bacterial Drugs report?
While the report offers comprehensive insights, it's advisable to review the specific contents or supplementary materials provided to ascertain if additional resources or data are available.
14. How can I stay updated on further developments or reports in the Oncolytic Bacterial Drugs?
To stay informed about further developments, trends, and reports in the Oncolytic Bacterial Drugs, consider subscribing to industry newsletters, following relevant companies and organizations, or regularly checking reputable industry news sources and publications.
Methodology
Step 1 - Identification of Relevant Samples Size from Population Database


Step 2 - Approaches for Defining Global Market Size (Value, Volume* & Price*)

Note*: In applicable scenarios
Step 3 - Data Sources
Primary Research
- Web Analytics
- Survey Reports
- Research Institute
- Latest Research Reports
- Opinion Leaders
Secondary Research
- Annual Reports
- White Paper
- Latest Press Release
- Industry Association
- Paid Database
- Investor Presentations

Step 4 - Data Triangulation
Involves using different sources of information in order to increase the validity of a study
These sources are likely to be stakeholders in a program - participants, other researchers, program staff, other community members, and so on.
Then we put all data in single framework & apply various statistical tools to find out the dynamic on the market.
During the analysis stage, feedback from the stakeholder groups would be compared to determine areas of agreement as well as areas of divergence


