
Key Insights
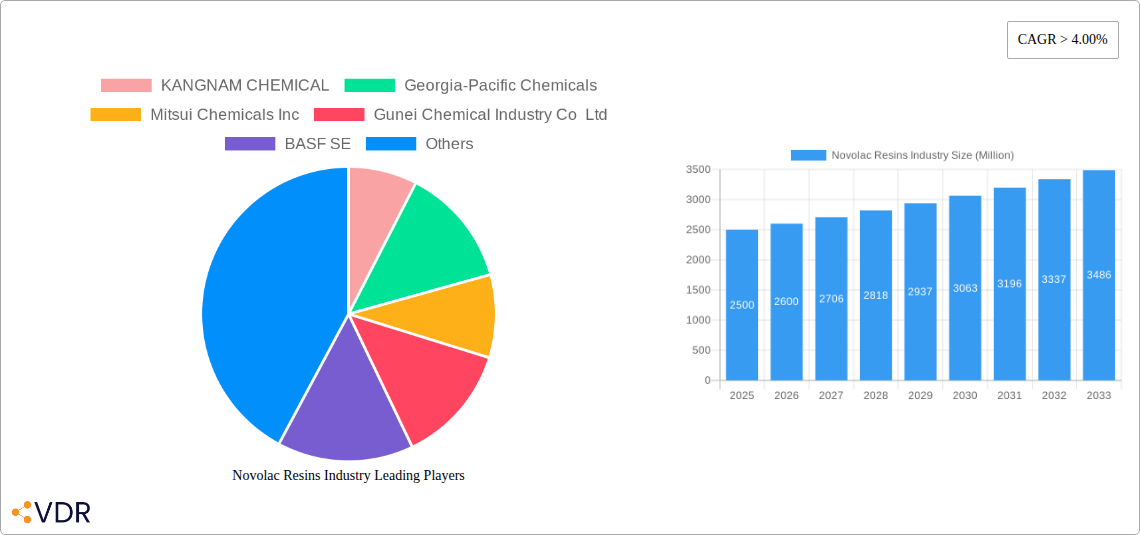
The Novolac Resins market, valued at approximately $XX million in 2025, is projected to experience robust growth, exhibiting a Compound Annual Growth Rate (CAGR) exceeding 4.00% from 2025 to 2033. This expansion is driven by several key factors. The increasing demand from the automotive industry, particularly for lightweight and durable components, fuels significant market growth. Furthermore, the burgeoning consumer electronics sector, with its need for high-performance, heat-resistant materials in devices, is another major driver. The building and construction industry also contributes significantly to market demand, as Novolac resins find applications in adhesives, coatings, and composites for infrastructure projects. Growth is further supported by the expanding oil and gas sector, utilizing these resins in specialized applications requiring high chemical resistance. While challenges exist, such as fluctuating raw material prices and environmental regulations, the overall market outlook remains positive. The diverse end-use applications and continuous innovation in resin formulations are expected to mitigate these challenges and maintain consistent growth trajectory throughout the forecast period.
Solid resin currently dominates the market share within the form segment, leveraging its advantages in strength and durability. However, liquid resin applications are experiencing faster growth rates, driven by their ease of processing and versatility in various applications. Regionally, the Asia-Pacific region, spearheaded by China and India's robust industrial expansion, is anticipated to be the largest market throughout the forecast period. North America and Europe maintain substantial market shares, fueled by established manufacturing bases and technological advancements. Key players like KANGNAM CHEMICAL, Georgia-Pacific Chemicals, Mitsui Chemicals Inc., and BASF SE are actively engaged in research and development, focusing on improved resin properties and expanding applications. Competitive strategies including mergers, acquisitions, and strategic partnerships are shaping the market landscape and driving innovation in this dynamic sector.
Novolac Resins Industry: A Comprehensive Market Report (2019-2033)
This in-depth report provides a comprehensive analysis of the Novolac Resins industry, offering invaluable insights for industry professionals, investors, and strategic decision-makers. The report covers the period from 2019 to 2033, with 2025 serving as the base and estimated year. The market is segmented by form (Solid Resin, Liquid Resin) and end-user (Automotive, Consumer Electronics, Building & Construction, Oil & Gas, Furniture, Others). Key players like KANGNAM CHEMICAL, Georgia-Pacific Chemicals, Mitsui Chemicals Inc, Gunei Chemical Industry Co Ltd, BASF SE, Hexion, SBHPP, and DIC CORPORATION are analyzed in detail. The total market size in 2025 is estimated at xx Million units.
Novolac Resins Industry Market Dynamics & Structure
This section analyzes the competitive landscape, technological advancements, regulatory influences, and market trends within the Novolac Resins industry. The report delves into market concentration, highlighting the market share held by major players and assessing the level of competition. It explores the role of technological innovation in driving market growth, examining specific advancements and their impact on product development and application. Furthermore, the report investigates the influence of regulatory frameworks, including environmental regulations and safety standards, on market dynamics. The analysis also considers the presence of competitive substitute materials and their impact on market share. Finally, the report explores M&A activities within the industry, analyzing deal volumes and their implications for market consolidation and future growth.
- Market Concentration: High (xx%), with top 5 players holding xx% market share in 2025.
- Technological Innovation: Focus on improving resin performance (e.g., higher heat resistance, improved adhesion) and sustainability (e.g., bio-based Novolac resins).
- Regulatory Landscape: Stringent environmental regulations driving demand for eco-friendly alternatives.
- Competitive Substitutes: Phenolic resins and other thermosetting resins pose a competitive challenge.
- M&A Activity: xx deals recorded between 2019 and 2024, indicating a trend towards consolidation.
Novolac Resins Industry Growth Trends & Insights
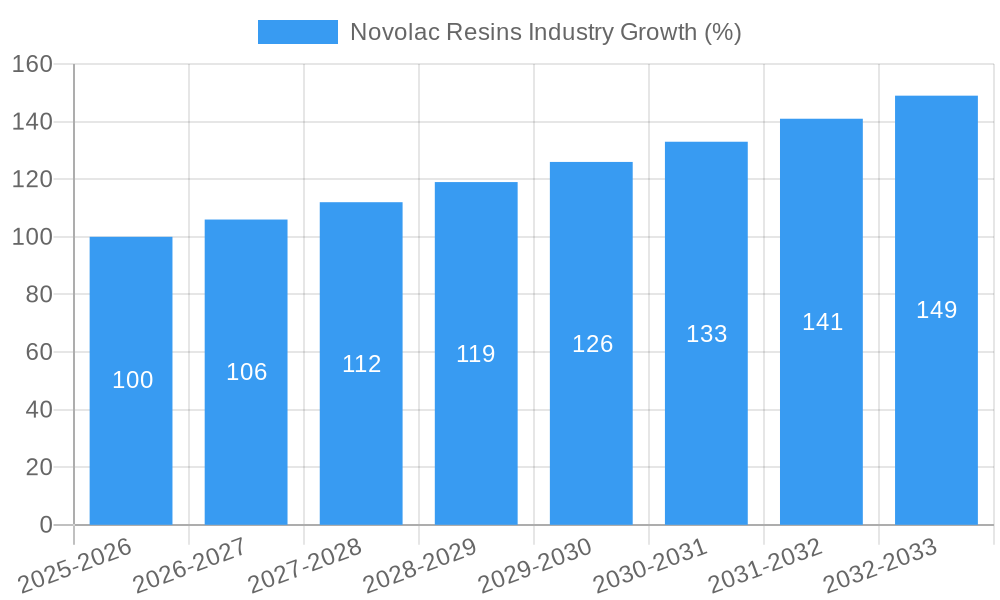
This section provides a detailed analysis of the Novolac Resins market's historical and projected growth trajectory. It leverages extensive market research data to understand the market size evolution, adoption rates across different end-user segments, and the impact of technological disruptions on market dynamics. The analysis examines shifts in consumer behavior and preferences influencing demand. Specific metrics, including the Compound Annual Growth Rate (CAGR) and market penetration rates, are provided to offer a clear picture of the market's growth momentum. The projected CAGR for the forecast period (2025-2033) is xx%.
- Market Size (2019): xx Million units
- Market Size (2024): xx Million units
- Market Size (2025): xx Million units
- Market Size (2033): xx Million units
- CAGR (2025-2033): xx%
Dominant Regions, Countries, or Segments in Novolac Resins Industry
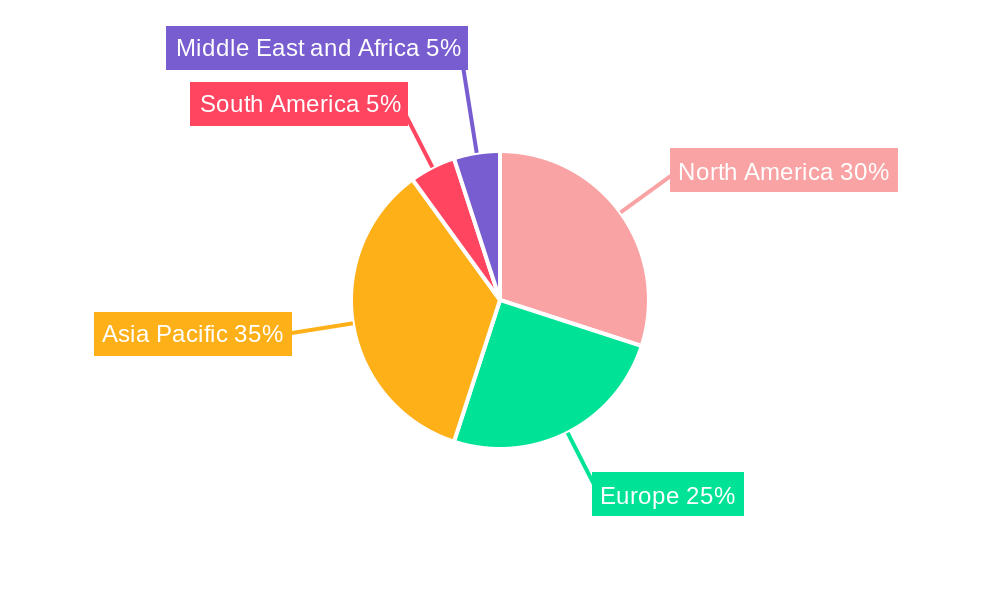
This section pinpoints the leading geographic regions, countries, and market segments within the Novolac Resins industry that are driving significant market growth. It examines the factors contributing to the dominance of specific regions or segments, such as favorable economic policies, robust infrastructure development, or unique consumer preferences. The analysis also assesses the growth potential of each dominant region and segment, projecting future market share and growth trajectories. The report highlights the key drivers for growth in each region and segment.
- Dominant Region: Asia-Pacific (Driven by robust growth in the automotive and construction sectors).
- Dominant Form: Solid Resin (Higher demand in traditional applications)
- Dominant End-User: Automotive (Growing demand for lightweight and high-performance materials).
- Key Drivers: Government infrastructure investments, rising disposable incomes, and technological advancements.
Novolac Resins Industry Product Landscape
The Novolac resins market offers a range of products tailored to diverse applications. These resins vary in their properties, such as molecular weight, viscosity, and reactivity, and are formulated to meet specific requirements. Recent product innovations have focused on enhancing performance characteristics, including improved heat resistance, higher strength, and enhanced bonding capabilities. The development of sustainable and eco-friendly Novolac resins is also a key trend.
Key Drivers, Barriers & Challenges in Novolac Resins Industry
Key Drivers:
- Growing demand from automotive and construction industries.
- Increasing use in electronics and other high-tech applications.
- Advancements in resin technology leading to improved performance.
Key Challenges:
- Fluctuations in raw material prices.
- Stringent environmental regulations impacting production costs.
- Intense competition from substitute materials.
Emerging Opportunities in Novolac Resins Industry
The Novolac resins market presents significant growth opportunities. Expanding into new applications, such as renewable energy technologies and advanced composites, offers substantial potential. Furthermore, the development of specialized resins with enhanced properties, coupled with a focus on sustainability, will drive further market expansion.
Growth Accelerators in the Novolac Resins Industry Industry
Technological breakthroughs in resin synthesis and formulation will propel market growth. Strategic partnerships among resin manufacturers and end-users will optimize product development and market access. Expanding into emerging markets and strengthening global distribution networks will further contribute to market growth.
Key Players Shaping the Novolac Resins Industry Market
- KANGNAM CHEMICAL
- Georgia-Pacific Chemicals
- Mitsui Chemicals Inc
- Gunei Chemical Industry Co Ltd
- BASF SE
- Hexion
- SBHPP
- DIC CORPORATION
Notable Milestones in Novolac Resins Industry Sector
- 2020: Launch of a new high-performance Novolac resin by BASF SE.
- 2022: Acquisition of a smaller Novolac resin manufacturer by Hexion.
- 2023: Introduction of a bio-based Novolac resin by Mitsui Chemicals Inc.
In-Depth Novolac Resins Industry Market Outlook
The Novolac resins market is poised for substantial growth driven by technological advancements, strategic partnerships, and market expansion. The continued growth of end-use sectors, especially in developing economies, will fuel demand. Companies that invest in research and development, focus on sustainability, and leverage strategic partnerships will be well-positioned to capture significant market share.
Novolac Resins Industry Segmentation
-
1. Form
- 1.1. Solid Resin
- 1.2. Liquid Resin
-
2. End-User
- 2.1. Automotive
- 2.2. Consumer Electronics
- 2.3. Building & Construction
- 2.4. Oil & Gas
- 2.5. Furniture
- 2.6. Others
Novolac Resins Industry Segmentation By Geography
-
1. Asia Pacific
- 1.1. China
- 1.2. India
- 1.3. Japan
- 1.4. South Korea
- 1.5. Rest of Asia Pacific
-
2. North America
- 2.1. United States
- 2.2. Canada
- 2.3. Mexico
-
3. Europe
- 3.1. Germany
- 3.2. United Kingdom
- 3.3. France
- 3.4. Italy
- 3.5. Rest of Europe
-
4. South America
- 4.1. Brazil
- 4.2. Argentina
- 4.3. Rest of South America
-
5. Middle East and Africa
- 5.1. Saudi Arabia
- 5.2. South Africa
- 5.3. Rest of Middle East and Africa
Novolac Resins Industry REPORT HIGHLIGHTS
| Aspects | Details |
|---|---|
| Study Period | 2019-2033 |
| Base Year | 2024 |
| Estimated Year | 2025 |
| Forecast Period | 2025-2033 |
| Historical Period | 2019-2024 |
| Growth Rate | CAGR of > 4.00% from 2019-2033 |
| Segmentation |
|
Table of Contents
- 1. Introduction
- 1.1. Research Scope
- 1.2. Market Segmentation
- 1.3. Research Methodology
- 1.4. Definitions and Assumptions
- 2. Executive Summary
- 2.1. Introduction
- 3. Market Dynamics
- 3.1. Introduction
- 3.2. Market Drivers
- 3.2.1. ; High Demand for Fuel Efficient Light Vehicles; Increasing Demand from the Consumer Electronics
- 3.3. Market Restrains
- 3.3.1. ; Unfavorable Conditions Arising Due to COVID-19 Outbreak; Other Restraints
- 3.4. Market Trends
- 3.4.1. High Demand from Automotive Segment to Boost Novolac Resins Market
- 4. Market Factor Analysis
- 4.1. Porters Five Forces
- 4.2. Supply/Value Chain
- 4.3. PESTEL analysis
- 4.4. Market Entropy
- 4.5. Patent/Trademark Analysis
- 5. Global Novolac Resins Industry Analysis, Insights and Forecast, 2019-2031
- 5.1. Market Analysis, Insights and Forecast - by Form
- 5.1.1. Solid Resin
- 5.1.2. Liquid Resin
- 5.2. Market Analysis, Insights and Forecast - by End-User
- 5.2.1. Automotive
- 5.2.2. Consumer Electronics
- 5.2.3. Building & Construction
- 5.2.4. Oil & Gas
- 5.2.5. Furniture
- 5.2.6. Others
- 5.3. Market Analysis, Insights and Forecast - by Region
- 5.3.1. Asia Pacific
- 5.3.2. North America
- 5.3.3. Europe
- 5.3.4. South America
- 5.3.5. Middle East and Africa
- 5.1. Market Analysis, Insights and Forecast - by Form
- 6. Asia Pacific Novolac Resins Industry Analysis, Insights and Forecast, 2019-2031
- 6.1. Market Analysis, Insights and Forecast - by Form
- 6.1.1. Solid Resin
- 6.1.2. Liquid Resin
- 6.2. Market Analysis, Insights and Forecast - by End-User
- 6.2.1. Automotive
- 6.2.2. Consumer Electronics
- 6.2.3. Building & Construction
- 6.2.4. Oil & Gas
- 6.2.5. Furniture
- 6.2.6. Others
- 6.1. Market Analysis, Insights and Forecast - by Form
- 7. North America Novolac Resins Industry Analysis, Insights and Forecast, 2019-2031
- 7.1. Market Analysis, Insights and Forecast - by Form
- 7.1.1. Solid Resin
- 7.1.2. Liquid Resin
- 7.2. Market Analysis, Insights and Forecast - by End-User
- 7.2.1. Automotive
- 7.2.2. Consumer Electronics
- 7.2.3. Building & Construction
- 7.2.4. Oil & Gas
- 7.2.5. Furniture
- 7.2.6. Others
- 7.1. Market Analysis, Insights and Forecast - by Form
- 8. Europe Novolac Resins Industry Analysis, Insights and Forecast, 2019-2031
- 8.1. Market Analysis, Insights and Forecast - by Form
- 8.1.1. Solid Resin
- 8.1.2. Liquid Resin
- 8.2. Market Analysis, Insights and Forecast - by End-User
- 8.2.1. Automotive
- 8.2.2. Consumer Electronics
- 8.2.3. Building & Construction
- 8.2.4. Oil & Gas
- 8.2.5. Furniture
- 8.2.6. Others
- 8.1. Market Analysis, Insights and Forecast - by Form
- 9. South America Novolac Resins Industry Analysis, Insights and Forecast, 2019-2031
- 9.1. Market Analysis, Insights and Forecast - by Form
- 9.1.1. Solid Resin
- 9.1.2. Liquid Resin
- 9.2. Market Analysis, Insights and Forecast - by End-User
- 9.2.1. Automotive
- 9.2.2. Consumer Electronics
- 9.2.3. Building & Construction
- 9.2.4. Oil & Gas
- 9.2.5. Furniture
- 9.2.6. Others
- 9.1. Market Analysis, Insights and Forecast - by Form
- 10. Middle East and Africa Novolac Resins Industry Analysis, Insights and Forecast, 2019-2031
- 10.1. Market Analysis, Insights and Forecast - by Form
- 10.1.1. Solid Resin
- 10.1.2. Liquid Resin
- 10.2. Market Analysis, Insights and Forecast - by End-User
- 10.2.1. Automotive
- 10.2.2. Consumer Electronics
- 10.2.3. Building & Construction
- 10.2.4. Oil & Gas
- 10.2.5. Furniture
- 10.2.6. Others
- 10.1. Market Analysis, Insights and Forecast - by Form
- 11. Asia Pacific Novolac Resins Industry Analysis, Insights and Forecast, 2019-2031
- 11.1. Market Analysis, Insights and Forecast - By Country/Sub-region
- 11.1.1 China
- 11.1.2 India
- 11.1.3 Japan
- 11.1.4 South Korea
- 11.1.5 Rest of Asia Pacific
- 12. North America Novolac Resins Industry Analysis, Insights and Forecast, 2019-2031
- 12.1. Market Analysis, Insights and Forecast - By Country/Sub-region
- 12.1.1 United States
- 12.1.2 Canada
- 12.1.3 Mexico
- 13. Europe Novolac Resins Industry Analysis, Insights and Forecast, 2019-2031
- 13.1. Market Analysis, Insights and Forecast - By Country/Sub-region
- 13.1.1 Germany
- 13.1.2 United Kingdom
- 13.1.3 France
- 13.1.4 Italy
- 13.1.5 Rest of Europe
- 14. South America Novolac Resins Industry Analysis, Insights and Forecast, 2019-2031
- 14.1. Market Analysis, Insights and Forecast - By Country/Sub-region
- 14.1.1 Brazil
- 14.1.2 Argentina
- 14.1.3 Rest of South America
- 15. Middle East and Africa Novolac Resins Industry Analysis, Insights and Forecast, 2019-2031
- 15.1. Market Analysis, Insights and Forecast - By Country/Sub-region
- 15.1.1 Saudi Arabia
- 15.1.2 South Africa
- 15.1.3 Rest of Middle East and Africa
- 16. Competitive Analysis
- 16.1. Global Market Share Analysis 2024
- 16.2. Company Profiles
- 16.2.1 KANGNAM CHEMICAL
- 16.2.1.1. Overview
- 16.2.1.2. Products
- 16.2.1.3. SWOT Analysis
- 16.2.1.4. Recent Developments
- 16.2.1.5. Financials (Based on Availability)
- 16.2.2 Georgia-Pacific Chemicals
- 16.2.2.1. Overview
- 16.2.2.2. Products
- 16.2.2.3. SWOT Analysis
- 16.2.2.4. Recent Developments
- 16.2.2.5. Financials (Based on Availability)
- 16.2.3 Mitsui Chemicals Inc
- 16.2.3.1. Overview
- 16.2.3.2. Products
- 16.2.3.3. SWOT Analysis
- 16.2.3.4. Recent Developments
- 16.2.3.5. Financials (Based on Availability)
- 16.2.4 Gunei Chemical Industry Co Ltd
- 16.2.4.1. Overview
- 16.2.4.2. Products
- 16.2.4.3. SWOT Analysis
- 16.2.4.4. Recent Developments
- 16.2.4.5. Financials (Based on Availability)
- 16.2.5 BASF SE
- 16.2.5.1. Overview
- 16.2.5.2. Products
- 16.2.5.3. SWOT Analysis
- 16.2.5.4. Recent Developments
- 16.2.5.5. Financials (Based on Availability)
- 16.2.6 Hexion
- 16.2.6.1. Overview
- 16.2.6.2. Products
- 16.2.6.3. SWOT Analysis
- 16.2.6.4. Recent Developments
- 16.2.6.5. Financials (Based on Availability)
- 16.2.7 SBHPP
- 16.2.7.1. Overview
- 16.2.7.2. Products
- 16.2.7.3. SWOT Analysis
- 16.2.7.4. Recent Developments
- 16.2.7.5. Financials (Based on Availability)
- 16.2.8 DIC CORPORATION
- 16.2.8.1. Overview
- 16.2.8.2. Products
- 16.2.8.3. SWOT Analysis
- 16.2.8.4. Recent Developments
- 16.2.8.5. Financials (Based on Availability)
- 16.2.1 KANGNAM CHEMICAL
List of Figures
- Figure 1: Global Novolac Resins Industry Revenue Breakdown (Million, %) by Region 2024 & 2032
- Figure 2: Global Novolac Resins Industry Volume Breakdown ( g cm-3, %) by Region 2024 & 2032
- Figure 3: Asia Pacific Novolac Resins Industry Revenue (Million), by Country 2024 & 2032
- Figure 4: Asia Pacific Novolac Resins Industry Volume ( g cm-3), by Country 2024 & 2032
- Figure 5: Asia Pacific Novolac Resins Industry Revenue Share (%), by Country 2024 & 2032
- Figure 6: Asia Pacific Novolac Resins Industry Volume Share (%), by Country 2024 & 2032
- Figure 7: North America Novolac Resins Industry Revenue (Million), by Country 2024 & 2032
- Figure 8: North America Novolac Resins Industry Volume ( g cm-3), by Country 2024 & 2032
- Figure 9: North America Novolac Resins Industry Revenue Share (%), by Country 2024 & 2032
- Figure 10: North America Novolac Resins Industry Volume Share (%), by Country 2024 & 2032
- Figure 11: Europe Novolac Resins Industry Revenue (Million), by Country 2024 & 2032
- Figure 12: Europe Novolac Resins Industry Volume ( g cm-3), by Country 2024 & 2032
- Figure 13: Europe Novolac Resins Industry Revenue Share (%), by Country 2024 & 2032
- Figure 14: Europe Novolac Resins Industry Volume Share (%), by Country 2024 & 2032
- Figure 15: South America Novolac Resins Industry Revenue (Million), by Country 2024 & 2032
- Figure 16: South America Novolac Resins Industry Volume ( g cm-3), by Country 2024 & 2032
- Figure 17: South America Novolac Resins Industry Revenue Share (%), by Country 2024 & 2032
- Figure 18: South America Novolac Resins Industry Volume Share (%), by Country 2024 & 2032
- Figure 19: Middle East and Africa Novolac Resins Industry Revenue (Million), by Country 2024 & 2032
- Figure 20: Middle East and Africa Novolac Resins Industry Volume ( g cm-3), by Country 2024 & 2032
- Figure 21: Middle East and Africa Novolac Resins Industry Revenue Share (%), by Country 2024 & 2032
- Figure 22: Middle East and Africa Novolac Resins Industry Volume Share (%), by Country 2024 & 2032
- Figure 23: Asia Pacific Novolac Resins Industry Revenue (Million), by Form 2024 & 2032
- Figure 24: Asia Pacific Novolac Resins Industry Volume ( g cm-3), by Form 2024 & 2032
- Figure 25: Asia Pacific Novolac Resins Industry Revenue Share (%), by Form 2024 & 2032
- Figure 26: Asia Pacific Novolac Resins Industry Volume Share (%), by Form 2024 & 2032
- Figure 27: Asia Pacific Novolac Resins Industry Revenue (Million), by End-User 2024 & 2032
- Figure 28: Asia Pacific Novolac Resins Industry Volume ( g cm-3), by End-User 2024 & 2032
- Figure 29: Asia Pacific Novolac Resins Industry Revenue Share (%), by End-User 2024 & 2032
- Figure 30: Asia Pacific Novolac Resins Industry Volume Share (%), by End-User 2024 & 2032
- Figure 31: Asia Pacific Novolac Resins Industry Revenue (Million), by Country 2024 & 2032
- Figure 32: Asia Pacific Novolac Resins Industry Volume ( g cm-3), by Country 2024 & 2032
- Figure 33: Asia Pacific Novolac Resins Industry Revenue Share (%), by Country 2024 & 2032
- Figure 34: Asia Pacific Novolac Resins Industry Volume Share (%), by Country 2024 & 2032
- Figure 35: North America Novolac Resins Industry Revenue (Million), by Form 2024 & 2032
- Figure 36: North America Novolac Resins Industry Volume ( g cm-3), by Form 2024 & 2032
- Figure 37: North America Novolac Resins Industry Revenue Share (%), by Form 2024 & 2032
- Figure 38: North America Novolac Resins Industry Volume Share (%), by Form 2024 & 2032
- Figure 39: North America Novolac Resins Industry Revenue (Million), by End-User 2024 & 2032
- Figure 40: North America Novolac Resins Industry Volume ( g cm-3), by End-User 2024 & 2032
- Figure 41: North America Novolac Resins Industry Revenue Share (%), by End-User 2024 & 2032
- Figure 42: North America Novolac Resins Industry Volume Share (%), by End-User 2024 & 2032
- Figure 43: North America Novolac Resins Industry Revenue (Million), by Country 2024 & 2032
- Figure 44: North America Novolac Resins Industry Volume ( g cm-3), by Country 2024 & 2032
- Figure 45: North America Novolac Resins Industry Revenue Share (%), by Country 2024 & 2032
- Figure 46: North America Novolac Resins Industry Volume Share (%), by Country 2024 & 2032
- Figure 47: Europe Novolac Resins Industry Revenue (Million), by Form 2024 & 2032
- Figure 48: Europe Novolac Resins Industry Volume ( g cm-3), by Form 2024 & 2032
- Figure 49: Europe Novolac Resins Industry Revenue Share (%), by Form 2024 & 2032
- Figure 50: Europe Novolac Resins Industry Volume Share (%), by Form 2024 & 2032
- Figure 51: Europe Novolac Resins Industry Revenue (Million), by End-User 2024 & 2032
- Figure 52: Europe Novolac Resins Industry Volume ( g cm-3), by End-User 2024 & 2032
- Figure 53: Europe Novolac Resins Industry Revenue Share (%), by End-User 2024 & 2032
- Figure 54: Europe Novolac Resins Industry Volume Share (%), by End-User 2024 & 2032
- Figure 55: Europe Novolac Resins Industry Revenue (Million), by Country 2024 & 2032
- Figure 56: Europe Novolac Resins Industry Volume ( g cm-3), by Country 2024 & 2032
- Figure 57: Europe Novolac Resins Industry Revenue Share (%), by Country 2024 & 2032
- Figure 58: Europe Novolac Resins Industry Volume Share (%), by Country 2024 & 2032
- Figure 59: South America Novolac Resins Industry Revenue (Million), by Form 2024 & 2032
- Figure 60: South America Novolac Resins Industry Volume ( g cm-3), by Form 2024 & 2032
- Figure 61: South America Novolac Resins Industry Revenue Share (%), by Form 2024 & 2032
- Figure 62: South America Novolac Resins Industry Volume Share (%), by Form 2024 & 2032
- Figure 63: South America Novolac Resins Industry Revenue (Million), by End-User 2024 & 2032
- Figure 64: South America Novolac Resins Industry Volume ( g cm-3), by End-User 2024 & 2032
- Figure 65: South America Novolac Resins Industry Revenue Share (%), by End-User 2024 & 2032
- Figure 66: South America Novolac Resins Industry Volume Share (%), by End-User 2024 & 2032
- Figure 67: South America Novolac Resins Industry Revenue (Million), by Country 2024 & 2032
- Figure 68: South America Novolac Resins Industry Volume ( g cm-3), by Country 2024 & 2032
- Figure 69: South America Novolac Resins Industry Revenue Share (%), by Country 2024 & 2032
- Figure 70: South America Novolac Resins Industry Volume Share (%), by Country 2024 & 2032
- Figure 71: Middle East and Africa Novolac Resins Industry Revenue (Million), by Form 2024 & 2032
- Figure 72: Middle East and Africa Novolac Resins Industry Volume ( g cm-3), by Form 2024 & 2032
- Figure 73: Middle East and Africa Novolac Resins Industry Revenue Share (%), by Form 2024 & 2032
- Figure 74: Middle East and Africa Novolac Resins Industry Volume Share (%), by Form 2024 & 2032
- Figure 75: Middle East and Africa Novolac Resins Industry Revenue (Million), by End-User 2024 & 2032
- Figure 76: Middle East and Africa Novolac Resins Industry Volume ( g cm-3), by End-User 2024 & 2032
- Figure 77: Middle East and Africa Novolac Resins Industry Revenue Share (%), by End-User 2024 & 2032
- Figure 78: Middle East and Africa Novolac Resins Industry Volume Share (%), by End-User 2024 & 2032
- Figure 79: Middle East and Africa Novolac Resins Industry Revenue (Million), by Country 2024 & 2032
- Figure 80: Middle East and Africa Novolac Resins Industry Volume ( g cm-3), by Country 2024 & 2032
- Figure 81: Middle East and Africa Novolac Resins Industry Revenue Share (%), by Country 2024 & 2032
- Figure 82: Middle East and Africa Novolac Resins Industry Volume Share (%), by Country 2024 & 2032
List of Tables
- Table 1: Global Novolac Resins Industry Revenue Million Forecast, by Region 2019 & 2032
- Table 2: Global Novolac Resins Industry Volume g cm-3 Forecast, by Region 2019 & 2032
- Table 3: Global Novolac Resins Industry Revenue Million Forecast, by Form 2019 & 2032
- Table 4: Global Novolac Resins Industry Volume g cm-3 Forecast, by Form 2019 & 2032
- Table 5: Global Novolac Resins Industry Revenue Million Forecast, by End-User 2019 & 2032
- Table 6: Global Novolac Resins Industry Volume g cm-3 Forecast, by End-User 2019 & 2032
- Table 7: Global Novolac Resins Industry Revenue Million Forecast, by Region 2019 & 2032
- Table 8: Global Novolac Resins Industry Volume g cm-3 Forecast, by Region 2019 & 2032
- Table 9: Global Novolac Resins Industry Revenue Million Forecast, by Country 2019 & 2032
- Table 10: Global Novolac Resins Industry Volume g cm-3 Forecast, by Country 2019 & 2032
- Table 11: China Novolac Resins Industry Revenue (Million) Forecast, by Application 2019 & 2032
- Table 12: China Novolac Resins Industry Volume ( g cm-3) Forecast, by Application 2019 & 2032
- Table 13: India Novolac Resins Industry Revenue (Million) Forecast, by Application 2019 & 2032
- Table 14: India Novolac Resins Industry Volume ( g cm-3) Forecast, by Application 2019 & 2032
- Table 15: Japan Novolac Resins Industry Revenue (Million) Forecast, by Application 2019 & 2032
- Table 16: Japan Novolac Resins Industry Volume ( g cm-3) Forecast, by Application 2019 & 2032
- Table 17: South Korea Novolac Resins Industry Revenue (Million) Forecast, by Application 2019 & 2032
- Table 18: South Korea Novolac Resins Industry Volume ( g cm-3) Forecast, by Application 2019 & 2032
- Table 19: Rest of Asia Pacific Novolac Resins Industry Revenue (Million) Forecast, by Application 2019 & 2032
- Table 20: Rest of Asia Pacific Novolac Resins Industry Volume ( g cm-3) Forecast, by Application 2019 & 2032
- Table 21: Global Novolac Resins Industry Revenue Million Forecast, by Country 2019 & 2032
- Table 22: Global Novolac Resins Industry Volume g cm-3 Forecast, by Country 2019 & 2032
- Table 23: United States Novolac Resins Industry Revenue (Million) Forecast, by Application 2019 & 2032
- Table 24: United States Novolac Resins Industry Volume ( g cm-3) Forecast, by Application 2019 & 2032
- Table 25: Canada Novolac Resins Industry Revenue (Million) Forecast, by Application 2019 & 2032
- Table 26: Canada Novolac Resins Industry Volume ( g cm-3) Forecast, by Application 2019 & 2032
- Table 27: Mexico Novolac Resins Industry Revenue (Million) Forecast, by Application 2019 & 2032
- Table 28: Mexico Novolac Resins Industry Volume ( g cm-3) Forecast, by Application 2019 & 2032
- Table 29: Global Novolac Resins Industry Revenue Million Forecast, by Country 2019 & 2032
- Table 30: Global Novolac Resins Industry Volume g cm-3 Forecast, by Country 2019 & 2032
- Table 31: Germany Novolac Resins Industry Revenue (Million) Forecast, by Application 2019 & 2032
- Table 32: Germany Novolac Resins Industry Volume ( g cm-3) Forecast, by Application 2019 & 2032
- Table 33: United Kingdom Novolac Resins Industry Revenue (Million) Forecast, by Application 2019 & 2032
- Table 34: United Kingdom Novolac Resins Industry Volume ( g cm-3) Forecast, by Application 2019 & 2032
- Table 35: France Novolac Resins Industry Revenue (Million) Forecast, by Application 2019 & 2032
- Table 36: France Novolac Resins Industry Volume ( g cm-3) Forecast, by Application 2019 & 2032
- Table 37: Italy Novolac Resins Industry Revenue (Million) Forecast, by Application 2019 & 2032
- Table 38: Italy Novolac Resins Industry Volume ( g cm-3) Forecast, by Application 2019 & 2032
- Table 39: Rest of Europe Novolac Resins Industry Revenue (Million) Forecast, by Application 2019 & 2032
- Table 40: Rest of Europe Novolac Resins Industry Volume ( g cm-3) Forecast, by Application 2019 & 2032
- Table 41: Global Novolac Resins Industry Revenue Million Forecast, by Country 2019 & 2032
- Table 42: Global Novolac Resins Industry Volume g cm-3 Forecast, by Country 2019 & 2032
- Table 43: Brazil Novolac Resins Industry Revenue (Million) Forecast, by Application 2019 & 2032
- Table 44: Brazil Novolac Resins Industry Volume ( g cm-3) Forecast, by Application 2019 & 2032
- Table 45: Argentina Novolac Resins Industry Revenue (Million) Forecast, by Application 2019 & 2032
- Table 46: Argentina Novolac Resins Industry Volume ( g cm-3) Forecast, by Application 2019 & 2032
- Table 47: Rest of South America Novolac Resins Industry Revenue (Million) Forecast, by Application 2019 & 2032
- Table 48: Rest of South America Novolac Resins Industry Volume ( g cm-3) Forecast, by Application 2019 & 2032
- Table 49: Global Novolac Resins Industry Revenue Million Forecast, by Country 2019 & 2032
- Table 50: Global Novolac Resins Industry Volume g cm-3 Forecast, by Country 2019 & 2032
- Table 51: Saudi Arabia Novolac Resins Industry Revenue (Million) Forecast, by Application 2019 & 2032
- Table 52: Saudi Arabia Novolac Resins Industry Volume ( g cm-3) Forecast, by Application 2019 & 2032
- Table 53: South Africa Novolac Resins Industry Revenue (Million) Forecast, by Application 2019 & 2032
- Table 54: South Africa Novolac Resins Industry Volume ( g cm-3) Forecast, by Application 2019 & 2032
- Table 55: Rest of Middle East and Africa Novolac Resins Industry Revenue (Million) Forecast, by Application 2019 & 2032
- Table 56: Rest of Middle East and Africa Novolac Resins Industry Volume ( g cm-3) Forecast, by Application 2019 & 2032
- Table 57: Global Novolac Resins Industry Revenue Million Forecast, by Form 2019 & 2032
- Table 58: Global Novolac Resins Industry Volume g cm-3 Forecast, by Form 2019 & 2032
- Table 59: Global Novolac Resins Industry Revenue Million Forecast, by End-User 2019 & 2032
- Table 60: Global Novolac Resins Industry Volume g cm-3 Forecast, by End-User 2019 & 2032
- Table 61: Global Novolac Resins Industry Revenue Million Forecast, by Country 2019 & 2032
- Table 62: Global Novolac Resins Industry Volume g cm-3 Forecast, by Country 2019 & 2032
- Table 63: China Novolac Resins Industry Revenue (Million) Forecast, by Application 2019 & 2032
- Table 64: China Novolac Resins Industry Volume ( g cm-3) Forecast, by Application 2019 & 2032
- Table 65: India Novolac Resins Industry Revenue (Million) Forecast, by Application 2019 & 2032
- Table 66: India Novolac Resins Industry Volume ( g cm-3) Forecast, by Application 2019 & 2032
- Table 67: Japan Novolac Resins Industry Revenue (Million) Forecast, by Application 2019 & 2032
- Table 68: Japan Novolac Resins Industry Volume ( g cm-3) Forecast, by Application 2019 & 2032
- Table 69: South Korea Novolac Resins Industry Revenue (Million) Forecast, by Application 2019 & 2032
- Table 70: South Korea Novolac Resins Industry Volume ( g cm-3) Forecast, by Application 2019 & 2032
- Table 71: Rest of Asia Pacific Novolac Resins Industry Revenue (Million) Forecast, by Application 2019 & 2032
- Table 72: Rest of Asia Pacific Novolac Resins Industry Volume ( g cm-3) Forecast, by Application 2019 & 2032
- Table 73: Global Novolac Resins Industry Revenue Million Forecast, by Form 2019 & 2032
- Table 74: Global Novolac Resins Industry Volume g cm-3 Forecast, by Form 2019 & 2032
- Table 75: Global Novolac Resins Industry Revenue Million Forecast, by End-User 2019 & 2032
- Table 76: Global Novolac Resins Industry Volume g cm-3 Forecast, by End-User 2019 & 2032
- Table 77: Global Novolac Resins Industry Revenue Million Forecast, by Country 2019 & 2032
- Table 78: Global Novolac Resins Industry Volume g cm-3 Forecast, by Country 2019 & 2032
- Table 79: United States Novolac Resins Industry Revenue (Million) Forecast, by Application 2019 & 2032
- Table 80: United States Novolac Resins Industry Volume ( g cm-3) Forecast, by Application 2019 & 2032
- Table 81: Canada Novolac Resins Industry Revenue (Million) Forecast, by Application 2019 & 2032
- Table 82: Canada Novolac Resins Industry Volume ( g cm-3) Forecast, by Application 2019 & 2032
- Table 83: Mexico Novolac Resins Industry Revenue (Million) Forecast, by Application 2019 & 2032
- Table 84: Mexico Novolac Resins Industry Volume ( g cm-3) Forecast, by Application 2019 & 2032
- Table 85: Global Novolac Resins Industry Revenue Million Forecast, by Form 2019 & 2032
- Table 86: Global Novolac Resins Industry Volume g cm-3 Forecast, by Form 2019 & 2032
- Table 87: Global Novolac Resins Industry Revenue Million Forecast, by End-User 2019 & 2032
- Table 88: Global Novolac Resins Industry Volume g cm-3 Forecast, by End-User 2019 & 2032
- Table 89: Global Novolac Resins Industry Revenue Million Forecast, by Country 2019 & 2032
- Table 90: Global Novolac Resins Industry Volume g cm-3 Forecast, by Country 2019 & 2032
- Table 91: Germany Novolac Resins Industry Revenue (Million) Forecast, by Application 2019 & 2032
- Table 92: Germany Novolac Resins Industry Volume ( g cm-3) Forecast, by Application 2019 & 2032
- Table 93: United Kingdom Novolac Resins Industry Revenue (Million) Forecast, by Application 2019 & 2032
- Table 94: United Kingdom Novolac Resins Industry Volume ( g cm-3) Forecast, by Application 2019 & 2032
- Table 95: France Novolac Resins Industry Revenue (Million) Forecast, by Application 2019 & 2032
- Table 96: France Novolac Resins Industry Volume ( g cm-3) Forecast, by Application 2019 & 2032
- Table 97: Italy Novolac Resins Industry Revenue (Million) Forecast, by Application 2019 & 2032
- Table 98: Italy Novolac Resins Industry Volume ( g cm-3) Forecast, by Application 2019 & 2032
- Table 99: Rest of Europe Novolac Resins Industry Revenue (Million) Forecast, by Application 2019 & 2032
- Table 100: Rest of Europe Novolac Resins Industry Volume ( g cm-3) Forecast, by Application 2019 & 2032
- Table 101: Global Novolac Resins Industry Revenue Million Forecast, by Form 2019 & 2032
- Table 102: Global Novolac Resins Industry Volume g cm-3 Forecast, by Form 2019 & 2032
- Table 103: Global Novolac Resins Industry Revenue Million Forecast, by End-User 2019 & 2032
- Table 104: Global Novolac Resins Industry Volume g cm-3 Forecast, by End-User 2019 & 2032
- Table 105: Global Novolac Resins Industry Revenue Million Forecast, by Country 2019 & 2032
- Table 106: Global Novolac Resins Industry Volume g cm-3 Forecast, by Country 2019 & 2032
- Table 107: Brazil Novolac Resins Industry Revenue (Million) Forecast, by Application 2019 & 2032
- Table 108: Brazil Novolac Resins Industry Volume ( g cm-3) Forecast, by Application 2019 & 2032
- Table 109: Argentina Novolac Resins Industry Revenue (Million) Forecast, by Application 2019 & 2032
- Table 110: Argentina Novolac Resins Industry Volume ( g cm-3) Forecast, by Application 2019 & 2032
- Table 111: Rest of South America Novolac Resins Industry Revenue (Million) Forecast, by Application 2019 & 2032
- Table 112: Rest of South America Novolac Resins Industry Volume ( g cm-3) Forecast, by Application 2019 & 2032
- Table 113: Global Novolac Resins Industry Revenue Million Forecast, by Form 2019 & 2032
- Table 114: Global Novolac Resins Industry Volume g cm-3 Forecast, by Form 2019 & 2032
- Table 115: Global Novolac Resins Industry Revenue Million Forecast, by End-User 2019 & 2032
- Table 116: Global Novolac Resins Industry Volume g cm-3 Forecast, by End-User 2019 & 2032
- Table 117: Global Novolac Resins Industry Revenue Million Forecast, by Country 2019 & 2032
- Table 118: Global Novolac Resins Industry Volume g cm-3 Forecast, by Country 2019 & 2032
- Table 119: Saudi Arabia Novolac Resins Industry Revenue (Million) Forecast, by Application 2019 & 2032
- Table 120: Saudi Arabia Novolac Resins Industry Volume ( g cm-3) Forecast, by Application 2019 & 2032
- Table 121: South Africa Novolac Resins Industry Revenue (Million) Forecast, by Application 2019 & 2032
- Table 122: South Africa Novolac Resins Industry Volume ( g cm-3) Forecast, by Application 2019 & 2032
- Table 123: Rest of Middle East and Africa Novolac Resins Industry Revenue (Million) Forecast, by Application 2019 & 2032
- Table 124: Rest of Middle East and Africa Novolac Resins Industry Volume ( g cm-3) Forecast, by Application 2019 & 2032
Frequently Asked Questions
1. What is the projected Compound Annual Growth Rate (CAGR) of the Novolac Resins Industry?
The projected CAGR is approximately > 4.00%.
2. Which companies are prominent players in the Novolac Resins Industry?
Key companies in the market include KANGNAM CHEMICAL, Georgia-Pacific Chemicals, Mitsui Chemicals Inc, Gunei Chemical Industry Co Ltd, BASF SE, Hexion, SBHPP, DIC CORPORATION.
3. What are the main segments of the Novolac Resins Industry?
The market segments include Form, End-User.
4. Can you provide details about the market size?
The market size is estimated to be USD XX Million as of 2022.
5. What are some drivers contributing to market growth?
; High Demand for Fuel Efficient Light Vehicles; Increasing Demand from the Consumer Electronics.
6. What are the notable trends driving market growth?
High Demand from Automotive Segment to Boost Novolac Resins Market.
7. Are there any restraints impacting market growth?
; Unfavorable Conditions Arising Due to COVID-19 Outbreak; Other Restraints.
8. Can you provide examples of recent developments in the market?
N/A
9. What pricing options are available for accessing the report?
Pricing options include single-user, multi-user, and enterprise licenses priced at USD 4750, USD 5250, and USD 8750 respectively.
10. Is the market size provided in terms of value or volume?
The market size is provided in terms of value, measured in Million and volume, measured in g cm-3.
11. Are there any specific market keywords associated with the report?
Yes, the market keyword associated with the report is "Novolac Resins Industry," which aids in identifying and referencing the specific market segment covered.
12. How do I determine which pricing option suits my needs best?
The pricing options vary based on user requirements and access needs. Individual users may opt for single-user licenses, while businesses requiring broader access may choose multi-user or enterprise licenses for cost-effective access to the report.
13. Are there any additional resources or data provided in the Novolac Resins Industry report?
While the report offers comprehensive insights, it's advisable to review the specific contents or supplementary materials provided to ascertain if additional resources or data are available.
14. How can I stay updated on further developments or reports in the Novolac Resins Industry?
To stay informed about further developments, trends, and reports in the Novolac Resins Industry, consider subscribing to industry newsletters, following relevant companies and organizations, or regularly checking reputable industry news sources and publications.
Methodology
Step 1 - Identification of Relevant Samples Size from Population Database


Step 2 - Approaches for Defining Global Market Size (Value, Volume* & Price*)

Note*: In applicable scenarios
Step 3 - Data Sources
Primary Research
- Web Analytics
- Survey Reports
- Research Institute
- Latest Research Reports
- Opinion Leaders
Secondary Research
- Annual Reports
- White Paper
- Latest Press Release
- Industry Association
- Paid Database
- Investor Presentations

Step 4 - Data Triangulation
Involves using different sources of information in order to increase the validity of a study
These sources are likely to be stakeholders in a program - participants, other researchers, program staff, other community members, and so on.
Then we put all data in single framework & apply various statistical tools to find out the dynamic on the market.
During the analysis stage, feedback from the stakeholder groups would be compared to determine areas of agreement as well as areas of divergence


