
Key Insights
The North African battery market, while currently smaller than other global regions, exhibits significant growth potential fueled by a burgeoning automotive sector, expanding industrialization, and increasing demand for portable power solutions. The market's Compound Annual Growth Rate (CAGR) exceeding 9% suggests robust expansion over the forecast period (2025-2033). Key drivers include rising electrification initiatives within the automotive industry, the increasing adoption of renewable energy sources (solar and wind) requiring energy storage, and the growing demand for backup power in both residential and commercial settings. Lithium-ion batteries are expected to dominate the market due to their higher energy density and longer lifespan, although lead-acid batteries will continue to hold a substantial share, particularly in the industrial and automotive sectors due to their cost-effectiveness. However, challenges exist, including limited battery manufacturing capacity within the region, reliance on imports, and potential supply chain vulnerabilities. Further growth will be contingent on investments in local manufacturing facilities, development of robust recycling infrastructure, and supportive government policies promoting sustainable energy solutions.
The segmentation of the North African battery market reveals a dynamic landscape. The automotive battery segment is projected to experience the fastest growth, driven by increasing vehicle production and government regulations favoring electric vehicles. Industrial battery demand is driven by infrastructure projects and the manufacturing sector. Portable batteries will likely see steady growth fueled by rising smartphone and laptop usage. Competition is intensifying with both international players and regional companies vying for market share. Key players are likely focusing on strategic partnerships, technological advancements, and localization efforts to capitalize on the expanding market opportunities. The successful navigation of infrastructural challenges and regulatory hurdles will significantly impact the market's trajectory. Sustainable growth will require a holistic approach encompassing technological innovation, investment in local manufacturing, and environmentally responsible disposal practices.
North Africa Battery Industry: Market Analysis & Forecast 2019-2033
This comprehensive report delivers an in-depth analysis of the North Africa battery industry, encompassing market dynamics, growth trends, key players, and future outlook. With a focus on primary and secondary batteries, including Lithium-ion, Lead-acid, and other technologies, this report provides crucial insights for industry professionals, investors, and strategic decision-makers. The study period covers 2019-2033, with a base year of 2025 and a forecast period of 2025-2033.
North Africa Battery Industry Market Dynamics & Structure
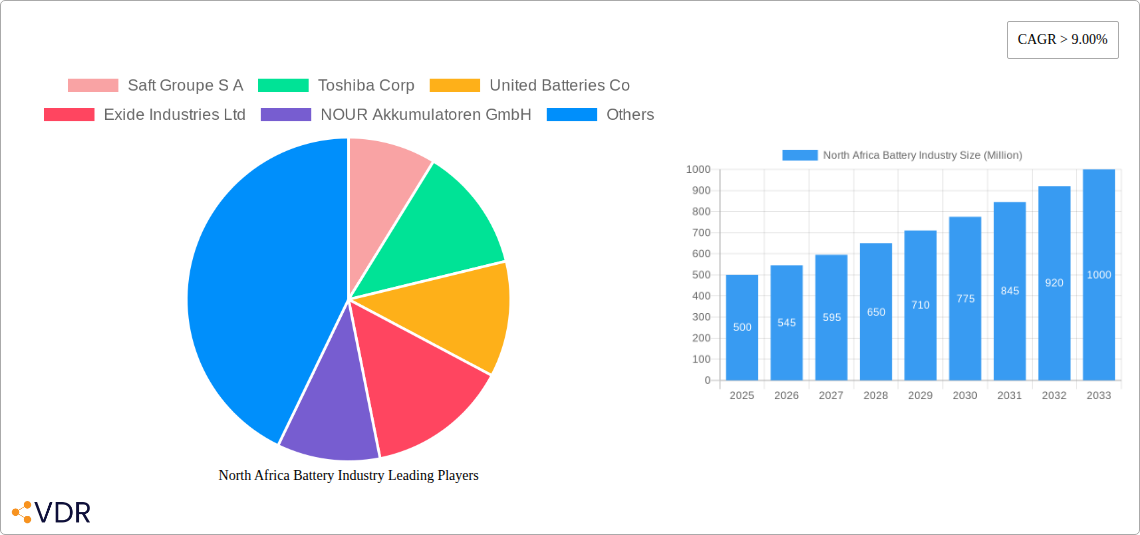
The North Africa battery market is characterized by a moderate level of concentration, with key players including Saft Groupe S A, Toshiba Corp, United Batteries Co, Exide Industries Ltd, NOUR Akkumulatoren GmbH, Duracell Inc, Murata Manufacturing Co Ltd, EL-Nisr Company, Panasonic Corporation, and Chloride Egypt S A E. However, the market also features numerous smaller, regional players.
Technological innovation, particularly in lithium-ion battery technology, is a key driver. Regulatory frameworks focused on renewable energy integration and electric vehicle adoption are significantly influencing market growth. Lead-acid batteries remain dominant in certain applications, facing competition from increasingly cost-competitive lithium-ion alternatives.
- Market Concentration: Moderate, with a few major players and many smaller regional companies. Market share data for 2024: xx% for top 3 players.
- Technological Innovation: Strong focus on Lithium-ion batteries, driven by EV adoption and renewable energy storage needs.
- Regulatory Framework: Growing emphasis on renewable energy and environmental regulations is boosting demand for advanced battery technologies.
- Competitive Substitutes: Lead-acid batteries remain a significant competitor, especially in automotive applications.
- M&A Activity: A moderate level of M&A activity is expected, driven by the consolidation of smaller players and expansion into new markets. Estimated 2019-2024 M&A deal volume: xx deals.
- End-User Demographics: The automotive and industrial sectors are major end-users, with increasing demand from the renewable energy sector.
North Africa Battery Industry Growth Trends & Insights
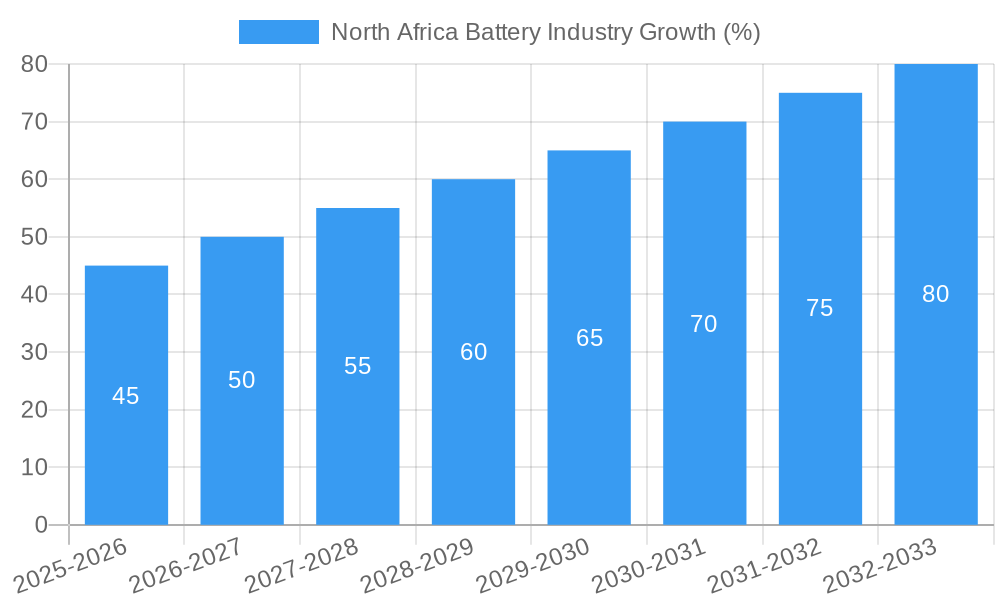
The North Africa battery market is experiencing robust growth, driven by rising demand across various sectors. The market size increased from xx Million units in 2019 to xx Million units in 2024 and is projected to reach xx Million units by 2025 and xx Million units by 2033. This growth is fueled by the increasing adoption of renewable energy sources, the expanding electric vehicle market, and the growing demand for portable electronic devices. Technological advancements in battery technology, particularly the improved energy density and cost-effectiveness of Lithium-ion batteries, are further driving market expansion. Consumer behavior shifts towards environmentally friendly products are also supporting growth. The CAGR for the forecast period (2025-2033) is estimated to be xx%. Market penetration of Lithium-ion batteries is projected to increase from xx% in 2024 to xx% by 2033.
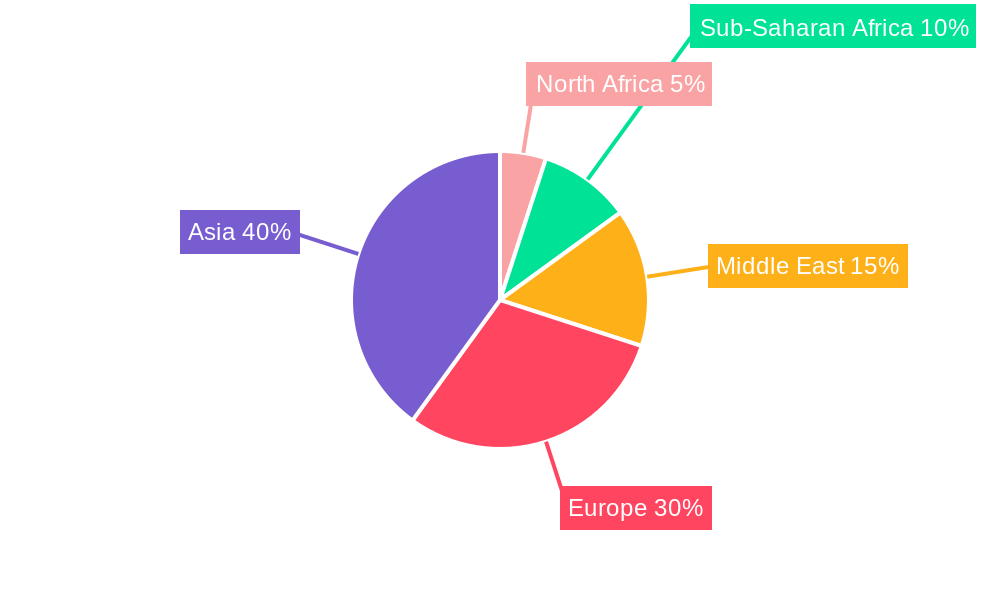
Dominant Regions, Countries, or Segments in North Africa Battery Industry
Egypt is currently the leading market for batteries in North Africa, driven by its relatively developed automotive and industrial sectors. The secondary battery segment (including lead-acid and lithium-ion) is dominating overall market share (xx%), significantly outpacing the primary battery segment. Within battery technologies, lead-acid batteries still maintain a substantial market share, driven by its established presence in automotive applications, while the lithium-ion segment is witnessing the fastest growth rate due to its increasing demand in renewable energy storage and electric vehicles. The automotive battery application segment is the largest contributor to market revenue, followed by industrial batteries.
- Key Drivers in Egypt: Strong automotive sector, growing renewable energy infrastructure projects, government support for electric vehicle adoption.
- Key Drivers in Morocco: Expanding industrial sector, increased investment in renewable energy projects.
- Key Drivers in Algeria: Relatively large automotive market, potential for growth in renewable energy storage.
North Africa Battery Industry Product Landscape
The North African battery market offers a range of products, from traditional lead-acid batteries to advanced lithium-ion batteries. Innovations are focused on improving energy density, cycle life, and safety features. The increasing demand for electric vehicles and energy storage solutions is driving the development of high-performance lithium-ion batteries with longer lifespans and improved thermal management. Unique selling propositions include enhanced safety features, optimized performance for specific applications, and extended warranties.
Key Drivers, Barriers & Challenges in North Africa Battery Industry
Key Drivers:
- Increasing adoption of renewable energy, particularly solar and wind power, driving demand for energy storage solutions.
- Growing electric vehicle (EV) market and government incentives promoting EV adoption.
- Expansion of the industrial sector and increasing demand for industrial batteries.
Key Challenges:
- High initial costs associated with lithium-ion batteries compared to lead-acid batteries, impacting adoption rate.
- Supply chain disruptions and raw material price volatility.
- Limited local manufacturing capabilities for advanced battery technologies. This leads to higher import costs and dependency on external suppliers. xx% of batteries are currently imported.
Emerging Opportunities in North Africa Battery Industry
- Untapped potential in the renewable energy sector, particularly in remote areas with limited grid access.
- Growing demand for energy storage systems in microgrids and off-grid applications.
- Opportunities for investment in battery manufacturing and recycling facilities to address supply chain challenges.
- Increasing adoption of hybrid and electric vehicles creates substantial opportunities for automotive battery providers.
Growth Accelerators in the North Africa Battery Industry Industry
Technological advancements in battery technology, particularly improvements in energy density and cost-effectiveness of lithium-ion batteries, are key growth accelerators. Strategic partnerships between battery manufacturers, renewable energy companies, and automotive OEMs will play a crucial role. Government policies supporting renewable energy adoption and electric vehicle market development will further stimulate growth. Expansion of the battery recycling infrastructure is vital for environmental sustainability and resource management.
Key Players Shaping the North Africa Battery Industry Market
- Saft Groupe S A
- Toshiba Corp
- United Batteries Co
- Exide Industries Ltd
- NOUR Akkumulatoren GmbH
- Duracell Inc
- Murata Manufacturing Co Ltd
- EL-Nisr Company
- Panasonic Corporation
- Chloride Egypt S A E
Notable Milestones in North Africa Battery Industry Sector
- October 2022: KarmSolar secures USD 2.4 million in bank financing for a solar-plus-storage project in Egypt, involving a 1MW/3.957MWh energy storage system. This highlights the growing investment in renewable energy storage solutions in the region.
In-Depth North Africa Battery Industry Market Outlook
The North Africa battery market is poised for significant growth over the next decade, driven by strong demand from the renewable energy and electric vehicle sectors. Strategic partnerships, investment in manufacturing capacity, and supportive government policies will be crucial for realizing this potential. Opportunities exist for both established players and new entrants to capitalize on the expanding market for advanced battery technologies and energy storage solutions. The focus on sustainability and environmental regulations will further drive adoption of advanced batteries and efficient recycling technologies.
North Africa Battery Industry Segmentation
-
1. Type
- 1.1. Primary Battery
- 1.2. Secondary Battery
-
2. Technology
- 2.1. Lithium-ion Battery
- 2.2. Lead-acid Battery
- 2.3. Others
-
3. Application
- 3.1. Automotive Batteries
- 3.2. Industrial Batteries
- 3.3. Portable Batteries
- 3.4. Others
-
4. Geography
- 4.1. Egypt
- 4.2. Algeria
- 4.3. Rest of North Africa
North Africa Battery Industry Segmentation By Geography
- 1. Egypt
- 2. Algeria
- 3. Rest of North Africa
North Africa Battery Industry REPORT HIGHLIGHTS
| Aspects | Details |
|---|---|
| Study Period | 2019-2033 |
| Base Year | 2024 |
| Estimated Year | 2025 |
| Forecast Period | 2025-2033 |
| Historical Period | 2019-2024 |
| Growth Rate | CAGR of > 9.00% from 2019-2033 |
| Segmentation |
|
Table of Contents
- 1. Introduction
- 1.1. Research Scope
- 1.2. Market Segmentation
- 1.3. Research Methodology
- 1.4. Definitions and Assumptions
- 2. Executive Summary
- 2.1. Introduction
- 3. Market Dynamics
- 3.1. Introduction
- 3.2. Market Drivers
- 3.2.1. 4.; Growing Uses of Natural Gas in Various Sectors
- 3.3. Market Restrains
- 3.3.1. 4.; Volatile Natural Gas Prices
- 3.4. Market Trends
- 3.4.1. Lithium-ion Batteries to Dominate the Market Growth
- 4. Market Factor Analysis
- 4.1. Porters Five Forces
- 4.2. Supply/Value Chain
- 4.3. PESTEL analysis
- 4.4. Market Entropy
- 4.5. Patent/Trademark Analysis
- 5. North Africa Battery Industry Analysis, Insights and Forecast, 2019-2031
- 5.1. Market Analysis, Insights and Forecast - by Type
- 5.1.1. Primary Battery
- 5.1.2. Secondary Battery
- 5.2. Market Analysis, Insights and Forecast - by Technology
- 5.2.1. Lithium-ion Battery
- 5.2.2. Lead-acid Battery
- 5.2.3. Others
- 5.3. Market Analysis, Insights and Forecast - by Application
- 5.3.1. Automotive Batteries
- 5.3.2. Industrial Batteries
- 5.3.3. Portable Batteries
- 5.3.4. Others
- 5.4. Market Analysis, Insights and Forecast - by Geography
- 5.4.1. Egypt
- 5.4.2. Algeria
- 5.4.3. Rest of North Africa
- 5.5. Market Analysis, Insights and Forecast - by Region
- 5.5.1. Egypt
- 5.5.2. Algeria
- 5.5.3. Rest of North Africa
- 5.1. Market Analysis, Insights and Forecast - by Type
- 6. Egypt North Africa Battery Industry Analysis, Insights and Forecast, 2019-2031
- 6.1. Market Analysis, Insights and Forecast - by Type
- 6.1.1. Primary Battery
- 6.1.2. Secondary Battery
- 6.2. Market Analysis, Insights and Forecast - by Technology
- 6.2.1. Lithium-ion Battery
- 6.2.2. Lead-acid Battery
- 6.2.3. Others
- 6.3. Market Analysis, Insights and Forecast - by Application
- 6.3.1. Automotive Batteries
- 6.3.2. Industrial Batteries
- 6.3.3. Portable Batteries
- 6.3.4. Others
- 6.4. Market Analysis, Insights and Forecast - by Geography
- 6.4.1. Egypt
- 6.4.2. Algeria
- 6.4.3. Rest of North Africa
- 6.1. Market Analysis, Insights and Forecast - by Type
- 7. Algeria North Africa Battery Industry Analysis, Insights and Forecast, 2019-2031
- 7.1. Market Analysis, Insights and Forecast - by Type
- 7.1.1. Primary Battery
- 7.1.2. Secondary Battery
- 7.2. Market Analysis, Insights and Forecast - by Technology
- 7.2.1. Lithium-ion Battery
- 7.2.2. Lead-acid Battery
- 7.2.3. Others
- 7.3. Market Analysis, Insights and Forecast - by Application
- 7.3.1. Automotive Batteries
- 7.3.2. Industrial Batteries
- 7.3.3. Portable Batteries
- 7.3.4. Others
- 7.4. Market Analysis, Insights and Forecast - by Geography
- 7.4.1. Egypt
- 7.4.2. Algeria
- 7.4.3. Rest of North Africa
- 7.1. Market Analysis, Insights and Forecast - by Type
- 8. Rest of North Africa North Africa Battery Industry Analysis, Insights and Forecast, 2019-2031
- 8.1. Market Analysis, Insights and Forecast - by Type
- 8.1.1. Primary Battery
- 8.1.2. Secondary Battery
- 8.2. Market Analysis, Insights and Forecast - by Technology
- 8.2.1. Lithium-ion Battery
- 8.2.2. Lead-acid Battery
- 8.2.3. Others
- 8.3. Market Analysis, Insights and Forecast - by Application
- 8.3.1. Automotive Batteries
- 8.3.2. Industrial Batteries
- 8.3.3. Portable Batteries
- 8.3.4. Others
- 8.4. Market Analysis, Insights and Forecast - by Geography
- 8.4.1. Egypt
- 8.4.2. Algeria
- 8.4.3. Rest of North Africa
- 8.1. Market Analysis, Insights and Forecast - by Type
- 9. South Africa North Africa Battery Industry Analysis, Insights and Forecast, 2019-2031
- 10. Sudan North Africa Battery Industry Analysis, Insights and Forecast, 2019-2031
- 11. Uganda North Africa Battery Industry Analysis, Insights and Forecast, 2019-2031
- 12. Tanzania North Africa Battery Industry Analysis, Insights and Forecast, 2019-2031
- 13. Kenya North Africa Battery Industry Analysis, Insights and Forecast, 2019-2031
- 14. Rest of Africa North Africa Battery Industry Analysis, Insights and Forecast, 2019-2031
- 15. Competitive Analysis
- 15.1. Market Share Analysis 2024
- 15.2. Company Profiles
- 15.2.1 Saft Groupe S A
- 15.2.1.1. Overview
- 15.2.1.2. Products
- 15.2.1.3. SWOT Analysis
- 15.2.1.4. Recent Developments
- 15.2.1.5. Financials (Based on Availability)
- 15.2.2 Toshiba Corp
- 15.2.2.1. Overview
- 15.2.2.2. Products
- 15.2.2.3. SWOT Analysis
- 15.2.2.4. Recent Developments
- 15.2.2.5. Financials (Based on Availability)
- 15.2.3 United Batteries Co
- 15.2.3.1. Overview
- 15.2.3.2. Products
- 15.2.3.3. SWOT Analysis
- 15.2.3.4. Recent Developments
- 15.2.3.5. Financials (Based on Availability)
- 15.2.4 Exide Industries Ltd
- 15.2.4.1. Overview
- 15.2.4.2. Products
- 15.2.4.3. SWOT Analysis
- 15.2.4.4. Recent Developments
- 15.2.4.5. Financials (Based on Availability)
- 15.2.5 NOUR Akkumulatoren GmbH
- 15.2.5.1. Overview
- 15.2.5.2. Products
- 15.2.5.3. SWOT Analysis
- 15.2.5.4. Recent Developments
- 15.2.5.5. Financials (Based on Availability)
- 15.2.6 Duracell Inc*List Not Exhaustive
- 15.2.6.1. Overview
- 15.2.6.2. Products
- 15.2.6.3. SWOT Analysis
- 15.2.6.4. Recent Developments
- 15.2.6.5. Financials (Based on Availability)
- 15.2.7 Murata Manufacturing Co Ltd
- 15.2.7.1. Overview
- 15.2.7.2. Products
- 15.2.7.3. SWOT Analysis
- 15.2.7.4. Recent Developments
- 15.2.7.5. Financials (Based on Availability)
- 15.2.8 EL-Nisr Company
- 15.2.8.1. Overview
- 15.2.8.2. Products
- 15.2.8.3. SWOT Analysis
- 15.2.8.4. Recent Developments
- 15.2.8.5. Financials (Based on Availability)
- 15.2.9 Panasonic Corporation
- 15.2.9.1. Overview
- 15.2.9.2. Products
- 15.2.9.3. SWOT Analysis
- 15.2.9.4. Recent Developments
- 15.2.9.5. Financials (Based on Availability)
- 15.2.10 Chloride Egypt S A E
- 15.2.10.1. Overview
- 15.2.10.2. Products
- 15.2.10.3. SWOT Analysis
- 15.2.10.4. Recent Developments
- 15.2.10.5. Financials (Based on Availability)
- 15.2.1 Saft Groupe S A
List of Figures
- Figure 1: North Africa Battery Industry Revenue Breakdown (Million, %) by Product 2024 & 2032
- Figure 2: North Africa Battery Industry Share (%) by Company 2024
List of Tables
- Table 1: North Africa Battery Industry Revenue Million Forecast, by Region 2019 & 2032
- Table 2: North Africa Battery Industry Volume K Tons Forecast, by Region 2019 & 2032
- Table 3: North Africa Battery Industry Revenue Million Forecast, by Type 2019 & 2032
- Table 4: North Africa Battery Industry Volume K Tons Forecast, by Type 2019 & 2032
- Table 5: North Africa Battery Industry Revenue Million Forecast, by Technology 2019 & 2032
- Table 6: North Africa Battery Industry Volume K Tons Forecast, by Technology 2019 & 2032
- Table 7: North Africa Battery Industry Revenue Million Forecast, by Application 2019 & 2032
- Table 8: North Africa Battery Industry Volume K Tons Forecast, by Application 2019 & 2032
- Table 9: North Africa Battery Industry Revenue Million Forecast, by Geography 2019 & 2032
- Table 10: North Africa Battery Industry Volume K Tons Forecast, by Geography 2019 & 2032
- Table 11: North Africa Battery Industry Revenue Million Forecast, by Region 2019 & 2032
- Table 12: North Africa Battery Industry Volume K Tons Forecast, by Region 2019 & 2032
- Table 13: North Africa Battery Industry Revenue Million Forecast, by Country 2019 & 2032
- Table 14: North Africa Battery Industry Volume K Tons Forecast, by Country 2019 & 2032
- Table 15: South Africa North Africa Battery Industry Revenue (Million) Forecast, by Application 2019 & 2032
- Table 16: South Africa North Africa Battery Industry Volume (K Tons) Forecast, by Application 2019 & 2032
- Table 17: Sudan North Africa Battery Industry Revenue (Million) Forecast, by Application 2019 & 2032
- Table 18: Sudan North Africa Battery Industry Volume (K Tons) Forecast, by Application 2019 & 2032
- Table 19: Uganda North Africa Battery Industry Revenue (Million) Forecast, by Application 2019 & 2032
- Table 20: Uganda North Africa Battery Industry Volume (K Tons) Forecast, by Application 2019 & 2032
- Table 21: Tanzania North Africa Battery Industry Revenue (Million) Forecast, by Application 2019 & 2032
- Table 22: Tanzania North Africa Battery Industry Volume (K Tons) Forecast, by Application 2019 & 2032
- Table 23: Kenya North Africa Battery Industry Revenue (Million) Forecast, by Application 2019 & 2032
- Table 24: Kenya North Africa Battery Industry Volume (K Tons) Forecast, by Application 2019 & 2032
- Table 25: Rest of Africa North Africa Battery Industry Revenue (Million) Forecast, by Application 2019 & 2032
- Table 26: Rest of Africa North Africa Battery Industry Volume (K Tons) Forecast, by Application 2019 & 2032
- Table 27: North Africa Battery Industry Revenue Million Forecast, by Type 2019 & 2032
- Table 28: North Africa Battery Industry Volume K Tons Forecast, by Type 2019 & 2032
- Table 29: North Africa Battery Industry Revenue Million Forecast, by Technology 2019 & 2032
- Table 30: North Africa Battery Industry Volume K Tons Forecast, by Technology 2019 & 2032
- Table 31: North Africa Battery Industry Revenue Million Forecast, by Application 2019 & 2032
- Table 32: North Africa Battery Industry Volume K Tons Forecast, by Application 2019 & 2032
- Table 33: North Africa Battery Industry Revenue Million Forecast, by Geography 2019 & 2032
- Table 34: North Africa Battery Industry Volume K Tons Forecast, by Geography 2019 & 2032
- Table 35: North Africa Battery Industry Revenue Million Forecast, by Country 2019 & 2032
- Table 36: North Africa Battery Industry Volume K Tons Forecast, by Country 2019 & 2032
- Table 37: North Africa Battery Industry Revenue Million Forecast, by Type 2019 & 2032
- Table 38: North Africa Battery Industry Volume K Tons Forecast, by Type 2019 & 2032
- Table 39: North Africa Battery Industry Revenue Million Forecast, by Technology 2019 & 2032
- Table 40: North Africa Battery Industry Volume K Tons Forecast, by Technology 2019 & 2032
- Table 41: North Africa Battery Industry Revenue Million Forecast, by Application 2019 & 2032
- Table 42: North Africa Battery Industry Volume K Tons Forecast, by Application 2019 & 2032
- Table 43: North Africa Battery Industry Revenue Million Forecast, by Geography 2019 & 2032
- Table 44: North Africa Battery Industry Volume K Tons Forecast, by Geography 2019 & 2032
- Table 45: North Africa Battery Industry Revenue Million Forecast, by Country 2019 & 2032
- Table 46: North Africa Battery Industry Volume K Tons Forecast, by Country 2019 & 2032
- Table 47: North Africa Battery Industry Revenue Million Forecast, by Type 2019 & 2032
- Table 48: North Africa Battery Industry Volume K Tons Forecast, by Type 2019 & 2032
- Table 49: North Africa Battery Industry Revenue Million Forecast, by Technology 2019 & 2032
- Table 50: North Africa Battery Industry Volume K Tons Forecast, by Technology 2019 & 2032
- Table 51: North Africa Battery Industry Revenue Million Forecast, by Application 2019 & 2032
- Table 52: North Africa Battery Industry Volume K Tons Forecast, by Application 2019 & 2032
- Table 53: North Africa Battery Industry Revenue Million Forecast, by Geography 2019 & 2032
- Table 54: North Africa Battery Industry Volume K Tons Forecast, by Geography 2019 & 2032
- Table 55: North Africa Battery Industry Revenue Million Forecast, by Country 2019 & 2032
- Table 56: North Africa Battery Industry Volume K Tons Forecast, by Country 2019 & 2032
Frequently Asked Questions
1. What is the projected Compound Annual Growth Rate (CAGR) of the North Africa Battery Industry?
The projected CAGR is approximately > 9.00%.
2. Which companies are prominent players in the North Africa Battery Industry?
Key companies in the market include Saft Groupe S A, Toshiba Corp, United Batteries Co, Exide Industries Ltd, NOUR Akkumulatoren GmbH, Duracell Inc*List Not Exhaustive, Murata Manufacturing Co Ltd, EL-Nisr Company, Panasonic Corporation, Chloride Egypt S A E.
3. What are the main segments of the North Africa Battery Industry?
The market segments include Type, Technology, Application, Geography.
4. Can you provide details about the market size?
The market size is estimated to be USD XX Million as of 2022.
5. What are some drivers contributing to market growth?
4.; Growing Uses of Natural Gas in Various Sectors.
6. What are the notable trends driving market growth?
Lithium-ion Batteries to Dominate the Market Growth.
7. Are there any restraints impacting market growth?
4.; Volatile Natural Gas Prices.
8. Can you provide examples of recent developments in the market?
October 2022: KarmSolar has secured USD 2.4 million in bank financing for a solar-plus-storage project in Egypt. The funds will be used for Phase 2 expansion of the company's existing solar microgrid system for Cairo 3A Poultry's farm in the Bahareya Oasis in Giza, Egypt. The energy storage system will comprise a 2.576MWp PV inverter and 1MW/3.957MWh storage.
9. What pricing options are available for accessing the report?
Pricing options include single-user, multi-user, and enterprise licenses priced at USD 4750, USD 5250, and USD 8750 respectively.
10. Is the market size provided in terms of value or volume?
The market size is provided in terms of value, measured in Million and volume, measured in K Tons.
11. Are there any specific market keywords associated with the report?
Yes, the market keyword associated with the report is "North Africa Battery Industry," which aids in identifying and referencing the specific market segment covered.
12. How do I determine which pricing option suits my needs best?
The pricing options vary based on user requirements and access needs. Individual users may opt for single-user licenses, while businesses requiring broader access may choose multi-user or enterprise licenses for cost-effective access to the report.
13. Are there any additional resources or data provided in the North Africa Battery Industry report?
While the report offers comprehensive insights, it's advisable to review the specific contents or supplementary materials provided to ascertain if additional resources or data are available.
14. How can I stay updated on further developments or reports in the North Africa Battery Industry?
To stay informed about further developments, trends, and reports in the North Africa Battery Industry, consider subscribing to industry newsletters, following relevant companies and organizations, or regularly checking reputable industry news sources and publications.
Methodology
Step 1 - Identification of Relevant Samples Size from Population Database


Step 2 - Approaches for Defining Global Market Size (Value, Volume* & Price*)

Note*: In applicable scenarios
Step 3 - Data Sources
Primary Research
- Web Analytics
- Survey Reports
- Research Institute
- Latest Research Reports
- Opinion Leaders
Secondary Research
- Annual Reports
- White Paper
- Latest Press Release
- Industry Association
- Paid Database
- Investor Presentations

Step 4 - Data Triangulation
Involves using different sources of information in order to increase the validity of a study
These sources are likely to be stakeholders in a program - participants, other researchers, program staff, other community members, and so on.
Then we put all data in single framework & apply various statistical tools to find out the dynamic on the market.
During the analysis stage, feedback from the stakeholder groups would be compared to determine areas of agreement as well as areas of divergence


