

Key Insights
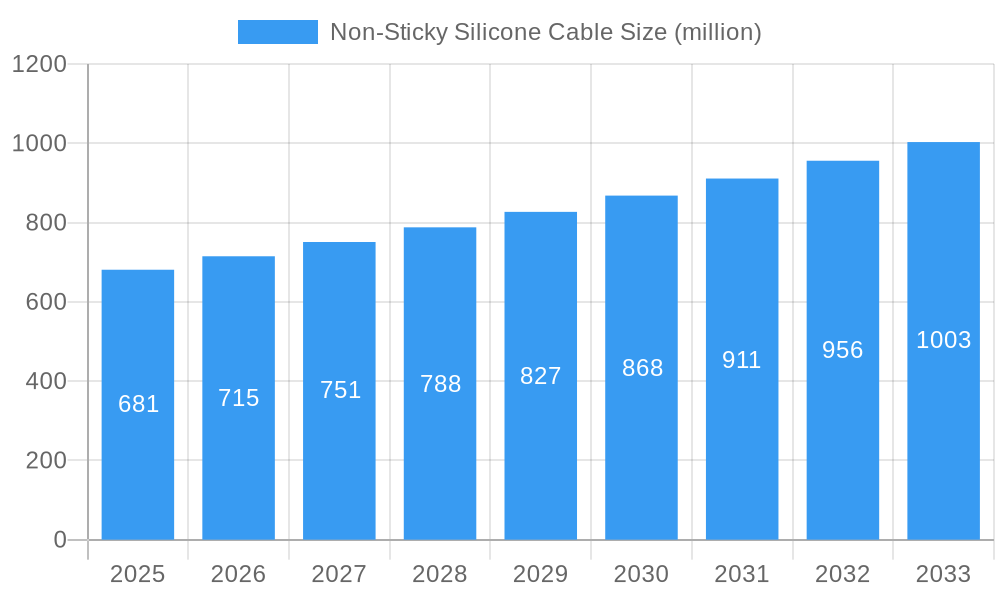
The non-sticky silicone cable market, valued at $681 million in 2025, is projected to experience steady growth, driven by increasing demand across various sectors. The 5% CAGR indicates a robust expansion over the forecast period (2025-2033), primarily fueled by the rising adoption of silicone cables in high-temperature applications within the automotive, aerospace, and industrial automation industries. These sectors benefit from silicone's superior heat resistance, flexibility, and durability compared to traditional alternatives. Furthermore, the increasing focus on safety and reliability in critical applications is further bolstering market growth. While specific restraining factors are not detailed, potential challenges could include the relatively higher cost of silicone cables compared to other materials and the potential for material sourcing constraints impacting production.
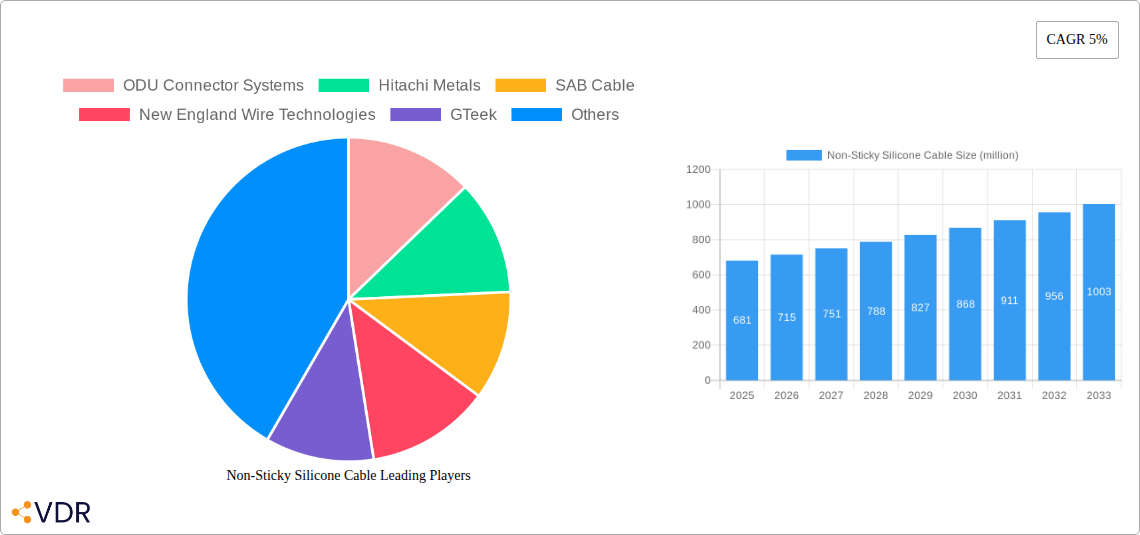
Non-Sticky Silicone Cable Market Size (In Million)
Growth within the non-sticky silicone cable market is expected to be geographically diverse. North America and Europe are likely to maintain significant market share, driven by established industrial bases and stringent regulatory requirements for safety. However, rapidly developing economies in Asia-Pacific, particularly China and India, are poised to witness substantial growth, fueled by increasing industrialization and infrastructure development. Key players such as ODU Connector Systems, Hitachi Metals, SAB Cable, New England Wire Technologies, GTeek, and HEW-KABEL are expected to remain significant competitors, investing in research and development to enhance product offerings and expand their market reach. Competitive landscape dynamics will likely center on innovation in material formulation, cost optimization, and expanding product portfolios to cater to the diverse needs of various industry verticals.
Non-Sticky Silicone Cable Company Market Share
Non-Sticky Silicone Cable Market Report: A Comprehensive Analysis (2019-2033)
This comprehensive report provides a detailed analysis of the Non-Sticky Silicone Cable market, encompassing market dynamics, growth trends, regional segmentation, product landscape, key players, and future outlook. The report covers the period from 2019 to 2033, with a focus on the forecast period of 2025-2033 and a base year of 2025. The study covers the parent market of industrial cables and the child market of specialty cables. Market size is expressed in million units.
Parent Market: Industrial Cables Child Market: Specialty Cables (Including Non-Sticky Silicone Cables)
Non-Sticky Silicone Cable Market Dynamics & Structure
This section analyzes the competitive landscape, technological advancements, regulatory influences, and market trends within the non-sticky silicone cable industry. The market exhibits moderate concentration, with key players holding significant, but not dominant, market shares. Technological innovation, driven by the need for improved heat resistance, flexibility, and durability, is a major driver. Stringent safety and environmental regulations impact material sourcing and manufacturing processes. Substitutes include other high-performance cables (e.g., PTFE, PFA), but silicone cables maintain an advantage in specific applications due to their unique properties. M&A activity is expected to remain moderate, primarily focused on expanding geographical reach and product portfolios.
- Market Concentration: Moderately concentrated, with top 5 players holding approximately xx% market share in 2025.
- Technological Innovation: Focus on improved heat resistance, flexibility, and biocompatibility.
- Regulatory Framework: Compliance with safety and environmental standards drives manufacturing practices.
- Competitive Substitutes: PTFE, PFA, and other specialized cable types.
- End-User Demographics: Primarily industrial sectors like automotive, aerospace, and medical.
- M&A Trends: Moderate activity, driven by geographic expansion and product diversification; approximately xx deals anticipated between 2025-2033.
Non-Sticky Silicone Cable Growth Trends & Insights
The Non-Sticky Silicone Cable market is projected to experience steady growth throughout the forecast period (2025-2033). Driven by increasing demand across diverse sectors, particularly in automotive and medical applications, the market is expected to expand at a CAGR of xx% during this period. Adoption rates are increasing as the benefits of non-sticky silicone cables, such as improved insulation and ease of handling, become widely recognized. Technological disruptions, such as advancements in material science and manufacturing processes, are further fueling this growth. Consumer behavior is shifting toward preference for high-performance, reliable, and environmentally friendly cables, bolstering demand for this product.
- Market Size (Million Units): 2019: xx; 2025: xx; 2033: xx
- CAGR (2025-2033): xx%
- Market Penetration (2025): xx%
- Key Adoption Drivers: Enhanced performance characteristics, improved ease of use, and increasing regulatory compliance needs.
Dominant Regions, Countries, or Segments in Non-Sticky Silicone Cable
North America currently holds the largest market share for non-sticky silicone cables, driven by strong demand from the automotive and aerospace industries. However, Asia-Pacific is projected to experience the fastest growth during the forecast period, due to rapid industrialization and infrastructure development. The automotive and medical sectors are key drivers in both regions. Europe maintains a significant market share, albeit with slower growth compared to Asia-Pacific, reflecting the region's mature industrial landscape.
- North America: High demand from automotive and aerospace, established manufacturing base.
- Asia-Pacific: Fastest-growing region, fueled by industrialization and infrastructure development.
- Europe: Mature market with steady growth driven by increasing adoption in medical and industrial applications.
- Market Share (2025): North America: xx%; Asia-Pacific: xx%; Europe: xx%; Rest of World: xx%
Non-Sticky Silicone Cable Product Landscape
Non-sticky silicone cables offer superior performance compared to traditional silicone cables, eliminating the issues of adhesion and sticking. This is achieved through advanced silicone formulations and manufacturing processes. Innovations focus on enhancing thermal stability, flexibility at low temperatures, and biocompatibility for medical applications. Applications range from automotive wiring harnesses to medical devices, highlighting the versatility of this specialized cable. Key performance metrics include temperature range, flexibility, dielectric strength, and durability.
Key Drivers, Barriers & Challenges in Non-Sticky Silicone Cable
Key Drivers: The market is propelled by increasing demand from automotive and medical sectors, stringent safety regulations favoring high-performance cables, and advancements in material science leading to improved cable properties.
Challenges & Restraints: Fluctuations in raw material prices and supply chain disruptions can impact production costs and availability. Competition from substitute materials and stringent regulatory compliance requirements can pose challenges. The market faces price pressure from competitors and needs to continuously innovate to stay ahead.
Emerging Opportunities in Non-Sticky Silicone Cable
Emerging opportunities lie in expanding into untapped markets, particularly in developing economies with burgeoning industrial sectors. Innovative applications in robotics, renewable energy, and advanced medical devices present significant growth potential. Customization and development of specialized cables for niche applications will also contribute to market expansion.
Growth Accelerators in the Non-Sticky Silicone Cable Industry
Technological breakthroughs in silicone formulations and manufacturing processes will significantly accelerate market growth. Strategic partnerships between cable manufacturers and end-users will enable co-development of specialized products and expansion into new market segments. Focus on sustainable and environmentally friendly manufacturing practices will enhance market appeal and attract environmentally conscious buyers.
Key Players Shaping the Non-Sticky Silicone Cable Market
- ODU Connector Systems
- Hitachi Metals
- SAB Cable
- New England Wire Technologies
- GTeek
- HEW-KABEL
Notable Milestones in Non-Sticky Silicone Cable Sector
- 2020: Introduction of a new biocompatible silicone cable by GTeek.
- 2022: ODU Connector Systems partners with a major automotive manufacturer for a large-scale supply agreement.
- 2023: HEW-KABEL invests in a new manufacturing facility to expand production capacity.
In-Depth Non-Sticky Silicone Cable Market Outlook
The non-sticky silicone cable market is poised for continued expansion, driven by ongoing technological advancements, expanding applications, and increasing demand from key industries. Strategic partnerships, investments in R&D, and a focus on sustainability will play a crucial role in shaping the future of this dynamic market. The market presents significant opportunities for established players and new entrants alike, who can capitalize on the growing demand for high-performance, reliable, and environmentally friendly cables.
Non-Sticky Silicone Cable Segmentation
-
1. Application
- 1.1. Industrial
- 1.2. Medical
- 1.3. Automotive
- 1.4. Aerospace
- 1.5. Others
-
2. Types
- 2.1. Multicore Cables
- 2.2. Single Core Cables
Non-Sticky Silicone Cable Segmentation By Geography
-
1. North America
- 1.1. United States
- 1.2. Canada
- 1.3. Mexico
-
2. South America
- 2.1. Brazil
- 2.2. Argentina
- 2.3. Rest of South America
-
3. Europe
- 3.1. United Kingdom
- 3.2. Germany
- 3.3. France
- 3.4. Italy
- 3.5. Spain
- 3.6. Russia
- 3.7. Benelux
- 3.8. Nordics
- 3.9. Rest of Europe
-
4. Middle East & Africa
- 4.1. Turkey
- 4.2. Israel
- 4.3. GCC
- 4.4. North Africa
- 4.5. South Africa
- 4.6. Rest of Middle East & Africa
-
5. Asia Pacific
- 5.1. China
- 5.2. India
- 5.3. Japan
- 5.4. South Korea
- 5.5. ASEAN
- 5.6. Oceania
- 5.7. Rest of Asia Pacific

Non-Sticky Silicone Cable Regional Market Share
Geographic Coverage of Non-Sticky Silicone Cable
Non-Sticky Silicone Cable REPORT HIGHLIGHTS
| Aspects | Details |
|---|---|
| Study Period | 2020-2034 |
| Base Year | 2025 |
| Estimated Year | 2026 |
| Forecast Period | 2026-2034 |
| Historical Period | 2020-2025 |
| Growth Rate | CAGR of 5% from 2020-2034 |
| Segmentation |
|
Table of Contents
- 1. Introduction
- 1.1. Research Scope
- 1.2. Market Segmentation
- 1.3. Research Objective
- 1.4. Definitions and Assumptions
- 2. Executive Summary
- 2.1. Market Snapshot
- 3. Market Dynamics
- 3.1. Market Drivers
- 3.2. Market Restrains
- 3.3. Market Trends
- 3.4. Market Opportunities
- 4. Market Factor Analysis
- 4.1. Porters Five Forces
- 4.1.1. Bargaining Power of Suppliers
- 4.1.2. Bargaining Power of Buyers
- 4.1.3. Threat of New Entrants
- 4.1.4. Threat of Substitutes
- 4.1.5. Competitive Rivalry
- 4.2. PESTEL analysis
- 4.3. BCG Analysis
- 4.3.1. Stars (High Growth, High Market Share)
- 4.3.2. Cash Cows (Low Growth, High Market Share)
- 4.3.3. Question Mark (High Growth, Low Market Share)
- 4.3.4. Dogs (Low Growth, Low Market Share)
- 4.4. Ansoff Matrix Analysis
- 4.5. Supply Chain Analysis
- 4.6. Regulatory Landscape
- 4.7. Current Market Potential and Opportunity Assessment (TAM–SAM–SOM Framework)
- 4.8. VDR Analyst Note
- 4.1. Porters Five Forces
- 5. Market Analysis, Insights and Forecast 2021-2033
- 5.1. Market Analysis, Insights and Forecast - by Application
- 5.1.1. Industrial
- 5.1.2. Medical
- 5.1.3. Automotive
- 5.1.4. Aerospace
- 5.1.5. Others
- 5.2. Market Analysis, Insights and Forecast - by Types
- 5.2.1. Multicore Cables
- 5.2.2. Single Core Cables
- 5.3. Market Analysis, Insights and Forecast - by Region
- 5.3.1. North America
- 5.3.2. South America
- 5.3.3. Europe
- 5.3.4. Middle East & Africa
- 5.3.5. Asia Pacific
- 5.1. Market Analysis, Insights and Forecast - by Application
- 6. Global Non-Sticky Silicone Cable Analysis, Insights and Forecast, 2021-2033
- 6.1. Market Analysis, Insights and Forecast - by Application
- 6.1.1. Industrial
- 6.1.2. Medical
- 6.1.3. Automotive
- 6.1.4. Aerospace
- 6.1.5. Others
- 6.2. Market Analysis, Insights and Forecast - by Types
- 6.2.1. Multicore Cables
- 6.2.2. Single Core Cables
- 6.1. Market Analysis, Insights and Forecast - by Application
- 7. North America Non-Sticky Silicone Cable Analysis, Insights and Forecast, 2021-2033
- 7.1. Market Analysis, Insights and Forecast - by Application
- 7.1.1. Industrial
- 7.1.2. Medical
- 7.1.3. Automotive
- 7.1.4. Aerospace
- 7.1.5. Others
- 7.2. Market Analysis, Insights and Forecast - by Types
- 7.2.1. Multicore Cables
- 7.2.2. Single Core Cables
- 7.1. Market Analysis, Insights and Forecast - by Application
- 8. South America Non-Sticky Silicone Cable Analysis, Insights and Forecast, 2021-2033
- 8.1. Market Analysis, Insights and Forecast - by Application
- 8.1.1. Industrial
- 8.1.2. Medical
- 8.1.3. Automotive
- 8.1.4. Aerospace
- 8.1.5. Others
- 8.2. Market Analysis, Insights and Forecast - by Types
- 8.2.1. Multicore Cables
- 8.2.2. Single Core Cables
- 8.1. Market Analysis, Insights and Forecast - by Application
- 9. Europe Non-Sticky Silicone Cable Analysis, Insights and Forecast, 2021-2033
- 9.1. Market Analysis, Insights and Forecast - by Application
- 9.1.1. Industrial
- 9.1.2. Medical
- 9.1.3. Automotive
- 9.1.4. Aerospace
- 9.1.5. Others
- 9.2. Market Analysis, Insights and Forecast - by Types
- 9.2.1. Multicore Cables
- 9.2.2. Single Core Cables
- 9.1. Market Analysis, Insights and Forecast - by Application
- 10. Middle East & Africa Non-Sticky Silicone Cable Analysis, Insights and Forecast, 2021-2033
- 10.1. Market Analysis, Insights and Forecast - by Application
- 10.1.1. Industrial
- 10.1.2. Medical
- 10.1.3. Automotive
- 10.1.4. Aerospace
- 10.1.5. Others
- 10.2. Market Analysis, Insights and Forecast - by Types
- 10.2.1. Multicore Cables
- 10.2.2. Single Core Cables
- 10.1. Market Analysis, Insights and Forecast - by Application
- 11. Asia Pacific Non-Sticky Silicone Cable Analysis, Insights and Forecast, 2021-2033
- 11.1. Market Analysis, Insights and Forecast - by Application
- 11.1.1. Industrial
- 11.1.2. Medical
- 11.1.3. Automotive
- 11.1.4. Aerospace
- 11.1.5. Others
- 11.2. Market Analysis, Insights and Forecast - by Types
- 11.2.1. Multicore Cables
- 11.2.2. Single Core Cables
- 11.1. Market Analysis, Insights and Forecast - by Application
- 12. Competitive Analysis
- 12.1. Company Profiles
- 12.1.1 ODU Connector Systems
- 12.1.1.1. Company Overview
- 12.1.1.2. Products
- 12.1.1.3. Company Financials
- 12.1.1.4. SWOT Analysis
- 12.1.2 Hitachi Metals
- 12.1.2.1. Company Overview
- 12.1.2.2. Products
- 12.1.2.3. Company Financials
- 12.1.2.4. SWOT Analysis
- 12.1.3 SAB Cable
- 12.1.3.1. Company Overview
- 12.1.3.2. Products
- 12.1.3.3. Company Financials
- 12.1.3.4. SWOT Analysis
- 12.1.4 New England Wire Technologies
- 12.1.4.1. Company Overview
- 12.1.4.2. Products
- 12.1.4.3. Company Financials
- 12.1.4.4. SWOT Analysis
- 12.1.5 GTeek
- 12.1.5.1. Company Overview
- 12.1.5.2. Products
- 12.1.5.3. Company Financials
- 12.1.5.4. SWOT Analysis
- 12.1.6 HEW-KABEL
- 12.1.6.1. Company Overview
- 12.1.6.2. Products
- 12.1.6.3. Company Financials
- 12.1.6.4. SWOT Analysis
- 12.1.1 ODU Connector Systems
- 12.2. Market Entropy
- 12.2.1 Company's Key Areas Served
- 12.2.2 Recent Developments
- 12.3. Company Market Share Analysis 2025
- 12.3.1 Top 5 Companies Market Share Analysis
- 12.3.2 Top 3 Companies Market Share Analysis
- 12.4. List of Potential Customers
- 13. Research Methodology
List of Figures
- Figure 1: Global Non-Sticky Silicone Cable Revenue Breakdown (million, %) by Region 2025 & 2033
- Figure 2: Global Non-Sticky Silicone Cable Volume Breakdown (K, %) by Region 2025 & 2033
- Figure 3: North America Non-Sticky Silicone Cable Revenue (million), by Application 2025 & 2033
- Figure 4: North America Non-Sticky Silicone Cable Volume (K), by Application 2025 & 2033
- Figure 5: North America Non-Sticky Silicone Cable Revenue Share (%), by Application 2025 & 2033
- Figure 6: North America Non-Sticky Silicone Cable Volume Share (%), by Application 2025 & 2033
- Figure 7: North America Non-Sticky Silicone Cable Revenue (million), by Types 2025 & 2033
- Figure 8: North America Non-Sticky Silicone Cable Volume (K), by Types 2025 & 2033
- Figure 9: North America Non-Sticky Silicone Cable Revenue Share (%), by Types 2025 & 2033
- Figure 10: North America Non-Sticky Silicone Cable Volume Share (%), by Types 2025 & 2033
- Figure 11: North America Non-Sticky Silicone Cable Revenue (million), by Country 2025 & 2033
- Figure 12: North America Non-Sticky Silicone Cable Volume (K), by Country 2025 & 2033
- Figure 13: North America Non-Sticky Silicone Cable Revenue Share (%), by Country 2025 & 2033
- Figure 14: North America Non-Sticky Silicone Cable Volume Share (%), by Country 2025 & 2033
- Figure 15: South America Non-Sticky Silicone Cable Revenue (million), by Application 2025 & 2033
- Figure 16: South America Non-Sticky Silicone Cable Volume (K), by Application 2025 & 2033
- Figure 17: South America Non-Sticky Silicone Cable Revenue Share (%), by Application 2025 & 2033
- Figure 18: South America Non-Sticky Silicone Cable Volume Share (%), by Application 2025 & 2033
- Figure 19: South America Non-Sticky Silicone Cable Revenue (million), by Types 2025 & 2033
- Figure 20: South America Non-Sticky Silicone Cable Volume (K), by Types 2025 & 2033
- Figure 21: South America Non-Sticky Silicone Cable Revenue Share (%), by Types 2025 & 2033
- Figure 22: South America Non-Sticky Silicone Cable Volume Share (%), by Types 2025 & 2033
- Figure 23: South America Non-Sticky Silicone Cable Revenue (million), by Country 2025 & 2033
- Figure 24: South America Non-Sticky Silicone Cable Volume (K), by Country 2025 & 2033
- Figure 25: South America Non-Sticky Silicone Cable Revenue Share (%), by Country 2025 & 2033
- Figure 26: South America Non-Sticky Silicone Cable Volume Share (%), by Country 2025 & 2033
- Figure 27: Europe Non-Sticky Silicone Cable Revenue (million), by Application 2025 & 2033
- Figure 28: Europe Non-Sticky Silicone Cable Volume (K), by Application 2025 & 2033
- Figure 29: Europe Non-Sticky Silicone Cable Revenue Share (%), by Application 2025 & 2033
- Figure 30: Europe Non-Sticky Silicone Cable Volume Share (%), by Application 2025 & 2033
- Figure 31: Europe Non-Sticky Silicone Cable Revenue (million), by Types 2025 & 2033
- Figure 32: Europe Non-Sticky Silicone Cable Volume (K), by Types 2025 & 2033
- Figure 33: Europe Non-Sticky Silicone Cable Revenue Share (%), by Types 2025 & 2033
- Figure 34: Europe Non-Sticky Silicone Cable Volume Share (%), by Types 2025 & 2033
- Figure 35: Europe Non-Sticky Silicone Cable Revenue (million), by Country 2025 & 2033
- Figure 36: Europe Non-Sticky Silicone Cable Volume (K), by Country 2025 & 2033
- Figure 37: Europe Non-Sticky Silicone Cable Revenue Share (%), by Country 2025 & 2033
- Figure 38: Europe Non-Sticky Silicone Cable Volume Share (%), by Country 2025 & 2033
- Figure 39: Middle East & Africa Non-Sticky Silicone Cable Revenue (million), by Application 2025 & 2033
- Figure 40: Middle East & Africa Non-Sticky Silicone Cable Volume (K), by Application 2025 & 2033
- Figure 41: Middle East & Africa Non-Sticky Silicone Cable Revenue Share (%), by Application 2025 & 2033
- Figure 42: Middle East & Africa Non-Sticky Silicone Cable Volume Share (%), by Application 2025 & 2033
- Figure 43: Middle East & Africa Non-Sticky Silicone Cable Revenue (million), by Types 2025 & 2033
- Figure 44: Middle East & Africa Non-Sticky Silicone Cable Volume (K), by Types 2025 & 2033
- Figure 45: Middle East & Africa Non-Sticky Silicone Cable Revenue Share (%), by Types 2025 & 2033
- Figure 46: Middle East & Africa Non-Sticky Silicone Cable Volume Share (%), by Types 2025 & 2033
- Figure 47: Middle East & Africa Non-Sticky Silicone Cable Revenue (million), by Country 2025 & 2033
- Figure 48: Middle East & Africa Non-Sticky Silicone Cable Volume (K), by Country 2025 & 2033
- Figure 49: Middle East & Africa Non-Sticky Silicone Cable Revenue Share (%), by Country 2025 & 2033
- Figure 50: Middle East & Africa Non-Sticky Silicone Cable Volume Share (%), by Country 2025 & 2033
- Figure 51: Asia Pacific Non-Sticky Silicone Cable Revenue (million), by Application 2025 & 2033
- Figure 52: Asia Pacific Non-Sticky Silicone Cable Volume (K), by Application 2025 & 2033
- Figure 53: Asia Pacific Non-Sticky Silicone Cable Revenue Share (%), by Application 2025 & 2033
- Figure 54: Asia Pacific Non-Sticky Silicone Cable Volume Share (%), by Application 2025 & 2033
- Figure 55: Asia Pacific Non-Sticky Silicone Cable Revenue (million), by Types 2025 & 2033
- Figure 56: Asia Pacific Non-Sticky Silicone Cable Volume (K), by Types 2025 & 2033
- Figure 57: Asia Pacific Non-Sticky Silicone Cable Revenue Share (%), by Types 2025 & 2033
- Figure 58: Asia Pacific Non-Sticky Silicone Cable Volume Share (%), by Types 2025 & 2033
- Figure 59: Asia Pacific Non-Sticky Silicone Cable Revenue (million), by Country 2025 & 2033
- Figure 60: Asia Pacific Non-Sticky Silicone Cable Volume (K), by Country 2025 & 2033
- Figure 61: Asia Pacific Non-Sticky Silicone Cable Revenue Share (%), by Country 2025 & 2033
- Figure 62: Asia Pacific Non-Sticky Silicone Cable Volume Share (%), by Country 2025 & 2033
List of Tables
- Table 1: Global Non-Sticky Silicone Cable Revenue million Forecast, by Application 2020 & 2033
- Table 2: Global Non-Sticky Silicone Cable Volume K Forecast, by Application 2020 & 2033
- Table 3: Global Non-Sticky Silicone Cable Revenue million Forecast, by Types 2020 & 2033
- Table 4: Global Non-Sticky Silicone Cable Volume K Forecast, by Types 2020 & 2033
- Table 5: Global Non-Sticky Silicone Cable Revenue million Forecast, by Region 2020 & 2033
- Table 6: Global Non-Sticky Silicone Cable Volume K Forecast, by Region 2020 & 2033
- Table 7: Global Non-Sticky Silicone Cable Revenue million Forecast, by Application 2020 & 2033
- Table 8: Global Non-Sticky Silicone Cable Volume K Forecast, by Application 2020 & 2033
- Table 9: Global Non-Sticky Silicone Cable Revenue million Forecast, by Types 2020 & 2033
- Table 10: Global Non-Sticky Silicone Cable Volume K Forecast, by Types 2020 & 2033
- Table 11: Global Non-Sticky Silicone Cable Revenue million Forecast, by Country 2020 & 2033
- Table 12: Global Non-Sticky Silicone Cable Volume K Forecast, by Country 2020 & 2033
- Table 13: United States Non-Sticky Silicone Cable Revenue (million) Forecast, by Application 2020 & 2033
- Table 14: United States Non-Sticky Silicone Cable Volume (K) Forecast, by Application 2020 & 2033
- Table 15: Canada Non-Sticky Silicone Cable Revenue (million) Forecast, by Application 2020 & 2033
- Table 16: Canada Non-Sticky Silicone Cable Volume (K) Forecast, by Application 2020 & 2033
- Table 17: Mexico Non-Sticky Silicone Cable Revenue (million) Forecast, by Application 2020 & 2033
- Table 18: Mexico Non-Sticky Silicone Cable Volume (K) Forecast, by Application 2020 & 2033
- Table 19: Global Non-Sticky Silicone Cable Revenue million Forecast, by Application 2020 & 2033
- Table 20: Global Non-Sticky Silicone Cable Volume K Forecast, by Application 2020 & 2033
- Table 21: Global Non-Sticky Silicone Cable Revenue million Forecast, by Types 2020 & 2033
- Table 22: Global Non-Sticky Silicone Cable Volume K Forecast, by Types 2020 & 2033
- Table 23: Global Non-Sticky Silicone Cable Revenue million Forecast, by Country 2020 & 2033
- Table 24: Global Non-Sticky Silicone Cable Volume K Forecast, by Country 2020 & 2033
- Table 25: Brazil Non-Sticky Silicone Cable Revenue (million) Forecast, by Application 2020 & 2033
- Table 26: Brazil Non-Sticky Silicone Cable Volume (K) Forecast, by Application 2020 & 2033
- Table 27: Argentina Non-Sticky Silicone Cable Revenue (million) Forecast, by Application 2020 & 2033
- Table 28: Argentina Non-Sticky Silicone Cable Volume (K) Forecast, by Application 2020 & 2033
- Table 29: Rest of South America Non-Sticky Silicone Cable Revenue (million) Forecast, by Application 2020 & 2033
- Table 30: Rest of South America Non-Sticky Silicone Cable Volume (K) Forecast, by Application 2020 & 2033
- Table 31: Global Non-Sticky Silicone Cable Revenue million Forecast, by Application 2020 & 2033
- Table 32: Global Non-Sticky Silicone Cable Volume K Forecast, by Application 2020 & 2033
- Table 33: Global Non-Sticky Silicone Cable Revenue million Forecast, by Types 2020 & 2033
- Table 34: Global Non-Sticky Silicone Cable Volume K Forecast, by Types 2020 & 2033
- Table 35: Global Non-Sticky Silicone Cable Revenue million Forecast, by Country 2020 & 2033
- Table 36: Global Non-Sticky Silicone Cable Volume K Forecast, by Country 2020 & 2033
- Table 37: United Kingdom Non-Sticky Silicone Cable Revenue (million) Forecast, by Application 2020 & 2033
- Table 38: United Kingdom Non-Sticky Silicone Cable Volume (K) Forecast, by Application 2020 & 2033
- Table 39: Germany Non-Sticky Silicone Cable Revenue (million) Forecast, by Application 2020 & 2033
- Table 40: Germany Non-Sticky Silicone Cable Volume (K) Forecast, by Application 2020 & 2033
- Table 41: France Non-Sticky Silicone Cable Revenue (million) Forecast, by Application 2020 & 2033
- Table 42: France Non-Sticky Silicone Cable Volume (K) Forecast, by Application 2020 & 2033
- Table 43: Italy Non-Sticky Silicone Cable Revenue (million) Forecast, by Application 2020 & 2033
- Table 44: Italy Non-Sticky Silicone Cable Volume (K) Forecast, by Application 2020 & 2033
- Table 45: Spain Non-Sticky Silicone Cable Revenue (million) Forecast, by Application 2020 & 2033
- Table 46: Spain Non-Sticky Silicone Cable Volume (K) Forecast, by Application 2020 & 2033
- Table 47: Russia Non-Sticky Silicone Cable Revenue (million) Forecast, by Application 2020 & 2033
- Table 48: Russia Non-Sticky Silicone Cable Volume (K) Forecast, by Application 2020 & 2033
- Table 49: Benelux Non-Sticky Silicone Cable Revenue (million) Forecast, by Application 2020 & 2033
- Table 50: Benelux Non-Sticky Silicone Cable Volume (K) Forecast, by Application 2020 & 2033
- Table 51: Nordics Non-Sticky Silicone Cable Revenue (million) Forecast, by Application 2020 & 2033
- Table 52: Nordics Non-Sticky Silicone Cable Volume (K) Forecast, by Application 2020 & 2033
- Table 53: Rest of Europe Non-Sticky Silicone Cable Revenue (million) Forecast, by Application 2020 & 2033
- Table 54: Rest of Europe Non-Sticky Silicone Cable Volume (K) Forecast, by Application 2020 & 2033
- Table 55: Global Non-Sticky Silicone Cable Revenue million Forecast, by Application 2020 & 2033
- Table 56: Global Non-Sticky Silicone Cable Volume K Forecast, by Application 2020 & 2033
- Table 57: Global Non-Sticky Silicone Cable Revenue million Forecast, by Types 2020 & 2033
- Table 58: Global Non-Sticky Silicone Cable Volume K Forecast, by Types 2020 & 2033
- Table 59: Global Non-Sticky Silicone Cable Revenue million Forecast, by Country 2020 & 2033
- Table 60: Global Non-Sticky Silicone Cable Volume K Forecast, by Country 2020 & 2033
- Table 61: Turkey Non-Sticky Silicone Cable Revenue (million) Forecast, by Application 2020 & 2033
- Table 62: Turkey Non-Sticky Silicone Cable Volume (K) Forecast, by Application 2020 & 2033
- Table 63: Israel Non-Sticky Silicone Cable Revenue (million) Forecast, by Application 2020 & 2033
- Table 64: Israel Non-Sticky Silicone Cable Volume (K) Forecast, by Application 2020 & 2033
- Table 65: GCC Non-Sticky Silicone Cable Revenue (million) Forecast, by Application 2020 & 2033
- Table 66: GCC Non-Sticky Silicone Cable Volume (K) Forecast, by Application 2020 & 2033
- Table 67: North Africa Non-Sticky Silicone Cable Revenue (million) Forecast, by Application 2020 & 2033
- Table 68: North Africa Non-Sticky Silicone Cable Volume (K) Forecast, by Application 2020 & 2033
- Table 69: South Africa Non-Sticky Silicone Cable Revenue (million) Forecast, by Application 2020 & 2033
- Table 70: South Africa Non-Sticky Silicone Cable Volume (K) Forecast, by Application 2020 & 2033
- Table 71: Rest of Middle East & Africa Non-Sticky Silicone Cable Revenue (million) Forecast, by Application 2020 & 2033
- Table 72: Rest of Middle East & Africa Non-Sticky Silicone Cable Volume (K) Forecast, by Application 2020 & 2033
- Table 73: Global Non-Sticky Silicone Cable Revenue million Forecast, by Application 2020 & 2033
- Table 74: Global Non-Sticky Silicone Cable Volume K Forecast, by Application 2020 & 2033
- Table 75: Global Non-Sticky Silicone Cable Revenue million Forecast, by Types 2020 & 2033
- Table 76: Global Non-Sticky Silicone Cable Volume K Forecast, by Types 2020 & 2033
- Table 77: Global Non-Sticky Silicone Cable Revenue million Forecast, by Country 2020 & 2033
- Table 78: Global Non-Sticky Silicone Cable Volume K Forecast, by Country 2020 & 2033
- Table 79: China Non-Sticky Silicone Cable Revenue (million) Forecast, by Application 2020 & 2033
- Table 80: China Non-Sticky Silicone Cable Volume (K) Forecast, by Application 2020 & 2033
- Table 81: India Non-Sticky Silicone Cable Revenue (million) Forecast, by Application 2020 & 2033
- Table 82: India Non-Sticky Silicone Cable Volume (K) Forecast, by Application 2020 & 2033
- Table 83: Japan Non-Sticky Silicone Cable Revenue (million) Forecast, by Application 2020 & 2033
- Table 84: Japan Non-Sticky Silicone Cable Volume (K) Forecast, by Application 2020 & 2033
- Table 85: South Korea Non-Sticky Silicone Cable Revenue (million) Forecast, by Application 2020 & 2033
- Table 86: South Korea Non-Sticky Silicone Cable Volume (K) Forecast, by Application 2020 & 2033
- Table 87: ASEAN Non-Sticky Silicone Cable Revenue (million) Forecast, by Application 2020 & 2033
- Table 88: ASEAN Non-Sticky Silicone Cable Volume (K) Forecast, by Application 2020 & 2033
- Table 89: Oceania Non-Sticky Silicone Cable Revenue (million) Forecast, by Application 2020 & 2033
- Table 90: Oceania Non-Sticky Silicone Cable Volume (K) Forecast, by Application 2020 & 2033
- Table 91: Rest of Asia Pacific Non-Sticky Silicone Cable Revenue (million) Forecast, by Application 2020 & 2033
- Table 92: Rest of Asia Pacific Non-Sticky Silicone Cable Volume (K) Forecast, by Application 2020 & 2033
Frequently Asked Questions
1. What is the projected Compound Annual Growth Rate (CAGR) of the Non-Sticky Silicone Cable?
The projected CAGR is approximately 5%.
2. Which companies are prominent players in the Non-Sticky Silicone Cable?
Key companies in the market include ODU Connector Systems, Hitachi Metals, SAB Cable, New England Wire Technologies, GTeek, HEW-KABEL.
3. What are the main segments of the Non-Sticky Silicone Cable?
The market segments include Application, Types.
4. Can you provide details about the market size?
The market size is estimated to be USD 681 million as of 2022.
5. What are some drivers contributing to market growth?
N/A
6. What are the notable trends driving market growth?
N/A
7. Are there any restraints impacting market growth?
N/A
8. Can you provide examples of recent developments in the market?
N/A
9. What pricing options are available for accessing the report?
Pricing options include single-user, multi-user, and enterprise licenses priced at USD 4350.00, USD 6525.00, and USD 8700.00 respectively.
10. Is the market size provided in terms of value or volume?
The market size is provided in terms of value, measured in million and volume, measured in K.
11. Are there any specific market keywords associated with the report?
Yes, the market keyword associated with the report is "Non-Sticky Silicone Cable," which aids in identifying and referencing the specific market segment covered.
12. How do I determine which pricing option suits my needs best?
The pricing options vary based on user requirements and access needs. Individual users may opt for single-user licenses, while businesses requiring broader access may choose multi-user or enterprise licenses for cost-effective access to the report.
13. Are there any additional resources or data provided in the Non-Sticky Silicone Cable report?
While the report offers comprehensive insights, it's advisable to review the specific contents or supplementary materials provided to ascertain if additional resources or data are available.
14. How can I stay updated on further developments or reports in the Non-Sticky Silicone Cable?
To stay informed about further developments, trends, and reports in the Non-Sticky Silicone Cable, consider subscribing to industry newsletters, following relevant companies and organizations, or regularly checking reputable industry news sources and publications.
Methodology
Step 1 - Identification of Relevant Samples Size from Population Database


Step 2 - Approaches for Defining Global Market Size (Value, Volume* & Price*)

Note*: In applicable scenarios
Step 3 - Data Sources
Primary Research
- Web Analytics
- Survey Reports
- Research Institute
- Latest Research Reports
- Opinion Leaders
Secondary Research
- Annual Reports
- White Paper
- Latest Press Release
- Industry Association
- Paid Database
- Investor Presentations

Step 4 - Data Triangulation
Involves using different sources of information in order to increase the validity of a study
These sources are likely to be stakeholders in a program - participants, other researchers, program staff, other community members, and so on.
Then we put all data in single framework & apply various statistical tools to find out the dynamic on the market.
During the analysis stage, feedback from the stakeholder groups would be compared to determine areas of agreement as well as areas of divergence