Key Insights
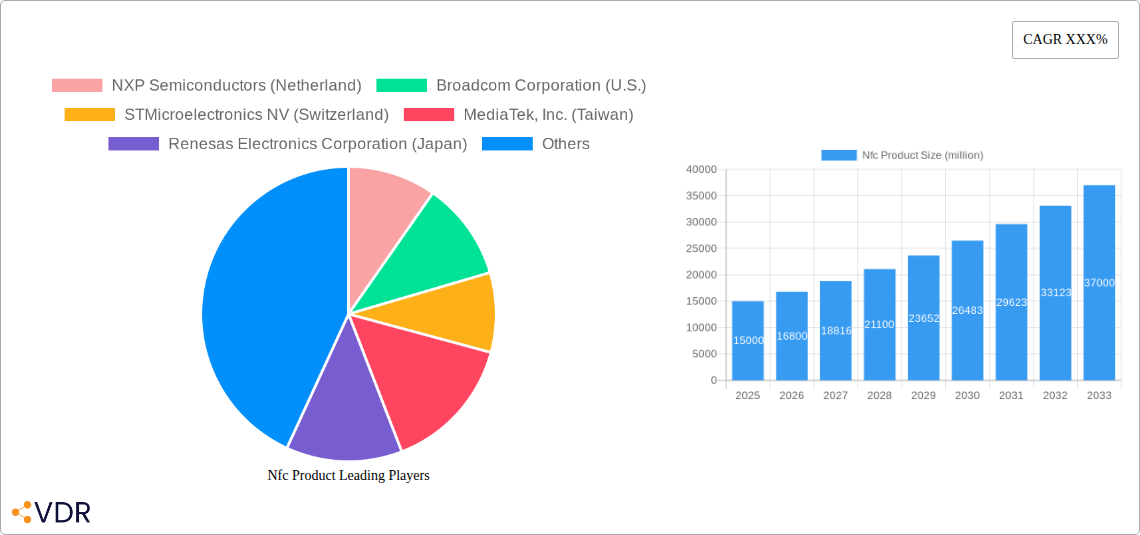
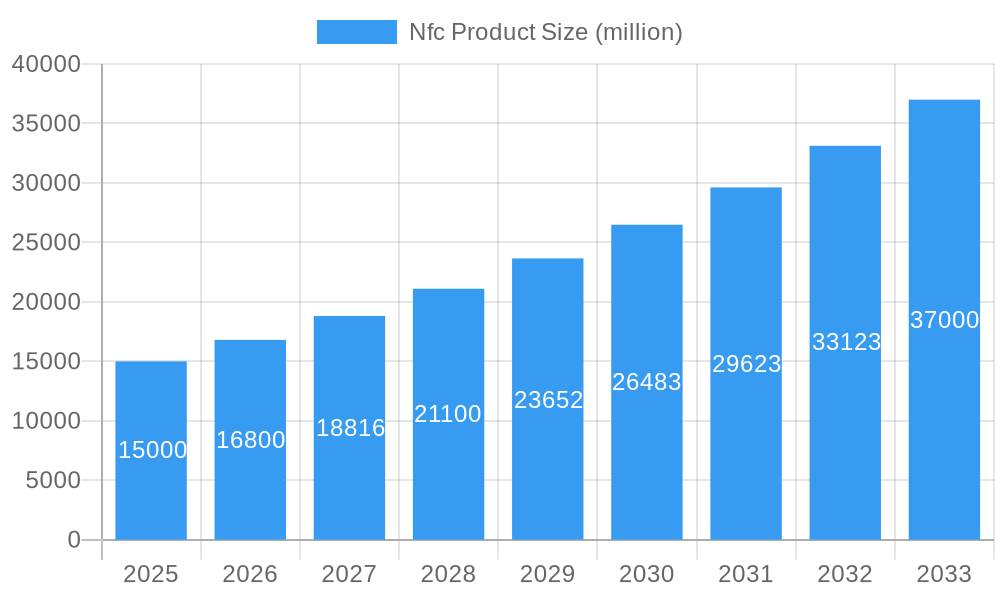
The NFC (Near Field Communication) product market is experiencing robust growth, driven by the increasing adoption of contactless payments, access control systems, and data exchange solutions across various sectors. The market's expansion is fueled by the rising demand for secure and convenient transactions, particularly in the retail and transportation industries. Technological advancements, such as improved security features and integration with other technologies like IoT and mobile payments, are further propelling market growth. The global market, estimated at $15 billion in 2025, is projected to witness a Compound Annual Growth Rate (CAGR) of 12% from 2025 to 2033, reaching approximately $40 billion by 2033. This growth is not uniform across all regions; North America and Europe are currently leading the market due to high adoption rates and well-established infrastructure. However, emerging economies in Asia-Pacific and Latin America are expected to show significant growth in the coming years, fueled by increasing smartphone penetration and expanding digitalization efforts.
Nfc Product Market Size (In Billion)
Key restraints to market growth include security concerns related to data breaches and potential vulnerabilities within NFC technology. Furthermore, the need for widespread NFC infrastructure adoption and consumer awareness regarding the benefits of NFC technology continues to pose challenges. However, ongoing improvements in security protocols and increasing consumer familiarity are gradually mitigating these restraints. The market is segmented by technology (passive and active NFC), application (payments, access control, data exchange), and end-user (consumer electronics, automotive, healthcare). Leading players such as NXP Semiconductors, Broadcom, STMicroelectronics, MediaTek, and Renesas Electronics are actively investing in research and development to innovate and maintain a competitive edge in this rapidly evolving market. This competitive landscape fosters continuous improvements in NFC technology, leading to enhanced performance, security, and wider applicability.
Nfc Product Company Market Share
NFC Product Market Report: 2019-2033
This comprehensive report provides an in-depth analysis of the NFC (Near Field Communication) product market, encompassing market dynamics, growth trends, regional dominance, product landscape, key players, and future outlook. The study period covers 2019-2033, with a base year of 2025 and a forecast period of 2025-2033. The report utilizes data from 2019-2024 as the historical period. Market values are presented in million units.
NFC Product Market Dynamics & Structure
This section analyzes the competitive landscape of the NFC product market, examining market concentration, technological innovation, regulatory frameworks, substitute products, end-user demographics, and mergers and acquisitions (M&A) activity. The global NFC product market is estimated at xx million units in 2025, projected to reach xx million units by 2033.
- Market Concentration: The market exhibits moderate concentration, with key players holding significant shares. NXP Semiconductors, Broadcom, and STMicroelectronics are leading players, collectively commanding approximately xx% of the market share in 2025.
- Technological Innovation: Continuous advancements in NFC technology, including improved power efficiency, enhanced security features, and wider integration capabilities, are driving market growth. The development of NFC-enabled IoT devices presents significant opportunities.
- Regulatory Frameworks: Government regulations concerning data privacy and security are influencing NFC product development and adoption. Compliance requirements vary across regions, impacting market dynamics.
- Competitive Product Substitutes: Technologies such as Bluetooth and QR codes present some competition, but NFC’s advantages in terms of security and ease of use maintain its dominance in specific applications.
- End-User Demographics: The expanding adoption of smartphones, contactless payment systems, and access control solutions is fueling the demand for NFC products across various demographics.
- M&A Trends: The NFC sector has witnessed xx M&A deals in the historical period (2019-2024), primarily focused on acquiring smaller companies with specialized technologies or expanding geographical reach. The average deal value was approximately xx million units. Consolidation is expected to continue, driven by the need to achieve economies of scale and technological leadership.
NFC Product Growth Trends & Insights
This section analyzes the evolution of the NFC product market size, adoption rates, technological disruptions, and shifts in consumer behavior. The market is experiencing significant growth, driven by increasing smartphone penetration, the rise of contactless payments, and the expansion of the Internet of Things (IoT). The CAGR for the forecast period (2025-2033) is projected to be xx%. Market penetration is expected to increase from xx% in 2025 to xx% by 2033. Technological advancements such as the integration of NFC with other technologies (e.g., Bluetooth, Wi-Fi) and the development of more secure and energy-efficient chips are driving adoption rates. Consumer preference for convenient and secure contactless transactions is a significant factor in market growth. The market has witnessed a notable shift toward more sophisticated and feature-rich NFC chips, catering to a wider range of applications.
Dominant Regions, Countries, or Segments in NFC Product
North America and Europe currently dominate the NFC product market, driven by high smartphone penetration, robust digital infrastructure, and early adoption of contactless payment technologies. However, Asia-Pacific is poised for substantial growth, fueled by rapid economic expansion and increasing smartphone adoption.
- Key Drivers in North America: Established digital infrastructure, high consumer adoption of contactless payments, and a well-developed regulatory environment.
- Key Drivers in Europe: Similar to North America, high smartphone penetration and the early adoption of contactless payment systems are key drivers.
- Key Drivers in Asia-Pacific: Rapid economic growth, increasing smartphone adoption, and government initiatives promoting digitalization are driving market growth.
NFC Product Product Landscape
NFC product innovation is focused on enhancing security, improving power efficiency, and expanding functionality. New products incorporate advanced encryption techniques, consume less power, and offer greater interoperability. This has led to greater adoption in various applications beyond mobile payments, such as access control, supply chain management, and healthcare. Unique selling propositions include enhanced security features, improved data transfer speeds, and compatibility with diverse devices and platforms. Technological advancements are focused on miniaturization, increased processing power, and improved security.
Key Drivers, Barriers & Challenges in NFC Product
Key Drivers: Increasing smartphone penetration, growing demand for contactless payments, the expansion of the IoT, and advancements in NFC technology are major drivers.
Challenges: Security concerns, interoperability issues, and the potential for regulatory hurdles present challenges to market growth. Supply chain disruptions can also impact production and availability. Competition from alternative technologies, such as Bluetooth and QR codes, further adds to market complexities. The market is estimated to face a xx% decrease in growth if supply chain disruptions continue.
Emerging Opportunities in NFC Product
Emerging opportunities lie in the expansion of NFC into untapped markets, such as healthcare and industrial automation, and the development of innovative applications, such as NFC-enabled smart home devices and wearables. The increasing adoption of NFC in the automotive sector presents another lucrative opportunity. Furthermore, evolving consumer preferences towards contactless interactions will drive demand for NFC-enabled products.
Growth Accelerators in the NFC Product Industry
Technological breakthroughs, strategic partnerships, and expansion into new markets are key growth catalysts. The development of more secure and energy-efficient NFC chips, along with partnerships between NFC technology providers and device manufacturers, will drive market growth. Expanding NFC applications beyond payments into areas such as access control and healthcare will further accelerate the market's expansion.
Key Players Shaping the NFC Product Market
Notable Milestones in NFC Product Sector
- 2020: Launch of new NFC chips with enhanced security features by NXP Semiconductors.
- 2021: Partnership between STMicroelectronics and a major smartphone manufacturer to integrate NFC technology into new devices.
- 2022: Acquisition of a smaller NFC technology company by Broadcom.
- 2023: Introduction of new regulatory guidelines impacting NFC product development in Europe.
- 2024: Significant increase in the adoption of NFC-enabled payment systems in Asia-Pacific.
In-Depth NFC Product Market Outlook
The NFC product market is poised for continued strong growth, driven by ongoing technological innovation, increasing demand for contactless solutions, and expansion into new application areas. Strategic partnerships and collaborations between key players will play a crucial role in shaping the future market landscape. The integration of NFC with other technologies and the development of new applications will unlock significant growth opportunities. The market's future success hinges on addressing security concerns, ensuring interoperability, and navigating regulatory complexities.
Nfc Product Segmentation
-
1. Application
- 1.1. Retail
- 1.2. Transportation
- 1.3. Automotive
- 1.4. Others
-
2. Type
- 2.1. NFC Controller
- 2.2. NFC Tag
Nfc Product Segmentation By Geography
-
1. North America
- 1.1. United States
- 1.2. Canada
- 1.3. Mexico
-
2. South America
- 2.1. Brazil
- 2.2. Argentina
- 2.3. Rest of South America
-
3. Europe
- 3.1. United Kingdom
- 3.2. Germany
- 3.3. France
- 3.4. Italy
- 3.5. Spain
- 3.6. Russia
- 3.7. Benelux
- 3.8. Nordics
- 3.9. Rest of Europe
-
4. Middle East & Africa
- 4.1. Turkey
- 4.2. Israel
- 4.3. GCC
- 4.4. North Africa
- 4.5. South Africa
- 4.6. Rest of Middle East & Africa
-
5. Asia Pacific
- 5.1. China
- 5.2. India
- 5.3. Japan
- 5.4. South Korea
- 5.5. ASEAN
- 5.6. Oceania
- 5.7. Rest of Asia Pacific

Nfc Product Regional Market Share
Geographic Coverage of Nfc Product
Nfc Product REPORT HIGHLIGHTS
| Aspects | Details |
|---|---|
| Study Period | 2020-2034 |
| Base Year | 2025 |
| Estimated Year | 2026 |
| Forecast Period | 2026-2034 |
| Historical Period | 2020-2025 |
| Growth Rate | CAGR of XXX% from 2020-2034 |
| Segmentation |
|
Table of Contents
- 1. Introduction
- 1.1. Research Scope
- 1.2. Market Segmentation
- 1.3. Research Objective
- 1.4. Definitions and Assumptions
- 2. Executive Summary
- 2.1. Market Snapshot
- 3. Market Dynamics
- 3.1. Market Drivers
- 3.2. Market Restrains
- 3.3. Market Trends
- 3.4. Market Opportunities
- 4. Market Factor Analysis
- 4.1. Porters Five Forces
- 4.1.1. Bargaining Power of Suppliers
- 4.1.2. Bargaining Power of Buyers
- 4.1.3. Threat of New Entrants
- 4.1.4. Threat of Substitutes
- 4.1.5. Competitive Rivalry
- 4.2. PESTEL analysis
- 4.3. BCG Analysis
- 4.3.1. Stars (High Growth, High Market Share)
- 4.3.2. Cash Cows (Low Growth, High Market Share)
- 4.3.3. Question Mark (High Growth, Low Market Share)
- 4.3.4. Dogs (Low Growth, Low Market Share)
- 4.4. Ansoff Matrix Analysis
- 4.5. Supply Chain Analysis
- 4.6. Regulatory Landscape
- 4.7. Current Market Potential and Opportunity Assessment (TAM–SAM–SOM Framework)
- 4.8. VDR Analyst Note
- 4.1. Porters Five Forces
- 5. Market Analysis, Insights and Forecast 2021-2033
- 5.1. Market Analysis, Insights and Forecast - by Application
- 5.1.1. Retail
- 5.1.2. Transportation
- 5.1.3. Automotive
- 5.1.4. Others
- 5.2. Market Analysis, Insights and Forecast - by Type
- 5.2.1. NFC Controller
- 5.2.2. NFC Tag
- 5.3. Market Analysis, Insights and Forecast - by Region
- 5.3.1. North America
- 5.3.2. South America
- 5.3.3. Europe
- 5.3.4. Middle East & Africa
- 5.3.5. Asia Pacific
- 5.1. Market Analysis, Insights and Forecast - by Application
- 6. Global Nfc Product Analysis, Insights and Forecast, 2021-2033
- 6.1. Market Analysis, Insights and Forecast - by Application
- 6.1.1. Retail
- 6.1.2. Transportation
- 6.1.3. Automotive
- 6.1.4. Others
- 6.2. Market Analysis, Insights and Forecast - by Type
- 6.2.1. NFC Controller
- 6.2.2. NFC Tag
- 6.1. Market Analysis, Insights and Forecast - by Application
- 7. North America Nfc Product Analysis, Insights and Forecast, 2021-2033
- 7.1. Market Analysis, Insights and Forecast - by Application
- 7.1.1. Retail
- 7.1.2. Transportation
- 7.1.3. Automotive
- 7.1.4. Others
- 7.2. Market Analysis, Insights and Forecast - by Type
- 7.2.1. NFC Controller
- 7.2.2. NFC Tag
- 7.1. Market Analysis, Insights and Forecast - by Application
- 8. South America Nfc Product Analysis, Insights and Forecast, 2021-2033
- 8.1. Market Analysis, Insights and Forecast - by Application
- 8.1.1. Retail
- 8.1.2. Transportation
- 8.1.3. Automotive
- 8.1.4. Others
- 8.2. Market Analysis, Insights and Forecast - by Type
- 8.2.1. NFC Controller
- 8.2.2. NFC Tag
- 8.1. Market Analysis, Insights and Forecast - by Application
- 9. Europe Nfc Product Analysis, Insights and Forecast, 2021-2033
- 9.1. Market Analysis, Insights and Forecast - by Application
- 9.1.1. Retail
- 9.1.2. Transportation
- 9.1.3. Automotive
- 9.1.4. Others
- 9.2. Market Analysis, Insights and Forecast - by Type
- 9.2.1. NFC Controller
- 9.2.2. NFC Tag
- 9.1. Market Analysis, Insights and Forecast - by Application
- 10. Middle East & Africa Nfc Product Analysis, Insights and Forecast, 2021-2033
- 10.1. Market Analysis, Insights and Forecast - by Application
- 10.1.1. Retail
- 10.1.2. Transportation
- 10.1.3. Automotive
- 10.1.4. Others
- 10.2. Market Analysis, Insights and Forecast - by Type
- 10.2.1. NFC Controller
- 10.2.2. NFC Tag
- 10.1. Market Analysis, Insights and Forecast - by Application
- 11. Asia Pacific Nfc Product Analysis, Insights and Forecast, 2021-2033
- 11.1. Market Analysis, Insights and Forecast - by Application
- 11.1.1. Retail
- 11.1.2. Transportation
- 11.1.3. Automotive
- 11.1.4. Others
- 11.2. Market Analysis, Insights and Forecast - by Type
- 11.2.1. NFC Controller
- 11.2.2. NFC Tag
- 11.1. Market Analysis, Insights and Forecast - by Application
- 12. Competitive Analysis
- 12.1. Company Profiles
- 12.1.1 NXP Semiconductors (Netherland)
- 12.1.1.1. Company Overview
- 12.1.1.2. Products
- 12.1.1.3. Company Financials
- 12.1.1.4. SWOT Analysis
- 12.1.2 Broadcom Corporation (U.S.)
- 12.1.2.1. Company Overview
- 12.1.2.2. Products
- 12.1.2.3. Company Financials
- 12.1.2.4. SWOT Analysis
- 12.1.3 STMicroelectronics NV (Switzerland)
- 12.1.3.1. Company Overview
- 12.1.3.2. Products
- 12.1.3.3. Company Financials
- 12.1.3.4. SWOT Analysis
- 12.1.4 MediaTek Inc. (Taiwan)
- 12.1.4.1. Company Overview
- 12.1.4.2. Products
- 12.1.4.3. Company Financials
- 12.1.4.4. SWOT Analysis
- 12.1.5 Renesas Electronics Corporation (Japan)
- 12.1.5.1. Company Overview
- 12.1.5.2. Products
- 12.1.5.3. Company Financials
- 12.1.5.4. SWOT Analysis
- 12.1.6 Gemalto NV (Netherlands)
- 12.1.6.1. Company Overview
- 12.1.6.2. Products
- 12.1.6.3. Company Financials
- 12.1.6.4. SWOT Analysis
- 12.1.7 Texas Instruments (U.S.)
- 12.1.7.1. Company Overview
- 12.1.7.2. Products
- 12.1.7.3. Company Financials
- 12.1.7.4. SWOT Analysis
- 12.1.1 NXP Semiconductors (Netherland)
- 12.2. Market Entropy
- 12.2.1 Company's Key Areas Served
- 12.2.2 Recent Developments
- 12.3. Company Market Share Analysis 2025
- 12.3.1 Top 5 Companies Market Share Analysis
- 12.3.2 Top 3 Companies Market Share Analysis
- 12.4. List of Potential Customers
- 13. Research Methodology
List of Figures
- Figure 1: Global Nfc Product Revenue Breakdown (million, %) by Region 2025 & 2033
- Figure 2: North America Nfc Product Revenue (million), by Application 2025 & 2033
- Figure 3: North America Nfc Product Revenue Share (%), by Application 2025 & 2033
- Figure 4: North America Nfc Product Revenue (million), by Type 2025 & 2033
- Figure 5: North America Nfc Product Revenue Share (%), by Type 2025 & 2033
- Figure 6: North America Nfc Product Revenue (million), by Country 2025 & 2033
- Figure 7: North America Nfc Product Revenue Share (%), by Country 2025 & 2033
- Figure 8: South America Nfc Product Revenue (million), by Application 2025 & 2033
- Figure 9: South America Nfc Product Revenue Share (%), by Application 2025 & 2033
- Figure 10: South America Nfc Product Revenue (million), by Type 2025 & 2033
- Figure 11: South America Nfc Product Revenue Share (%), by Type 2025 & 2033
- Figure 12: South America Nfc Product Revenue (million), by Country 2025 & 2033
- Figure 13: South America Nfc Product Revenue Share (%), by Country 2025 & 2033
- Figure 14: Europe Nfc Product Revenue (million), by Application 2025 & 2033
- Figure 15: Europe Nfc Product Revenue Share (%), by Application 2025 & 2033
- Figure 16: Europe Nfc Product Revenue (million), by Type 2025 & 2033
- Figure 17: Europe Nfc Product Revenue Share (%), by Type 2025 & 2033
- Figure 18: Europe Nfc Product Revenue (million), by Country 2025 & 2033
- Figure 19: Europe Nfc Product Revenue Share (%), by Country 2025 & 2033
- Figure 20: Middle East & Africa Nfc Product Revenue (million), by Application 2025 & 2033
- Figure 21: Middle East & Africa Nfc Product Revenue Share (%), by Application 2025 & 2033
- Figure 22: Middle East & Africa Nfc Product Revenue (million), by Type 2025 & 2033
- Figure 23: Middle East & Africa Nfc Product Revenue Share (%), by Type 2025 & 2033
- Figure 24: Middle East & Africa Nfc Product Revenue (million), by Country 2025 & 2033
- Figure 25: Middle East & Africa Nfc Product Revenue Share (%), by Country 2025 & 2033
- Figure 26: Asia Pacific Nfc Product Revenue (million), by Application 2025 & 2033
- Figure 27: Asia Pacific Nfc Product Revenue Share (%), by Application 2025 & 2033
- Figure 28: Asia Pacific Nfc Product Revenue (million), by Type 2025 & 2033
- Figure 29: Asia Pacific Nfc Product Revenue Share (%), by Type 2025 & 2033
- Figure 30: Asia Pacific Nfc Product Revenue (million), by Country 2025 & 2033
- Figure 31: Asia Pacific Nfc Product Revenue Share (%), by Country 2025 & 2033
List of Tables
- Table 1: Global Nfc Product Revenue million Forecast, by Application 2020 & 2033
- Table 2: Global Nfc Product Revenue million Forecast, by Type 2020 & 2033
- Table 3: Global Nfc Product Revenue million Forecast, by Region 2020 & 2033
- Table 4: Global Nfc Product Revenue million Forecast, by Application 2020 & 2033
- Table 5: Global Nfc Product Revenue million Forecast, by Type 2020 & 2033
- Table 6: Global Nfc Product Revenue million Forecast, by Country 2020 & 2033
- Table 7: United States Nfc Product Revenue (million) Forecast, by Application 2020 & 2033
- Table 8: Canada Nfc Product Revenue (million) Forecast, by Application 2020 & 2033
- Table 9: Mexico Nfc Product Revenue (million) Forecast, by Application 2020 & 2033
- Table 10: Global Nfc Product Revenue million Forecast, by Application 2020 & 2033
- Table 11: Global Nfc Product Revenue million Forecast, by Type 2020 & 2033
- Table 12: Global Nfc Product Revenue million Forecast, by Country 2020 & 2033
- Table 13: Brazil Nfc Product Revenue (million) Forecast, by Application 2020 & 2033
- Table 14: Argentina Nfc Product Revenue (million) Forecast, by Application 2020 & 2033
- Table 15: Rest of South America Nfc Product Revenue (million) Forecast, by Application 2020 & 2033
- Table 16: Global Nfc Product Revenue million Forecast, by Application 2020 & 2033
- Table 17: Global Nfc Product Revenue million Forecast, by Type 2020 & 2033
- Table 18: Global Nfc Product Revenue million Forecast, by Country 2020 & 2033
- Table 19: United Kingdom Nfc Product Revenue (million) Forecast, by Application 2020 & 2033
- Table 20: Germany Nfc Product Revenue (million) Forecast, by Application 2020 & 2033
- Table 21: France Nfc Product Revenue (million) Forecast, by Application 2020 & 2033
- Table 22: Italy Nfc Product Revenue (million) Forecast, by Application 2020 & 2033
- Table 23: Spain Nfc Product Revenue (million) Forecast, by Application 2020 & 2033
- Table 24: Russia Nfc Product Revenue (million) Forecast, by Application 2020 & 2033
- Table 25: Benelux Nfc Product Revenue (million) Forecast, by Application 2020 & 2033
- Table 26: Nordics Nfc Product Revenue (million) Forecast, by Application 2020 & 2033
- Table 27: Rest of Europe Nfc Product Revenue (million) Forecast, by Application 2020 & 2033
- Table 28: Global Nfc Product Revenue million Forecast, by Application 2020 & 2033
- Table 29: Global Nfc Product Revenue million Forecast, by Type 2020 & 2033
- Table 30: Global Nfc Product Revenue million Forecast, by Country 2020 & 2033
- Table 31: Turkey Nfc Product Revenue (million) Forecast, by Application 2020 & 2033
- Table 32: Israel Nfc Product Revenue (million) Forecast, by Application 2020 & 2033
- Table 33: GCC Nfc Product Revenue (million) Forecast, by Application 2020 & 2033
- Table 34: North Africa Nfc Product Revenue (million) Forecast, by Application 2020 & 2033
- Table 35: South Africa Nfc Product Revenue (million) Forecast, by Application 2020 & 2033
- Table 36: Rest of Middle East & Africa Nfc Product Revenue (million) Forecast, by Application 2020 & 2033
- Table 37: Global Nfc Product Revenue million Forecast, by Application 2020 & 2033
- Table 38: Global Nfc Product Revenue million Forecast, by Type 2020 & 2033
- Table 39: Global Nfc Product Revenue million Forecast, by Country 2020 & 2033
- Table 40: China Nfc Product Revenue (million) Forecast, by Application 2020 & 2033
- Table 41: India Nfc Product Revenue (million) Forecast, by Application 2020 & 2033
- Table 42: Japan Nfc Product Revenue (million) Forecast, by Application 2020 & 2033
- Table 43: South Korea Nfc Product Revenue (million) Forecast, by Application 2020 & 2033
- Table 44: ASEAN Nfc Product Revenue (million) Forecast, by Application 2020 & 2033
- Table 45: Oceania Nfc Product Revenue (million) Forecast, by Application 2020 & 2033
- Table 46: Rest of Asia Pacific Nfc Product Revenue (million) Forecast, by Application 2020 & 2033
Frequently Asked Questions
1. What is the projected Compound Annual Growth Rate (CAGR) of the Nfc Product?
The projected CAGR is approximately XXX%.
2. Which companies are prominent players in the Nfc Product?
Key companies in the market include NXP Semiconductors (Netherland), Broadcom Corporation (U.S.), STMicroelectronics NV (Switzerland), MediaTek, Inc. (Taiwan), Renesas Electronics Corporation (Japan), Gemalto NV (Netherlands), Texas Instruments (U.S.).
3. What are the main segments of the Nfc Product?
The market segments include Application, Type.
4. Can you provide details about the market size?
The market size is estimated to be USD XXX million as of 2022.
5. What are some drivers contributing to market growth?
N/A
6. What are the notable trends driving market growth?
N/A
7. Are there any restraints impacting market growth?
N/A
8. Can you provide examples of recent developments in the market?
N/A
9. What pricing options are available for accessing the report?
Pricing options include single-user, multi-user, and enterprise licenses priced at USD 2900.00, USD 4350.00, and USD 5800.00 respectively.
10. Is the market size provided in terms of value or volume?
The market size is provided in terms of value, measured in million.
11. Are there any specific market keywords associated with the report?
Yes, the market keyword associated with the report is "Nfc Product," which aids in identifying and referencing the specific market segment covered.
12. How do I determine which pricing option suits my needs best?
The pricing options vary based on user requirements and access needs. Individual users may opt for single-user licenses, while businesses requiring broader access may choose multi-user or enterprise licenses for cost-effective access to the report.
13. Are there any additional resources or data provided in the Nfc Product report?
While the report offers comprehensive insights, it's advisable to review the specific contents or supplementary materials provided to ascertain if additional resources or data are available.
14. How can I stay updated on further developments or reports in the Nfc Product?
To stay informed about further developments, trends, and reports in the Nfc Product, consider subscribing to industry newsletters, following relevant companies and organizations, or regularly checking reputable industry news sources and publications.
Methodology
Step 1 - Identification of Relevant Samples Size from Population Database


Step 2 - Approaches for Defining Global Market Size (Value, Volume* & Price*)

Note*: In applicable scenarios
Step 3 - Data Sources
Primary Research
- Web Analytics
- Survey Reports
- Research Institute
- Latest Research Reports
- Opinion Leaders
Secondary Research
- Annual Reports
- White Paper
- Latest Press Release
- Industry Association
- Paid Database
- Investor Presentations

Step 4 - Data Triangulation
Involves using different sources of information in order to increase the validity of a study
These sources are likely to be stakeholders in a program - participants, other researchers, program staff, other community members, and so on.
Then we put all data in single framework & apply various statistical tools to find out the dynamic on the market.
During the analysis stage, feedback from the stakeholder groups would be compared to determine areas of agreement as well as areas of divergence

