

Key Insights
The Next Generation Core Network (NGCN) hardware market is poised for significant expansion, propelled by escalating demand for high-bandwidth, low-latency connectivity. This growth is fueled by the widespread adoption of 5G, the Internet of Things (IoT), and cloud services. The market, projected to reach a size of $32.9 billion in the base year 2025, is anticipated to grow at a Compound Annual Growth Rate (CAGR) of 7.7% from 2025 to 2033. Key growth catalysts include the global deployment of 5G infrastructure, the proliferation of edge computing, and the strategic adoption of network virtualization and software-defined networking (SDN) to optimize network agility and efficiency. Leading industry players are actively investing in research and development, driving innovation and fostering a competitive landscape for advanced NGCN solutions. The market is segmented by hardware components, network functions, and deployment models, with a notable shift towards software-defined and cloud-based solutions offering enhanced flexibility and scalability.
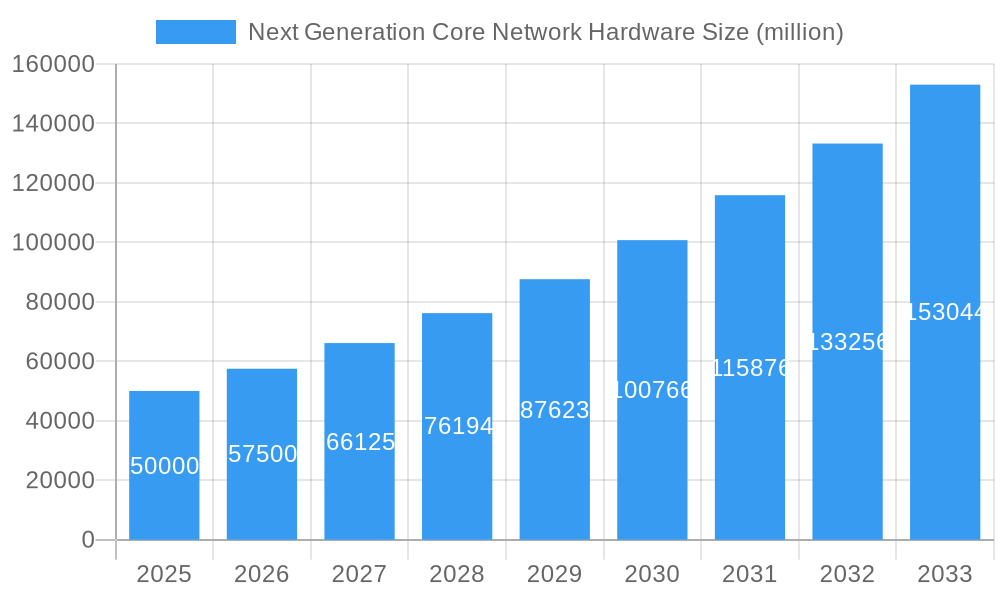
Next Generation Core Network Hardware Market Size (In Billion)
While initial investment costs and network upgrade complexities present market restraints, the inherent long-term advantages of superior network performance and scalability are expected to drive sustained market growth. North America and Europe currently lead the NGCN hardware market, with rapid adoption anticipated in Asia-Pacific and other emerging economies throughout the forecast period. Emerging trends such as the increasing embrace of open RAN architectures, AI-driven network management, and the implementation of network slicing are actively reshaping the future trajectory of NGCN hardware. This evolution necessitates robust cybersecurity protocols to protect increasingly interconnected and complex network infrastructures. Strategic alliances and collaborations are also becoming instrumental in accelerating innovation and the deployment of next-generation network technologies.
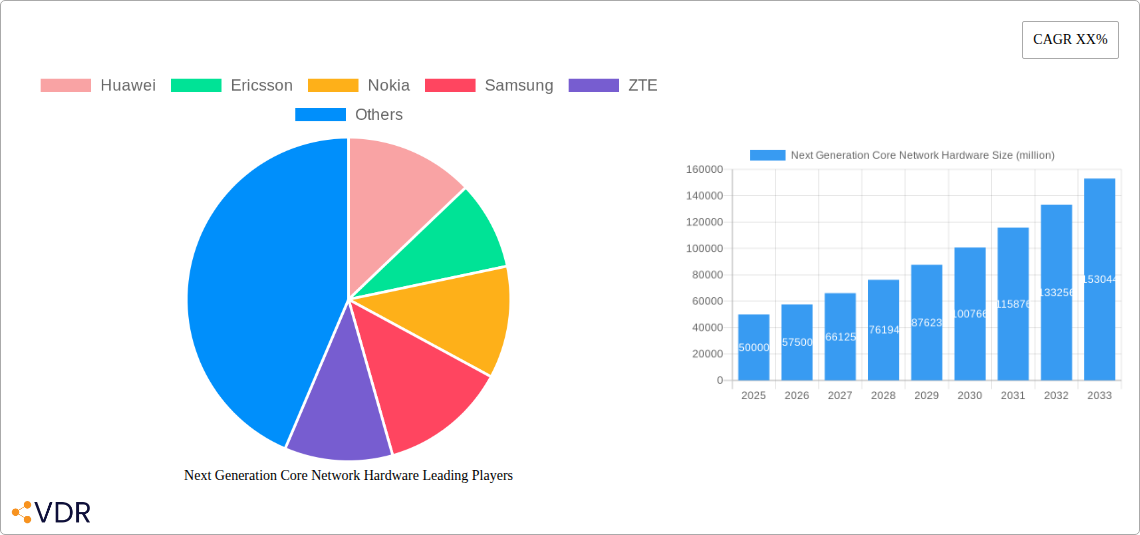
Next Generation Core Network Hardware Company Market Share
Next Generation Core Network Hardware Market Report: 2019-2033
This comprehensive report provides a detailed analysis of the Next Generation Core Network Hardware market, encompassing market dynamics, growth trends, regional segmentation, product landscape, and key player strategies. The study period covers 2019-2033, with a base year of 2025 and a forecast period of 2025-2033. This report is essential for industry professionals, investors, and strategists seeking to understand and capitalize on the evolving landscape of next-generation network infrastructure. The parent market is Telecommunications Equipment and the child market is Core Network Infrastructure. The market size is projected to reach xx million units by 2033.
Next Generation Core Network Hardware Market Dynamics & Structure
The Next Generation Core Network Hardware market is characterized by high concentration among a few major players, including Huawei, Ericsson, Nokia, Samsung, ZTE, Qualcomm, Cisco, and Intel. Technological innovation, particularly in areas like 5G and edge computing, is a key driver, while regulatory frameworks and standardization efforts influence market development. The competitive landscape is intense, with companies focusing on product differentiation, strategic partnerships, and mergers & acquisitions (M&A) to gain market share. The substitution of legacy hardware with next-generation solutions is a significant trend.
- Market Concentration: High, with top 5 players holding xx% market share in 2025.
- Technological Innovation Drivers: 5G, edge computing, network slicing, software-defined networking (SDN), and network function virtualization (NFV).
- Regulatory Frameworks: Government policies promoting digital infrastructure development and spectrum allocation significantly impact market growth.
- Competitive Product Substitutes: Virtualized network functions are a key substitute.
- End-User Demographics: Telecommunication service providers (TSPs), cloud providers, and enterprises are the primary end-users.
- M&A Trends: A moderate number of M&A deals, averaging xx per year during the historical period, focused on acquiring specialized technologies or expanding geographic reach.
Next Generation Core Network Hardware Growth Trends & Insights
The Next Generation Core Network Hardware market experienced substantial growth during the historical period (2019-2024), driven by increasing adoption of 5G networks and the rise of cloud-based services. The market is projected to continue its expansion, with a Compound Annual Growth Rate (CAGR) of xx% during the forecast period (2025-2033). This growth is fueled by the increasing demand for high-bandwidth, low-latency connectivity across various sectors, including mobile broadband, IoT, and enterprise applications. The market penetration rate for next-generation core network hardware is expected to reach xx% by 2033. Technological disruptions, such as the widespread deployment of 5G and the increasing adoption of edge computing, are key drivers of this growth. Consumer behavior shifts toward greater reliance on data-intensive applications and services further contribute to market expansion.
Dominant Regions, Countries, or Segments in Next Generation Core Network Hardware
North America and Asia-Pacific are the dominant regions in the Next Generation Core Network Hardware market, exhibiting the highest growth rates and market share. Within Asia-Pacific, China and Japan lead, driven by robust investments in 5G infrastructure and the thriving mobile broadband market. North America's dominance is due to early adoption of 5G and a well-established telecommunications infrastructure.
- Key Drivers in Asia-Pacific: Government support for 5G deployment, large mobile subscriber base, and significant investments in digital infrastructure.
- Key Drivers in North America: Early adoption of 5G, robust telecom infrastructure, and high consumer demand for data services.
- Market Share: Asia-Pacific holds xx% market share in 2025, while North America holds xx%.
Next Generation Core Network Hardware Product Landscape
The product landscape is diverse, encompassing various hardware components, including routers, switches, and other network infrastructure elements optimized for 5G and edge computing. These products emphasize high performance, scalability, and network slicing capabilities. Key innovations include improved energy efficiency, advanced security features, and AI-driven network management capabilities. Unique selling propositions often include superior throughput, reduced latency, and enhanced network reliability.
Key Drivers, Barriers & Challenges in Next Generation Core Network Hardware
Key Drivers:
- The proliferation of 5G networks and the increasing adoption of cloud-native services are major growth drivers.
- Government investments in digital infrastructure and supportive regulatory frameworks fuel market expansion.
- The increasing demand for high-bandwidth and low-latency connectivity from various sectors creates substantial market demand.
Key Challenges:
- High initial investment costs for infrastructure upgrades pose a challenge for some TSPs.
- Supply chain disruptions and component shortages can hinder production and deployment.
- Intense competition among vendors and the emergence of disruptive technologies create pressure on profitability.
Emerging Opportunities in Next Generation Core Network Hardware
Emerging opportunities lie in expanding into untapped markets, particularly in developing economies with growing mobile penetration. Innovative applications of network slicing for specific industries (e.g., healthcare, manufacturing) are also promising areas. The integration of AI and machine learning for network optimization and predictive maintenance presents further growth potential.
Growth Accelerators in the Next Generation Core Network Hardware Industry
Technological breakthroughs, such as advancements in 6G technology and enhanced edge computing capabilities, will accelerate market growth. Strategic partnerships between hardware vendors and software providers will facilitate the development of comprehensive network solutions. Market expansion into new geographical regions and vertical markets, along with increased government support for digital infrastructure development, will further drive market expansion.
Notable Milestones in Next Generation Core Network Hardware Sector
- 2020: 5G network rollouts begin in several countries, driving demand for next-generation core network hardware.
- 2021: Major vendors announce new product lines optimized for 5G and edge computing.
- 2022: Increased focus on network security and the adoption of AI-driven network management solutions.
- 2023: Several strategic partnerships formed between hardware and software providers.
- 2024: Initial deployments of 6G test networks begin.
In-Depth Next Generation Core Network Hardware Market Outlook
The future of the Next Generation Core Network Hardware market is promising, driven by ongoing 5G deployment, the emergence of 6G, and the increasing adoption of edge computing and other innovative technologies. Strategic opportunities exist for companies that can deliver cost-effective, high-performance solutions tailored to specific industry needs. The market is expected to witness robust growth, fueled by technological advancements, expanding connectivity needs, and supportive regulatory environments. The focus will shift towards more software-defined and AI-powered solutions.
Next Generation Core Network Hardware Segmentation
-
1. Application
- 1.1. Media Entertainment
- 1.2. Smart Energy
- 1.3. Industrial Manufacturing
- 1.4. Smart Medical
- 1.5. Smart Transportation
- 1.6. Others
-
2. Types
- 2.1. 5G Network
- 2.2. 5.5G Network
- 2.3. 6G Network
Next Generation Core Network Hardware Segmentation By Geography
-
1. North America
- 1.1. United States
- 1.2. Canada
- 1.3. Mexico
-
2. South America
- 2.1. Brazil
- 2.2. Argentina
- 2.3. Rest of South America
-
3. Europe
- 3.1. United Kingdom
- 3.2. Germany
- 3.3. France
- 3.4. Italy
- 3.5. Spain
- 3.6. Russia
- 3.7. Benelux
- 3.8. Nordics
- 3.9. Rest of Europe
-
4. Middle East & Africa
- 4.1. Turkey
- 4.2. Israel
- 4.3. GCC
- 4.4. North Africa
- 4.5. South Africa
- 4.6. Rest of Middle East & Africa
-
5. Asia Pacific
- 5.1. China
- 5.2. India
- 5.3. Japan
- 5.4. South Korea
- 5.5. ASEAN
- 5.6. Oceania
- 5.7. Rest of Asia Pacific

Next Generation Core Network Hardware Regional Market Share
Geographic Coverage of Next Generation Core Network Hardware
Next Generation Core Network Hardware REPORT HIGHLIGHTS
| Aspects | Details |
|---|---|
| Study Period | 2020-2034 |
| Base Year | 2025 |
| Estimated Year | 2026 |
| Forecast Period | 2026-2034 |
| Historical Period | 2020-2025 |
| Growth Rate | CAGR of 7.7% from 2020-2034 |
| Segmentation |
|
Table of Contents
- 1. Introduction
- 1.1. Research Scope
- 1.2. Market Segmentation
- 1.3. Research Objective
- 1.4. Definitions and Assumptions
- 2. Executive Summary
- 2.1. Market Snapshot
- 3. Market Dynamics
- 3.1. Market Drivers
- 3.2. Market Restrains
- 3.3. Market Trends
- 3.4. Market Opportunities
- 4. Market Factor Analysis
- 4.1. Porters Five Forces
- 4.1.1. Bargaining Power of Suppliers
- 4.1.2. Bargaining Power of Buyers
- 4.1.3. Threat of New Entrants
- 4.1.4. Threat of Substitutes
- 4.1.5. Competitive Rivalry
- 4.2. PESTEL analysis
- 4.3. BCG Analysis
- 4.3.1. Stars (High Growth, High Market Share)
- 4.3.2. Cash Cows (Low Growth, High Market Share)
- 4.3.3. Question Mark (High Growth, Low Market Share)
- 4.3.4. Dogs (Low Growth, Low Market Share)
- 4.4. Ansoff Matrix Analysis
- 4.5. Supply Chain Analysis
- 4.6. Regulatory Landscape
- 4.7. Current Market Potential and Opportunity Assessment (TAM–SAM–SOM Framework)
- 4.8. VDR Analyst Note
- 4.1. Porters Five Forces
- 5. Market Analysis, Insights and Forecast 2021-2033
- 5.1. Market Analysis, Insights and Forecast - by Application
- 5.1.1. Media Entertainment
- 5.1.2. Smart Energy
- 5.1.3. Industrial Manufacturing
- 5.1.4. Smart Medical
- 5.1.5. Smart Transportation
- 5.1.6. Others
- 5.2. Market Analysis, Insights and Forecast - by Types
- 5.2.1. 5G Network
- 5.2.2. 5.5G Network
- 5.2.3. 6G Network
- 5.3. Market Analysis, Insights and Forecast - by Region
- 5.3.1. North America
- 5.3.2. South America
- 5.3.3. Europe
- 5.3.4. Middle East & Africa
- 5.3.5. Asia Pacific
- 5.1. Market Analysis, Insights and Forecast - by Application
- 6. Global Next Generation Core Network Hardware Analysis, Insights and Forecast, 2021-2033
- 6.1. Market Analysis, Insights and Forecast - by Application
- 6.1.1. Media Entertainment
- 6.1.2. Smart Energy
- 6.1.3. Industrial Manufacturing
- 6.1.4. Smart Medical
- 6.1.5. Smart Transportation
- 6.1.6. Others
- 6.2. Market Analysis, Insights and Forecast - by Types
- 6.2.1. 5G Network
- 6.2.2. 5.5G Network
- 6.2.3. 6G Network
- 6.1. Market Analysis, Insights and Forecast - by Application
- 7. North America Next Generation Core Network Hardware Analysis, Insights and Forecast, 2021-2033
- 7.1. Market Analysis, Insights and Forecast - by Application
- 7.1.1. Media Entertainment
- 7.1.2. Smart Energy
- 7.1.3. Industrial Manufacturing
- 7.1.4. Smart Medical
- 7.1.5. Smart Transportation
- 7.1.6. Others
- 7.2. Market Analysis, Insights and Forecast - by Types
- 7.2.1. 5G Network
- 7.2.2. 5.5G Network
- 7.2.3. 6G Network
- 7.1. Market Analysis, Insights and Forecast - by Application
- 8. South America Next Generation Core Network Hardware Analysis, Insights and Forecast, 2021-2033
- 8.1. Market Analysis, Insights and Forecast - by Application
- 8.1.1. Media Entertainment
- 8.1.2. Smart Energy
- 8.1.3. Industrial Manufacturing
- 8.1.4. Smart Medical
- 8.1.5. Smart Transportation
- 8.1.6. Others
- 8.2. Market Analysis, Insights and Forecast - by Types
- 8.2.1. 5G Network
- 8.2.2. 5.5G Network
- 8.2.3. 6G Network
- 8.1. Market Analysis, Insights and Forecast - by Application
- 9. Europe Next Generation Core Network Hardware Analysis, Insights and Forecast, 2021-2033
- 9.1. Market Analysis, Insights and Forecast - by Application
- 9.1.1. Media Entertainment
- 9.1.2. Smart Energy
- 9.1.3. Industrial Manufacturing
- 9.1.4. Smart Medical
- 9.1.5. Smart Transportation
- 9.1.6. Others
- 9.2. Market Analysis, Insights and Forecast - by Types
- 9.2.1. 5G Network
- 9.2.2. 5.5G Network
- 9.2.3. 6G Network
- 9.1. Market Analysis, Insights and Forecast - by Application
- 10. Middle East & Africa Next Generation Core Network Hardware Analysis, Insights and Forecast, 2021-2033
- 10.1. Market Analysis, Insights and Forecast - by Application
- 10.1.1. Media Entertainment
- 10.1.2. Smart Energy
- 10.1.3. Industrial Manufacturing
- 10.1.4. Smart Medical
- 10.1.5. Smart Transportation
- 10.1.6. Others
- 10.2. Market Analysis, Insights and Forecast - by Types
- 10.2.1. 5G Network
- 10.2.2. 5.5G Network
- 10.2.3. 6G Network
- 10.1. Market Analysis, Insights and Forecast - by Application
- 11. Asia Pacific Next Generation Core Network Hardware Analysis, Insights and Forecast, 2021-2033
- 11.1. Market Analysis, Insights and Forecast - by Application
- 11.1.1. Media Entertainment
- 11.1.2. Smart Energy
- 11.1.3. Industrial Manufacturing
- 11.1.4. Smart Medical
- 11.1.5. Smart Transportation
- 11.1.6. Others
- 11.2. Market Analysis, Insights and Forecast - by Types
- 11.2.1. 5G Network
- 11.2.2. 5.5G Network
- 11.2.3. 6G Network
- 11.1. Market Analysis, Insights and Forecast - by Application
- 12. Competitive Analysis
- 12.1. Company Profiles
- 12.1.1 Huawei
- 12.1.1.1. Company Overview
- 12.1.1.2. Products
- 12.1.1.3. Company Financials
- 12.1.1.4. SWOT Analysis
- 12.1.2 Ericsson
- 12.1.2.1. Company Overview
- 12.1.2.2. Products
- 12.1.2.3. Company Financials
- 12.1.2.4. SWOT Analysis
- 12.1.3 Nokia
- 12.1.3.1. Company Overview
- 12.1.3.2. Products
- 12.1.3.3. Company Financials
- 12.1.3.4. SWOT Analysis
- 12.1.4 Samsung
- 12.1.4.1. Company Overview
- 12.1.4.2. Products
- 12.1.4.3. Company Financials
- 12.1.4.4. SWOT Analysis
- 12.1.5 ZTE
- 12.1.5.1. Company Overview
- 12.1.5.2. Products
- 12.1.5.3. Company Financials
- 12.1.5.4. SWOT Analysis
- 12.1.6 Qualcomm
- 12.1.6.1. Company Overview
- 12.1.6.2. Products
- 12.1.6.3. Company Financials
- 12.1.6.4. SWOT Analysis
- 12.1.7 Cisco
- 12.1.7.1. Company Overview
- 12.1.7.2. Products
- 12.1.7.3. Company Financials
- 12.1.7.4. SWOT Analysis
- 12.1.8 Intel
- 12.1.8.1. Company Overview
- 12.1.8.2. Products
- 12.1.8.3. Company Financials
- 12.1.8.4. SWOT Analysis
- 12.1.1 Huawei
- 12.2. Market Entropy
- 12.2.1 Company's Key Areas Served
- 12.2.2 Recent Developments
- 12.3. Company Market Share Analysis 2025
- 12.3.1 Top 5 Companies Market Share Analysis
- 12.3.2 Top 3 Companies Market Share Analysis
- 12.4. List of Potential Customers
- 13. Research Methodology
List of Figures
- Figure 1: Global Next Generation Core Network Hardware Revenue Breakdown (billion, %) by Region 2025 & 2033
- Figure 2: Global Next Generation Core Network Hardware Volume Breakdown (K, %) by Region 2025 & 2033
- Figure 3: North America Next Generation Core Network Hardware Revenue (billion), by Application 2025 & 2033
- Figure 4: North America Next Generation Core Network Hardware Volume (K), by Application 2025 & 2033
- Figure 5: North America Next Generation Core Network Hardware Revenue Share (%), by Application 2025 & 2033
- Figure 6: North America Next Generation Core Network Hardware Volume Share (%), by Application 2025 & 2033
- Figure 7: North America Next Generation Core Network Hardware Revenue (billion), by Types 2025 & 2033
- Figure 8: North America Next Generation Core Network Hardware Volume (K), by Types 2025 & 2033
- Figure 9: North America Next Generation Core Network Hardware Revenue Share (%), by Types 2025 & 2033
- Figure 10: North America Next Generation Core Network Hardware Volume Share (%), by Types 2025 & 2033
- Figure 11: North America Next Generation Core Network Hardware Revenue (billion), by Country 2025 & 2033
- Figure 12: North America Next Generation Core Network Hardware Volume (K), by Country 2025 & 2033
- Figure 13: North America Next Generation Core Network Hardware Revenue Share (%), by Country 2025 & 2033
- Figure 14: North America Next Generation Core Network Hardware Volume Share (%), by Country 2025 & 2033
- Figure 15: South America Next Generation Core Network Hardware Revenue (billion), by Application 2025 & 2033
- Figure 16: South America Next Generation Core Network Hardware Volume (K), by Application 2025 & 2033
- Figure 17: South America Next Generation Core Network Hardware Revenue Share (%), by Application 2025 & 2033
- Figure 18: South America Next Generation Core Network Hardware Volume Share (%), by Application 2025 & 2033
- Figure 19: South America Next Generation Core Network Hardware Revenue (billion), by Types 2025 & 2033
- Figure 20: South America Next Generation Core Network Hardware Volume (K), by Types 2025 & 2033
- Figure 21: South America Next Generation Core Network Hardware Revenue Share (%), by Types 2025 & 2033
- Figure 22: South America Next Generation Core Network Hardware Volume Share (%), by Types 2025 & 2033
- Figure 23: South America Next Generation Core Network Hardware Revenue (billion), by Country 2025 & 2033
- Figure 24: South America Next Generation Core Network Hardware Volume (K), by Country 2025 & 2033
- Figure 25: South America Next Generation Core Network Hardware Revenue Share (%), by Country 2025 & 2033
- Figure 26: South America Next Generation Core Network Hardware Volume Share (%), by Country 2025 & 2033
- Figure 27: Europe Next Generation Core Network Hardware Revenue (billion), by Application 2025 & 2033
- Figure 28: Europe Next Generation Core Network Hardware Volume (K), by Application 2025 & 2033
- Figure 29: Europe Next Generation Core Network Hardware Revenue Share (%), by Application 2025 & 2033
- Figure 30: Europe Next Generation Core Network Hardware Volume Share (%), by Application 2025 & 2033
- Figure 31: Europe Next Generation Core Network Hardware Revenue (billion), by Types 2025 & 2033
- Figure 32: Europe Next Generation Core Network Hardware Volume (K), by Types 2025 & 2033
- Figure 33: Europe Next Generation Core Network Hardware Revenue Share (%), by Types 2025 & 2033
- Figure 34: Europe Next Generation Core Network Hardware Volume Share (%), by Types 2025 & 2033
- Figure 35: Europe Next Generation Core Network Hardware Revenue (billion), by Country 2025 & 2033
- Figure 36: Europe Next Generation Core Network Hardware Volume (K), by Country 2025 & 2033
- Figure 37: Europe Next Generation Core Network Hardware Revenue Share (%), by Country 2025 & 2033
- Figure 38: Europe Next Generation Core Network Hardware Volume Share (%), by Country 2025 & 2033
- Figure 39: Middle East & Africa Next Generation Core Network Hardware Revenue (billion), by Application 2025 & 2033
- Figure 40: Middle East & Africa Next Generation Core Network Hardware Volume (K), by Application 2025 & 2033
- Figure 41: Middle East & Africa Next Generation Core Network Hardware Revenue Share (%), by Application 2025 & 2033
- Figure 42: Middle East & Africa Next Generation Core Network Hardware Volume Share (%), by Application 2025 & 2033
- Figure 43: Middle East & Africa Next Generation Core Network Hardware Revenue (billion), by Types 2025 & 2033
- Figure 44: Middle East & Africa Next Generation Core Network Hardware Volume (K), by Types 2025 & 2033
- Figure 45: Middle East & Africa Next Generation Core Network Hardware Revenue Share (%), by Types 2025 & 2033
- Figure 46: Middle East & Africa Next Generation Core Network Hardware Volume Share (%), by Types 2025 & 2033
- Figure 47: Middle East & Africa Next Generation Core Network Hardware Revenue (billion), by Country 2025 & 2033
- Figure 48: Middle East & Africa Next Generation Core Network Hardware Volume (K), by Country 2025 & 2033
- Figure 49: Middle East & Africa Next Generation Core Network Hardware Revenue Share (%), by Country 2025 & 2033
- Figure 50: Middle East & Africa Next Generation Core Network Hardware Volume Share (%), by Country 2025 & 2033
- Figure 51: Asia Pacific Next Generation Core Network Hardware Revenue (billion), by Application 2025 & 2033
- Figure 52: Asia Pacific Next Generation Core Network Hardware Volume (K), by Application 2025 & 2033
- Figure 53: Asia Pacific Next Generation Core Network Hardware Revenue Share (%), by Application 2025 & 2033
- Figure 54: Asia Pacific Next Generation Core Network Hardware Volume Share (%), by Application 2025 & 2033
- Figure 55: Asia Pacific Next Generation Core Network Hardware Revenue (billion), by Types 2025 & 2033
- Figure 56: Asia Pacific Next Generation Core Network Hardware Volume (K), by Types 2025 & 2033
- Figure 57: Asia Pacific Next Generation Core Network Hardware Revenue Share (%), by Types 2025 & 2033
- Figure 58: Asia Pacific Next Generation Core Network Hardware Volume Share (%), by Types 2025 & 2033
- Figure 59: Asia Pacific Next Generation Core Network Hardware Revenue (billion), by Country 2025 & 2033
- Figure 60: Asia Pacific Next Generation Core Network Hardware Volume (K), by Country 2025 & 2033
- Figure 61: Asia Pacific Next Generation Core Network Hardware Revenue Share (%), by Country 2025 & 2033
- Figure 62: Asia Pacific Next Generation Core Network Hardware Volume Share (%), by Country 2025 & 2033
List of Tables
- Table 1: Global Next Generation Core Network Hardware Revenue billion Forecast, by Application 2020 & 2033
- Table 2: Global Next Generation Core Network Hardware Volume K Forecast, by Application 2020 & 2033
- Table 3: Global Next Generation Core Network Hardware Revenue billion Forecast, by Types 2020 & 2033
- Table 4: Global Next Generation Core Network Hardware Volume K Forecast, by Types 2020 & 2033
- Table 5: Global Next Generation Core Network Hardware Revenue billion Forecast, by Region 2020 & 2033
- Table 6: Global Next Generation Core Network Hardware Volume K Forecast, by Region 2020 & 2033
- Table 7: Global Next Generation Core Network Hardware Revenue billion Forecast, by Application 2020 & 2033
- Table 8: Global Next Generation Core Network Hardware Volume K Forecast, by Application 2020 & 2033
- Table 9: Global Next Generation Core Network Hardware Revenue billion Forecast, by Types 2020 & 2033
- Table 10: Global Next Generation Core Network Hardware Volume K Forecast, by Types 2020 & 2033
- Table 11: Global Next Generation Core Network Hardware Revenue billion Forecast, by Country 2020 & 2033
- Table 12: Global Next Generation Core Network Hardware Volume K Forecast, by Country 2020 & 2033
- Table 13: United States Next Generation Core Network Hardware Revenue (billion) Forecast, by Application 2020 & 2033
- Table 14: United States Next Generation Core Network Hardware Volume (K) Forecast, by Application 2020 & 2033
- Table 15: Canada Next Generation Core Network Hardware Revenue (billion) Forecast, by Application 2020 & 2033
- Table 16: Canada Next Generation Core Network Hardware Volume (K) Forecast, by Application 2020 & 2033
- Table 17: Mexico Next Generation Core Network Hardware Revenue (billion) Forecast, by Application 2020 & 2033
- Table 18: Mexico Next Generation Core Network Hardware Volume (K) Forecast, by Application 2020 & 2033
- Table 19: Global Next Generation Core Network Hardware Revenue billion Forecast, by Application 2020 & 2033
- Table 20: Global Next Generation Core Network Hardware Volume K Forecast, by Application 2020 & 2033
- Table 21: Global Next Generation Core Network Hardware Revenue billion Forecast, by Types 2020 & 2033
- Table 22: Global Next Generation Core Network Hardware Volume K Forecast, by Types 2020 & 2033
- Table 23: Global Next Generation Core Network Hardware Revenue billion Forecast, by Country 2020 & 2033
- Table 24: Global Next Generation Core Network Hardware Volume K Forecast, by Country 2020 & 2033
- Table 25: Brazil Next Generation Core Network Hardware Revenue (billion) Forecast, by Application 2020 & 2033
- Table 26: Brazil Next Generation Core Network Hardware Volume (K) Forecast, by Application 2020 & 2033
- Table 27: Argentina Next Generation Core Network Hardware Revenue (billion) Forecast, by Application 2020 & 2033
- Table 28: Argentina Next Generation Core Network Hardware Volume (K) Forecast, by Application 2020 & 2033
- Table 29: Rest of South America Next Generation Core Network Hardware Revenue (billion) Forecast, by Application 2020 & 2033
- Table 30: Rest of South America Next Generation Core Network Hardware Volume (K) Forecast, by Application 2020 & 2033
- Table 31: Global Next Generation Core Network Hardware Revenue billion Forecast, by Application 2020 & 2033
- Table 32: Global Next Generation Core Network Hardware Volume K Forecast, by Application 2020 & 2033
- Table 33: Global Next Generation Core Network Hardware Revenue billion Forecast, by Types 2020 & 2033
- Table 34: Global Next Generation Core Network Hardware Volume K Forecast, by Types 2020 & 2033
- Table 35: Global Next Generation Core Network Hardware Revenue billion Forecast, by Country 2020 & 2033
- Table 36: Global Next Generation Core Network Hardware Volume K Forecast, by Country 2020 & 2033
- Table 37: United Kingdom Next Generation Core Network Hardware Revenue (billion) Forecast, by Application 2020 & 2033
- Table 38: United Kingdom Next Generation Core Network Hardware Volume (K) Forecast, by Application 2020 & 2033
- Table 39: Germany Next Generation Core Network Hardware Revenue (billion) Forecast, by Application 2020 & 2033
- Table 40: Germany Next Generation Core Network Hardware Volume (K) Forecast, by Application 2020 & 2033
- Table 41: France Next Generation Core Network Hardware Revenue (billion) Forecast, by Application 2020 & 2033
- Table 42: France Next Generation Core Network Hardware Volume (K) Forecast, by Application 2020 & 2033
- Table 43: Italy Next Generation Core Network Hardware Revenue (billion) Forecast, by Application 2020 & 2033
- Table 44: Italy Next Generation Core Network Hardware Volume (K) Forecast, by Application 2020 & 2033
- Table 45: Spain Next Generation Core Network Hardware Revenue (billion) Forecast, by Application 2020 & 2033
- Table 46: Spain Next Generation Core Network Hardware Volume (K) Forecast, by Application 2020 & 2033
- Table 47: Russia Next Generation Core Network Hardware Revenue (billion) Forecast, by Application 2020 & 2033
- Table 48: Russia Next Generation Core Network Hardware Volume (K) Forecast, by Application 2020 & 2033
- Table 49: Benelux Next Generation Core Network Hardware Revenue (billion) Forecast, by Application 2020 & 2033
- Table 50: Benelux Next Generation Core Network Hardware Volume (K) Forecast, by Application 2020 & 2033
- Table 51: Nordics Next Generation Core Network Hardware Revenue (billion) Forecast, by Application 2020 & 2033
- Table 52: Nordics Next Generation Core Network Hardware Volume (K) Forecast, by Application 2020 & 2033
- Table 53: Rest of Europe Next Generation Core Network Hardware Revenue (billion) Forecast, by Application 2020 & 2033
- Table 54: Rest of Europe Next Generation Core Network Hardware Volume (K) Forecast, by Application 2020 & 2033
- Table 55: Global Next Generation Core Network Hardware Revenue billion Forecast, by Application 2020 & 2033
- Table 56: Global Next Generation Core Network Hardware Volume K Forecast, by Application 2020 & 2033
- Table 57: Global Next Generation Core Network Hardware Revenue billion Forecast, by Types 2020 & 2033
- Table 58: Global Next Generation Core Network Hardware Volume K Forecast, by Types 2020 & 2033
- Table 59: Global Next Generation Core Network Hardware Revenue billion Forecast, by Country 2020 & 2033
- Table 60: Global Next Generation Core Network Hardware Volume K Forecast, by Country 2020 & 2033
- Table 61: Turkey Next Generation Core Network Hardware Revenue (billion) Forecast, by Application 2020 & 2033
- Table 62: Turkey Next Generation Core Network Hardware Volume (K) Forecast, by Application 2020 & 2033
- Table 63: Israel Next Generation Core Network Hardware Revenue (billion) Forecast, by Application 2020 & 2033
- Table 64: Israel Next Generation Core Network Hardware Volume (K) Forecast, by Application 2020 & 2033
- Table 65: GCC Next Generation Core Network Hardware Revenue (billion) Forecast, by Application 2020 & 2033
- Table 66: GCC Next Generation Core Network Hardware Volume (K) Forecast, by Application 2020 & 2033
- Table 67: North Africa Next Generation Core Network Hardware Revenue (billion) Forecast, by Application 2020 & 2033
- Table 68: North Africa Next Generation Core Network Hardware Volume (K) Forecast, by Application 2020 & 2033
- Table 69: South Africa Next Generation Core Network Hardware Revenue (billion) Forecast, by Application 2020 & 2033
- Table 70: South Africa Next Generation Core Network Hardware Volume (K) Forecast, by Application 2020 & 2033
- Table 71: Rest of Middle East & Africa Next Generation Core Network Hardware Revenue (billion) Forecast, by Application 2020 & 2033
- Table 72: Rest of Middle East & Africa Next Generation Core Network Hardware Volume (K) Forecast, by Application 2020 & 2033
- Table 73: Global Next Generation Core Network Hardware Revenue billion Forecast, by Application 2020 & 2033
- Table 74: Global Next Generation Core Network Hardware Volume K Forecast, by Application 2020 & 2033
- Table 75: Global Next Generation Core Network Hardware Revenue billion Forecast, by Types 2020 & 2033
- Table 76: Global Next Generation Core Network Hardware Volume K Forecast, by Types 2020 & 2033
- Table 77: Global Next Generation Core Network Hardware Revenue billion Forecast, by Country 2020 & 2033
- Table 78: Global Next Generation Core Network Hardware Volume K Forecast, by Country 2020 & 2033
- Table 79: China Next Generation Core Network Hardware Revenue (billion) Forecast, by Application 2020 & 2033
- Table 80: China Next Generation Core Network Hardware Volume (K) Forecast, by Application 2020 & 2033
- Table 81: India Next Generation Core Network Hardware Revenue (billion) Forecast, by Application 2020 & 2033
- Table 82: India Next Generation Core Network Hardware Volume (K) Forecast, by Application 2020 & 2033
- Table 83: Japan Next Generation Core Network Hardware Revenue (billion) Forecast, by Application 2020 & 2033
- Table 84: Japan Next Generation Core Network Hardware Volume (K) Forecast, by Application 2020 & 2033
- Table 85: South Korea Next Generation Core Network Hardware Revenue (billion) Forecast, by Application 2020 & 2033
- Table 86: South Korea Next Generation Core Network Hardware Volume (K) Forecast, by Application 2020 & 2033
- Table 87: ASEAN Next Generation Core Network Hardware Revenue (billion) Forecast, by Application 2020 & 2033
- Table 88: ASEAN Next Generation Core Network Hardware Volume (K) Forecast, by Application 2020 & 2033
- Table 89: Oceania Next Generation Core Network Hardware Revenue (billion) Forecast, by Application 2020 & 2033
- Table 90: Oceania Next Generation Core Network Hardware Volume (K) Forecast, by Application 2020 & 2033
- Table 91: Rest of Asia Pacific Next Generation Core Network Hardware Revenue (billion) Forecast, by Application 2020 & 2033
- Table 92: Rest of Asia Pacific Next Generation Core Network Hardware Volume (K) Forecast, by Application 2020 & 2033
Frequently Asked Questions
1. What is the projected Compound Annual Growth Rate (CAGR) of the Next Generation Core Network Hardware?
The projected CAGR is approximately 7.7%.
2. Which companies are prominent players in the Next Generation Core Network Hardware?
Key companies in the market include Huawei, Ericsson, Nokia, Samsung, ZTE, Qualcomm, Cisco, Intel.
3. What are the main segments of the Next Generation Core Network Hardware?
The market segments include Application, Types.
4. Can you provide details about the market size?
The market size is estimated to be USD 32.9 billion as of 2022.
5. What are some drivers contributing to market growth?
N/A
6. What are the notable trends driving market growth?
N/A
7. Are there any restraints impacting market growth?
N/A
8. Can you provide examples of recent developments in the market?
N/A
9. What pricing options are available for accessing the report?
Pricing options include single-user, multi-user, and enterprise licenses priced at USD 4350.00, USD 6525.00, and USD 8700.00 respectively.
10. Is the market size provided in terms of value or volume?
The market size is provided in terms of value, measured in billion and volume, measured in K.
11. Are there any specific market keywords associated with the report?
Yes, the market keyword associated with the report is "Next Generation Core Network Hardware," which aids in identifying and referencing the specific market segment covered.
12. How do I determine which pricing option suits my needs best?
The pricing options vary based on user requirements and access needs. Individual users may opt for single-user licenses, while businesses requiring broader access may choose multi-user or enterprise licenses for cost-effective access to the report.
13. Are there any additional resources or data provided in the Next Generation Core Network Hardware report?
While the report offers comprehensive insights, it's advisable to review the specific contents or supplementary materials provided to ascertain if additional resources or data are available.
14. How can I stay updated on further developments or reports in the Next Generation Core Network Hardware?
To stay informed about further developments, trends, and reports in the Next Generation Core Network Hardware, consider subscribing to industry newsletters, following relevant companies and organizations, or regularly checking reputable industry news sources and publications.
Methodology
Step 1 - Identification of Relevant Samples Size from Population Database


Step 2 - Approaches for Defining Global Market Size (Value, Volume* & Price*)

Note*: In applicable scenarios
Step 3 - Data Sources
Primary Research
- Web Analytics
- Survey Reports
- Research Institute
- Latest Research Reports
- Opinion Leaders
Secondary Research
- Annual Reports
- White Paper
- Latest Press Release
- Industry Association
- Paid Database
- Investor Presentations

Step 4 - Data Triangulation
Involves using different sources of information in order to increase the validity of a study
These sources are likely to be stakeholders in a program - participants, other researchers, program staff, other community members, and so on.
Then we put all data in single framework & apply various statistical tools to find out the dynamic on the market.
During the analysis stage, feedback from the stakeholder groups would be compared to determine areas of agreement as well as areas of divergence