
Key Insights
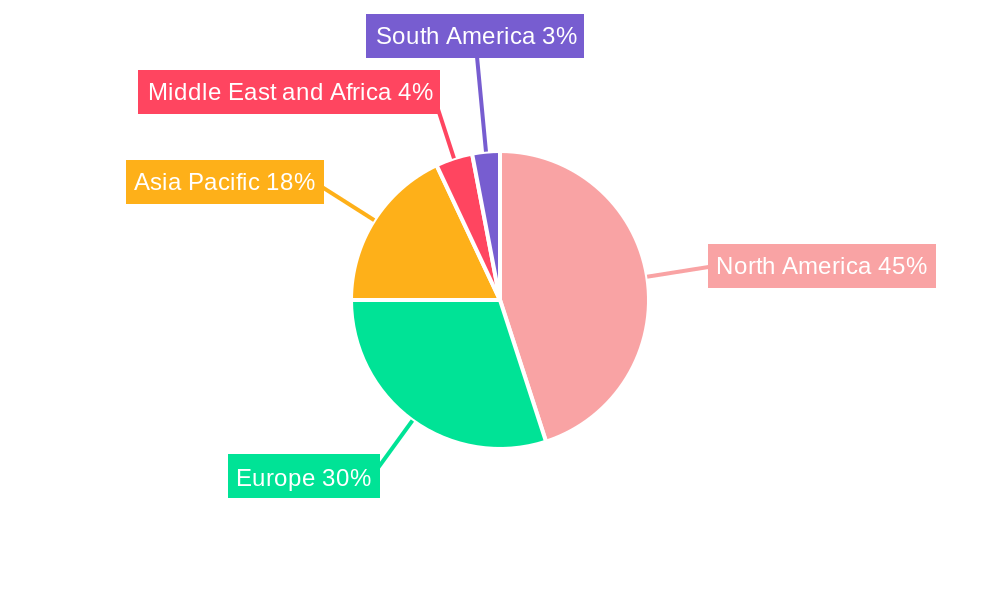
The Neurological Disorder Drugs Market, currently exhibiting robust growth, is projected to reach a substantial size driven by several key factors. The aging global population, a leading contributor to the increasing prevalence of neurological disorders like Alzheimer's disease, Parkinson's disease, and epilepsy, fuels significant demand for effective treatments. Advances in research and development are leading to the introduction of novel therapies, offering improved efficacy and reduced side effects, further stimulating market expansion. The market is segmented by disorder, drug type, and distribution channel, revealing distinct growth patterns within each segment. Cholinesterase inhibitors and other targeted therapies for Alzheimer's disease represent a significant portion of the market, while the demand for antiepileptic drugs remains strong due to the high prevalence of epilepsy globally. The increasing adoption of online pharmacies, coupled with the expansion of hospital and retail pharmacy networks, is expected to further contribute to the market's growth. North America and Europe currently hold significant market share due to high healthcare expenditure and advanced healthcare infrastructure, but the Asia-Pacific region is poised for substantial growth in the coming years, driven by rising healthcare spending and increasing awareness of neurological disorders.
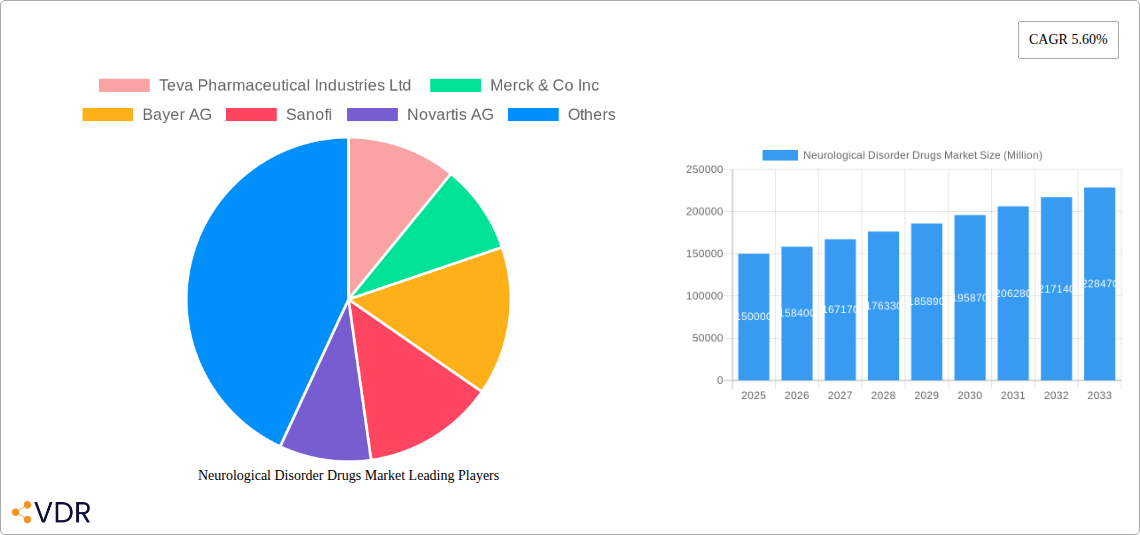
Market restraints, however, include the high cost of these specialized drugs, potentially limiting accessibility for a significant portion of the global population. The development of new drugs is a long and expensive process, creating a barrier to entry for many pharmaceutical companies. Furthermore, the complexity of neurological disorders necessitates rigorous clinical trials and post-market surveillance, further impacting the market's dynamics. Despite these challenges, the continued focus on research and development, along with government initiatives aimed at improving access to healthcare, particularly in emerging markets, will likely ensure a steady expansion of the neurological disorder drugs market throughout the forecast period (2025-2033). Competition among established pharmaceutical giants such as Teva, Merck, Bayer, Sanofi, and Novartis is intense, driving innovation and potentially leading to more affordable and effective treatments.
Neurological Disorder Drugs Market: A Comprehensive Report (2019-2033)
This comprehensive report provides a detailed analysis of the Neurological Disorder Drugs Market, encompassing market dynamics, growth trends, regional segmentation, product landscape, and key players. The study period spans from 2019 to 2033, with 2025 serving as the base and estimated year. The report offers valuable insights for industry professionals, investors, and stakeholders seeking a thorough understanding of this rapidly evolving market. The market is segmented by disorders (Epilepsy, Alzheimer's Disease, Parkinson's Disease, Multiple Sclerosis, Cerebrovascular Disease, Other Disorders), drug type (Cholinesterase Inhibitors, NMDA Receptor Antagonists, Antiepileptic, Antipsychotic and Antidepressant, Other Drugs Type), and distribution channels (Hospital Pharmacies, Online Pharmacies, Retail Pharmacies). The total market size is projected to reach xx Million units by 2033.
Neurological Disorder Drugs Market Market Dynamics & Structure
The Neurological Disorder Drugs Market is characterized by a moderately concentrated landscape with a few dominant players and several smaller niche players. Technological innovation, particularly in drug delivery systems and targeted therapies, is a major driver of market growth. Stringent regulatory frameworks, including those governing drug approvals and safety, significantly influence market dynamics. The market faces competition from alternative treatments, such as physical therapy and lifestyle changes, particularly for less severe neurological disorders. The end-user demographics are predominantly older adults, reflecting the higher incidence of neurological diseases with age. Mergers and acquisitions (M&A) activity has been moderate, with strategic partnerships playing a more significant role in market expansion.
- Market Concentration: High, with top 10 players holding approximately xx% market share in 2024.
- Technological Innovation: Focus on developing novel drug delivery methods (e.g., nanoparticles) and targeted therapies to improve efficacy and reduce side effects.
- Regulatory Framework: Stringent approval processes, requiring extensive clinical trials and safety assessments, impacting time-to-market.
- Competitive Substitutes: Non-pharmacological therapies and alternative medicine represent competitive substitutes.
- End-user Demographics: Aging population significantly contributes to market growth, with patients over 65 representing the largest segment.
- M&A Trends: Strategic partnerships for research and development are more prevalent than large-scale acquisitions, with an estimated xx M&A deals in 2024.
Neurological Disorder Drugs Market Growth Trends & Insights
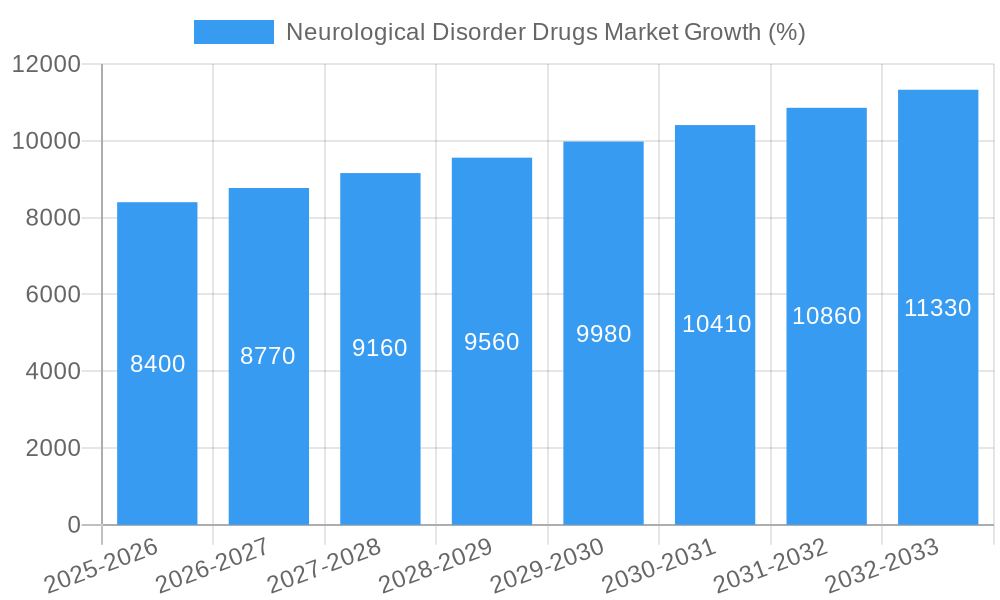
The Neurological Disorder Drugs Market has witnessed consistent growth over the historical period (2019-2024), driven by factors such as the rising prevalence of neurological disorders, an aging global population, and advancements in drug development. The market is expected to continue this trajectory, exhibiting a Compound Annual Growth Rate (CAGR) of xx% during the forecast period (2025-2033). Technological disruptions, including the development of personalized medicine and advanced diagnostic tools, are accelerating market growth. Consumer behavior shifts towards proactive healthcare management and increased access to information are also influencing the market. Market penetration for new drugs is anticipated to increase as awareness and accessibility improve. This growth is supported by improved healthcare infrastructure and increased healthcare expenditure in various regions. The market is also benefiting from the increased adoption of advanced treatment modalities and the development of more effective therapeutic agents.
Dominant Regions, Countries, or Segments in Neurological Disorder Drugs Market
North America currently holds the largest market share, driven by high healthcare spending, advanced healthcare infrastructure, and a significant elderly population. Within North America, the United States exhibits the highest demand for neurological disorder drugs. Europe is another significant market, with several key players based in the region and a substantial healthcare sector. The Asia-Pacific region is experiencing rapid growth due to the rising prevalence of neurological disorders, increasing healthcare expenditure, and improving healthcare access.
- By Disorders: Alzheimer's Disease holds the largest market share, followed by Epilepsy and Parkinson's Disease. The "Other Disorders" segment is also experiencing significant growth.
- By Drug Type: Cholinesterase Inhibitors and Antiepileptic drugs currently dominate the market. However, NMDA Receptor Antagonists and other newer drug types are experiencing increasing adoption.
- By Distribution Channels: Hospital pharmacies currently hold a major share, but online and retail pharmacies are growing rapidly, driven by convenience and affordability.
- Key Drivers: High prevalence of neurological disorders, increasing geriatric population, rising healthcare expenditure, advancements in drug development, and supportive government initiatives.
Neurological Disorder Drugs Market Product Landscape
The neurological disorder drug market showcases a diverse range of products, encompassing various drug classes with unique mechanisms of action. Recent innovations focus on enhancing efficacy, reducing side effects, and improving patient compliance through novel formulations, such as extended-release preparations and targeted drug delivery systems. Product differentiation is primarily achieved through efficacy, safety profiles, and convenience of administration. Technological advancements in drug discovery and development continuously improve treatment options for neurological disorders.
Key Drivers, Barriers & Challenges in Neurological Disorder Drugs Market
Key Drivers: Rising prevalence of neurodegenerative diseases, increased life expectancy, growing awareness about neurological disorders, and ongoing research and development efforts for new and improved therapies.
Challenges and Restraints: High cost of drug development and clinical trials, stringent regulatory requirements for drug approval, potential side effects and adverse reactions, and intellectual property protection issues. The complexity of neurological disorders also presents significant challenges in developing effective treatments.
Emerging Opportunities in Neurological Disorder Drugs Market
Significant opportunities exist in developing personalized medicine approaches, exploring innovative drug delivery systems (e.g., nanomedicine), and targeting unmet medical needs in rare neurological disorders. Expanding into emerging markets with high prevalence of neurological diseases presents further opportunities for growth. Focusing on improved patient education and disease management strategies also offers considerable potential.
Growth Accelerators in the Neurological Disorder Drugs Market Industry
Technological advancements in diagnostics and drug development are key growth accelerators. Strategic alliances and collaborations between pharmaceutical companies and research institutions are fostering innovation and accelerating the development of new therapies. Expanding market access through improved healthcare infrastructure and distribution channels in underserved regions is another significant growth driver.
Key Players Shaping the Neurological Disorder Drugs Market Market
- Teva Pharmaceutical Industries Ltd
- Merck & Co Inc
- Bayer AG
- Sanofi
- Novartis AG
- F Hoffmann-La Roche Ltd
- AstraZeneca
- Abbott
- Johnson & Johnson Private Limited
- Pfizer Inc
Notable Milestones in Neurological Disorder Drugs Market Sector
- March 2023: Biohaven Ltd. announced the development of an oral, brain-penetrant, dual inhibitor of TYK2 and JAK1 for treating neurological illnesses (excluding China).
- March 2023: Acadia Pharmaceuticals Inc. received FDA approval for DAYBUE (trofinetide) to treat Rett syndrome in patients aged two and older.
In-Depth Neurological Disorder Drugs Market Market Outlook
The Neurological Disorder Drugs Market is poised for continued growth, driven by the factors outlined above. Strategic investments in research and development, coupled with expanding market access, will shape the future of this dynamic market. The focus will remain on developing safer and more effective therapies, addressing unmet medical needs, and improving patient outcomes. The market presents considerable opportunities for innovation and growth for both established and emerging players.
Neurological Disorder Drugs Market Segmentation
-
1. Disorders
- 1.1. Epilepsy
- 1.2. Alzheimer's Disease
- 1.3. Parkinson's Disease
- 1.4. Multiple Sclerosis
- 1.5. Cerebrovascular Disease
- 1.6. Other Disorders
-
2. Drug Type
- 2.1. Cholinesterase Inhibitors
- 2.2. NMDA Receptor Antagonists
- 2.3. Antiepileptic
- 2.4. Antipsychotic and Antidepressant
- 2.5. Other Drugs Type
-
3. Distribution Channels
- 3.1. Hospital Pharmacies
- 3.2. Online Pharmacies
- 3.3. Retail Pharmacies
Neurological Disorder Drugs Market Segmentation By Geography
-
1. North America
- 1.1. United States
- 1.2. Canada
- 1.3. Mexico
-
2. Europe
- 2.1. Germany
- 2.2. United Kingdom
- 2.3. France
- 2.4. Italy
- 2.5. Spain
- 2.6. Rest of Europe
-
3. Asia Pacific
- 3.1. China
- 3.2. Japan
- 3.3. India
- 3.4. Australia
- 3.5. South Korea
- 3.6. Rest of Asia Pacific
-
4. Middle East and Africa
- 4.1. GCC
- 4.2. South Africa
- 4.3. Rest of Middle East and Africa
-
5. South America
- 5.1. Brazil
- 5.2. Argentina
- 5.3. Rest of South America
Neurological Disorder Drugs Market REPORT HIGHLIGHTS
| Aspects | Details |
|---|---|
| Study Period | 2019-2033 |
| Base Year | 2024 |
| Estimated Year | 2025 |
| Forecast Period | 2025-2033 |
| Historical Period | 2019-2024 |
| Growth Rate | CAGR of 5.60% from 2019-2033 |
| Segmentation |
|
Table of Contents
- 1. Introduction
- 1.1. Research Scope
- 1.2. Market Segmentation
- 1.3. Research Methodology
- 1.4. Definitions and Assumptions
- 2. Executive Summary
- 2.1. Introduction
- 3. Market Dynamics
- 3.1. Introduction
- 3.2. Market Drivers
- 3.2.1. High Prevalence of Neurological Diseases; Rising Awareness for Early Disease Diagnosis; Increasing Number of Research and Development for Neurological Diseases
- 3.3. Market Restrains
- 3.3.1. High Cost for Diagnosis and Treatment; Stringent Regulations Associated with the Neurological Drugs
- 3.4. Market Trends
- 3.4.1. The Alzheimer's Disease Segment is Expected to Hold a Significant Share in the Neurological Disorders Drugs Market Over the Forecast Period
- 4. Market Factor Analysis
- 4.1. Porters Five Forces
- 4.2. Supply/Value Chain
- 4.3. PESTEL analysis
- 4.4. Market Entropy
- 4.5. Patent/Trademark Analysis
- 5. Global Neurological Disorder Drugs Market Analysis, Insights and Forecast, 2019-2031
- 5.1. Market Analysis, Insights and Forecast - by Disorders
- 5.1.1. Epilepsy
- 5.1.2. Alzheimer's Disease
- 5.1.3. Parkinson's Disease
- 5.1.4. Multiple Sclerosis
- 5.1.5. Cerebrovascular Disease
- 5.1.6. Other Disorders
- 5.2. Market Analysis, Insights and Forecast - by Drug Type
- 5.2.1. Cholinesterase Inhibitors
- 5.2.2. NMDA Receptor Antagonists
- 5.2.3. Antiepileptic
- 5.2.4. Antipsychotic and Antidepressant
- 5.2.5. Other Drugs Type
- 5.3. Market Analysis, Insights and Forecast - by Distribution Channels
- 5.3.1. Hospital Pharmacies
- 5.3.2. Online Pharmacies
- 5.3.3. Retail Pharmacies
- 5.4. Market Analysis, Insights and Forecast - by Region
- 5.4.1. North America
- 5.4.2. Europe
- 5.4.3. Asia Pacific
- 5.4.4. Middle East and Africa
- 5.4.5. South America
- 5.1. Market Analysis, Insights and Forecast - by Disorders
- 6. North America Neurological Disorder Drugs Market Analysis, Insights and Forecast, 2019-2031
- 6.1. Market Analysis, Insights and Forecast - by Disorders
- 6.1.1. Epilepsy
- 6.1.2. Alzheimer's Disease
- 6.1.3. Parkinson's Disease
- 6.1.4. Multiple Sclerosis
- 6.1.5. Cerebrovascular Disease
- 6.1.6. Other Disorders
- 6.2. Market Analysis, Insights and Forecast - by Drug Type
- 6.2.1. Cholinesterase Inhibitors
- 6.2.2. NMDA Receptor Antagonists
- 6.2.3. Antiepileptic
- 6.2.4. Antipsychotic and Antidepressant
- 6.2.5. Other Drugs Type
- 6.3. Market Analysis, Insights and Forecast - by Distribution Channels
- 6.3.1. Hospital Pharmacies
- 6.3.2. Online Pharmacies
- 6.3.3. Retail Pharmacies
- 6.1. Market Analysis, Insights and Forecast - by Disorders
- 7. Europe Neurological Disorder Drugs Market Analysis, Insights and Forecast, 2019-2031
- 7.1. Market Analysis, Insights and Forecast - by Disorders
- 7.1.1. Epilepsy
- 7.1.2. Alzheimer's Disease
- 7.1.3. Parkinson's Disease
- 7.1.4. Multiple Sclerosis
- 7.1.5. Cerebrovascular Disease
- 7.1.6. Other Disorders
- 7.2. Market Analysis, Insights and Forecast - by Drug Type
- 7.2.1. Cholinesterase Inhibitors
- 7.2.2. NMDA Receptor Antagonists
- 7.2.3. Antiepileptic
- 7.2.4. Antipsychotic and Antidepressant
- 7.2.5. Other Drugs Type
- 7.3. Market Analysis, Insights and Forecast - by Distribution Channels
- 7.3.1. Hospital Pharmacies
- 7.3.2. Online Pharmacies
- 7.3.3. Retail Pharmacies
- 7.1. Market Analysis, Insights and Forecast - by Disorders
- 8. Asia Pacific Neurological Disorder Drugs Market Analysis, Insights and Forecast, 2019-2031
- 8.1. Market Analysis, Insights and Forecast - by Disorders
- 8.1.1. Epilepsy
- 8.1.2. Alzheimer's Disease
- 8.1.3. Parkinson's Disease
- 8.1.4. Multiple Sclerosis
- 8.1.5. Cerebrovascular Disease
- 8.1.6. Other Disorders
- 8.2. Market Analysis, Insights and Forecast - by Drug Type
- 8.2.1. Cholinesterase Inhibitors
- 8.2.2. NMDA Receptor Antagonists
- 8.2.3. Antiepileptic
- 8.2.4. Antipsychotic and Antidepressant
- 8.2.5. Other Drugs Type
- 8.3. Market Analysis, Insights and Forecast - by Distribution Channels
- 8.3.1. Hospital Pharmacies
- 8.3.2. Online Pharmacies
- 8.3.3. Retail Pharmacies
- 8.1. Market Analysis, Insights and Forecast - by Disorders
- 9. Middle East and Africa Neurological Disorder Drugs Market Analysis, Insights and Forecast, 2019-2031
- 9.1. Market Analysis, Insights and Forecast - by Disorders
- 9.1.1. Epilepsy
- 9.1.2. Alzheimer's Disease
- 9.1.3. Parkinson's Disease
- 9.1.4. Multiple Sclerosis
- 9.1.5. Cerebrovascular Disease
- 9.1.6. Other Disorders
- 9.2. Market Analysis, Insights and Forecast - by Drug Type
- 9.2.1. Cholinesterase Inhibitors
- 9.2.2. NMDA Receptor Antagonists
- 9.2.3. Antiepileptic
- 9.2.4. Antipsychotic and Antidepressant
- 9.2.5. Other Drugs Type
- 9.3. Market Analysis, Insights and Forecast - by Distribution Channels
- 9.3.1. Hospital Pharmacies
- 9.3.2. Online Pharmacies
- 9.3.3. Retail Pharmacies
- 9.1. Market Analysis, Insights and Forecast - by Disorders
- 10. South America Neurological Disorder Drugs Market Analysis, Insights and Forecast, 2019-2031
- 10.1. Market Analysis, Insights and Forecast - by Disorders
- 10.1.1. Epilepsy
- 10.1.2. Alzheimer's Disease
- 10.1.3. Parkinson's Disease
- 10.1.4. Multiple Sclerosis
- 10.1.5. Cerebrovascular Disease
- 10.1.6. Other Disorders
- 10.2. Market Analysis, Insights and Forecast - by Drug Type
- 10.2.1. Cholinesterase Inhibitors
- 10.2.2. NMDA Receptor Antagonists
- 10.2.3. Antiepileptic
- 10.2.4. Antipsychotic and Antidepressant
- 10.2.5. Other Drugs Type
- 10.3. Market Analysis, Insights and Forecast - by Distribution Channels
- 10.3.1. Hospital Pharmacies
- 10.3.2. Online Pharmacies
- 10.3.3. Retail Pharmacies
- 10.1. Market Analysis, Insights and Forecast - by Disorders
- 11. North America Neurological Disorder Drugs Market Analysis, Insights and Forecast, 2019-2031
- 11.1. Market Analysis, Insights and Forecast - By Country/Sub-region
- 11.1.1 United States
- 11.1.2 Canada
- 11.1.3 Mexico
- 12. Europe Neurological Disorder Drugs Market Analysis, Insights and Forecast, 2019-2031
- 12.1. Market Analysis, Insights and Forecast - By Country/Sub-region
- 12.1.1 Germany
- 12.1.2 United Kingdom
- 12.1.3 France
- 12.1.4 Italy
- 12.1.5 Spain
- 12.1.6 Rest of Europe
- 13. Asia Pacific Neurological Disorder Drugs Market Analysis, Insights and Forecast, 2019-2031
- 13.1. Market Analysis, Insights and Forecast - By Country/Sub-region
- 13.1.1 China
- 13.1.2 Japan
- 13.1.3 India
- 13.1.4 Australia
- 13.1.5 South Korea
- 13.1.6 Rest of Asia Pacific
- 14. Middle East and Africa Neurological Disorder Drugs Market Analysis, Insights and Forecast, 2019-2031
- 14.1. Market Analysis, Insights and Forecast - By Country/Sub-region
- 14.1.1 GCC
- 14.1.2 South Africa
- 14.1.3 Rest of Middle East and Africa
- 15. South America Neurological Disorder Drugs Market Analysis, Insights and Forecast, 2019-2031
- 15.1. Market Analysis, Insights and Forecast - By Country/Sub-region
- 15.1.1 Brazil
- 15.1.2 Argentina
- 15.1.3 Rest of South America
- 16. Competitive Analysis
- 16.1. Global Market Share Analysis 2024
- 16.2. Company Profiles
- 16.2.1 Teva Pharmaceutical Industries Ltd
- 16.2.1.1. Overview
- 16.2.1.2. Products
- 16.2.1.3. SWOT Analysis
- 16.2.1.4. Recent Developments
- 16.2.1.5. Financials (Based on Availability)
- 16.2.2 Merck & Co Inc
- 16.2.2.1. Overview
- 16.2.2.2. Products
- 16.2.2.3. SWOT Analysis
- 16.2.2.4. Recent Developments
- 16.2.2.5. Financials (Based on Availability)
- 16.2.3 Bayer AG
- 16.2.3.1. Overview
- 16.2.3.2. Products
- 16.2.3.3. SWOT Analysis
- 16.2.3.4. Recent Developments
- 16.2.3.5. Financials (Based on Availability)
- 16.2.4 Sanofi
- 16.2.4.1. Overview
- 16.2.4.2. Products
- 16.2.4.3. SWOT Analysis
- 16.2.4.4. Recent Developments
- 16.2.4.5. Financials (Based on Availability)
- 16.2.5 Novartis AG
- 16.2.5.1. Overview
- 16.2.5.2. Products
- 16.2.5.3. SWOT Analysis
- 16.2.5.4. Recent Developments
- 16.2.5.5. Financials (Based on Availability)
- 16.2.6 F Hoffmann-La Roche Ltd
- 16.2.6.1. Overview
- 16.2.6.2. Products
- 16.2.6.3. SWOT Analysis
- 16.2.6.4. Recent Developments
- 16.2.6.5. Financials (Based on Availability)
- 16.2.7 AstraZeneca
- 16.2.7.1. Overview
- 16.2.7.2. Products
- 16.2.7.3. SWOT Analysis
- 16.2.7.4. Recent Developments
- 16.2.7.5. Financials (Based on Availability)
- 16.2.8 Abbott
- 16.2.8.1. Overview
- 16.2.8.2. Products
- 16.2.8.3. SWOT Analysis
- 16.2.8.4. Recent Developments
- 16.2.8.5. Financials (Based on Availability)
- 16.2.9 Johnson & Johnson Private Limited
- 16.2.9.1. Overview
- 16.2.9.2. Products
- 16.2.9.3. SWOT Analysis
- 16.2.9.4. Recent Developments
- 16.2.9.5. Financials (Based on Availability)
- 16.2.10 Pfizer Inc
- 16.2.10.1. Overview
- 16.2.10.2. Products
- 16.2.10.3. SWOT Analysis
- 16.2.10.4. Recent Developments
- 16.2.10.5. Financials (Based on Availability)
- 16.2.1 Teva Pharmaceutical Industries Ltd
List of Figures
- Figure 1: Global Neurological Disorder Drugs Market Revenue Breakdown (Million, %) by Region 2024 & 2032
- Figure 2: Global Neurological Disorder Drugs Market Volume Breakdown (K Unit, %) by Region 2024 & 2032
- Figure 3: North America Neurological Disorder Drugs Market Revenue (Million), by Country 2024 & 2032
- Figure 4: North America Neurological Disorder Drugs Market Volume (K Unit), by Country 2024 & 2032
- Figure 5: North America Neurological Disorder Drugs Market Revenue Share (%), by Country 2024 & 2032
- Figure 6: North America Neurological Disorder Drugs Market Volume Share (%), by Country 2024 & 2032
- Figure 7: Europe Neurological Disorder Drugs Market Revenue (Million), by Country 2024 & 2032
- Figure 8: Europe Neurological Disorder Drugs Market Volume (K Unit), by Country 2024 & 2032
- Figure 9: Europe Neurological Disorder Drugs Market Revenue Share (%), by Country 2024 & 2032
- Figure 10: Europe Neurological Disorder Drugs Market Volume Share (%), by Country 2024 & 2032
- Figure 11: Asia Pacific Neurological Disorder Drugs Market Revenue (Million), by Country 2024 & 2032
- Figure 12: Asia Pacific Neurological Disorder Drugs Market Volume (K Unit), by Country 2024 & 2032
- Figure 13: Asia Pacific Neurological Disorder Drugs Market Revenue Share (%), by Country 2024 & 2032
- Figure 14: Asia Pacific Neurological Disorder Drugs Market Volume Share (%), by Country 2024 & 2032
- Figure 15: Middle East and Africa Neurological Disorder Drugs Market Revenue (Million), by Country 2024 & 2032
- Figure 16: Middle East and Africa Neurological Disorder Drugs Market Volume (K Unit), by Country 2024 & 2032
- Figure 17: Middle East and Africa Neurological Disorder Drugs Market Revenue Share (%), by Country 2024 & 2032
- Figure 18: Middle East and Africa Neurological Disorder Drugs Market Volume Share (%), by Country 2024 & 2032
- Figure 19: South America Neurological Disorder Drugs Market Revenue (Million), by Country 2024 & 2032
- Figure 20: South America Neurological Disorder Drugs Market Volume (K Unit), by Country 2024 & 2032
- Figure 21: South America Neurological Disorder Drugs Market Revenue Share (%), by Country 2024 & 2032
- Figure 22: South America Neurological Disorder Drugs Market Volume Share (%), by Country 2024 & 2032
- Figure 23: North America Neurological Disorder Drugs Market Revenue (Million), by Disorders 2024 & 2032
- Figure 24: North America Neurological Disorder Drugs Market Volume (K Unit), by Disorders 2024 & 2032
- Figure 25: North America Neurological Disorder Drugs Market Revenue Share (%), by Disorders 2024 & 2032
- Figure 26: North America Neurological Disorder Drugs Market Volume Share (%), by Disorders 2024 & 2032
- Figure 27: North America Neurological Disorder Drugs Market Revenue (Million), by Drug Type 2024 & 2032
- Figure 28: North America Neurological Disorder Drugs Market Volume (K Unit), by Drug Type 2024 & 2032
- Figure 29: North America Neurological Disorder Drugs Market Revenue Share (%), by Drug Type 2024 & 2032
- Figure 30: North America Neurological Disorder Drugs Market Volume Share (%), by Drug Type 2024 & 2032
- Figure 31: North America Neurological Disorder Drugs Market Revenue (Million), by Distribution Channels 2024 & 2032
- Figure 32: North America Neurological Disorder Drugs Market Volume (K Unit), by Distribution Channels 2024 & 2032
- Figure 33: North America Neurological Disorder Drugs Market Revenue Share (%), by Distribution Channels 2024 & 2032
- Figure 34: North America Neurological Disorder Drugs Market Volume Share (%), by Distribution Channels 2024 & 2032
- Figure 35: North America Neurological Disorder Drugs Market Revenue (Million), by Country 2024 & 2032
- Figure 36: North America Neurological Disorder Drugs Market Volume (K Unit), by Country 2024 & 2032
- Figure 37: North America Neurological Disorder Drugs Market Revenue Share (%), by Country 2024 & 2032
- Figure 38: North America Neurological Disorder Drugs Market Volume Share (%), by Country 2024 & 2032
- Figure 39: Europe Neurological Disorder Drugs Market Revenue (Million), by Disorders 2024 & 2032
- Figure 40: Europe Neurological Disorder Drugs Market Volume (K Unit), by Disorders 2024 & 2032
- Figure 41: Europe Neurological Disorder Drugs Market Revenue Share (%), by Disorders 2024 & 2032
- Figure 42: Europe Neurological Disorder Drugs Market Volume Share (%), by Disorders 2024 & 2032
- Figure 43: Europe Neurological Disorder Drugs Market Revenue (Million), by Drug Type 2024 & 2032
- Figure 44: Europe Neurological Disorder Drugs Market Volume (K Unit), by Drug Type 2024 & 2032
- Figure 45: Europe Neurological Disorder Drugs Market Revenue Share (%), by Drug Type 2024 & 2032
- Figure 46: Europe Neurological Disorder Drugs Market Volume Share (%), by Drug Type 2024 & 2032
- Figure 47: Europe Neurological Disorder Drugs Market Revenue (Million), by Distribution Channels 2024 & 2032
- Figure 48: Europe Neurological Disorder Drugs Market Volume (K Unit), by Distribution Channels 2024 & 2032
- Figure 49: Europe Neurological Disorder Drugs Market Revenue Share (%), by Distribution Channels 2024 & 2032
- Figure 50: Europe Neurological Disorder Drugs Market Volume Share (%), by Distribution Channels 2024 & 2032
- Figure 51: Europe Neurological Disorder Drugs Market Revenue (Million), by Country 2024 & 2032
- Figure 52: Europe Neurological Disorder Drugs Market Volume (K Unit), by Country 2024 & 2032
- Figure 53: Europe Neurological Disorder Drugs Market Revenue Share (%), by Country 2024 & 2032
- Figure 54: Europe Neurological Disorder Drugs Market Volume Share (%), by Country 2024 & 2032
- Figure 55: Asia Pacific Neurological Disorder Drugs Market Revenue (Million), by Disorders 2024 & 2032
- Figure 56: Asia Pacific Neurological Disorder Drugs Market Volume (K Unit), by Disorders 2024 & 2032
- Figure 57: Asia Pacific Neurological Disorder Drugs Market Revenue Share (%), by Disorders 2024 & 2032
- Figure 58: Asia Pacific Neurological Disorder Drugs Market Volume Share (%), by Disorders 2024 & 2032
- Figure 59: Asia Pacific Neurological Disorder Drugs Market Revenue (Million), by Drug Type 2024 & 2032
- Figure 60: Asia Pacific Neurological Disorder Drugs Market Volume (K Unit), by Drug Type 2024 & 2032
- Figure 61: Asia Pacific Neurological Disorder Drugs Market Revenue Share (%), by Drug Type 2024 & 2032
- Figure 62: Asia Pacific Neurological Disorder Drugs Market Volume Share (%), by Drug Type 2024 & 2032
- Figure 63: Asia Pacific Neurological Disorder Drugs Market Revenue (Million), by Distribution Channels 2024 & 2032
- Figure 64: Asia Pacific Neurological Disorder Drugs Market Volume (K Unit), by Distribution Channels 2024 & 2032
- Figure 65: Asia Pacific Neurological Disorder Drugs Market Revenue Share (%), by Distribution Channels 2024 & 2032
- Figure 66: Asia Pacific Neurological Disorder Drugs Market Volume Share (%), by Distribution Channels 2024 & 2032
- Figure 67: Asia Pacific Neurological Disorder Drugs Market Revenue (Million), by Country 2024 & 2032
- Figure 68: Asia Pacific Neurological Disorder Drugs Market Volume (K Unit), by Country 2024 & 2032
- Figure 69: Asia Pacific Neurological Disorder Drugs Market Revenue Share (%), by Country 2024 & 2032
- Figure 70: Asia Pacific Neurological Disorder Drugs Market Volume Share (%), by Country 2024 & 2032
- Figure 71: Middle East and Africa Neurological Disorder Drugs Market Revenue (Million), by Disorders 2024 & 2032
- Figure 72: Middle East and Africa Neurological Disorder Drugs Market Volume (K Unit), by Disorders 2024 & 2032
- Figure 73: Middle East and Africa Neurological Disorder Drugs Market Revenue Share (%), by Disorders 2024 & 2032
- Figure 74: Middle East and Africa Neurological Disorder Drugs Market Volume Share (%), by Disorders 2024 & 2032
- Figure 75: Middle East and Africa Neurological Disorder Drugs Market Revenue (Million), by Drug Type 2024 & 2032
- Figure 76: Middle East and Africa Neurological Disorder Drugs Market Volume (K Unit), by Drug Type 2024 & 2032
- Figure 77: Middle East and Africa Neurological Disorder Drugs Market Revenue Share (%), by Drug Type 2024 & 2032
- Figure 78: Middle East and Africa Neurological Disorder Drugs Market Volume Share (%), by Drug Type 2024 & 2032
- Figure 79: Middle East and Africa Neurological Disorder Drugs Market Revenue (Million), by Distribution Channels 2024 & 2032
- Figure 80: Middle East and Africa Neurological Disorder Drugs Market Volume (K Unit), by Distribution Channels 2024 & 2032
- Figure 81: Middle East and Africa Neurological Disorder Drugs Market Revenue Share (%), by Distribution Channels 2024 & 2032
- Figure 82: Middle East and Africa Neurological Disorder Drugs Market Volume Share (%), by Distribution Channels 2024 & 2032
- Figure 83: Middle East and Africa Neurological Disorder Drugs Market Revenue (Million), by Country 2024 & 2032
- Figure 84: Middle East and Africa Neurological Disorder Drugs Market Volume (K Unit), by Country 2024 & 2032
- Figure 85: Middle East and Africa Neurological Disorder Drugs Market Revenue Share (%), by Country 2024 & 2032
- Figure 86: Middle East and Africa Neurological Disorder Drugs Market Volume Share (%), by Country 2024 & 2032
- Figure 87: South America Neurological Disorder Drugs Market Revenue (Million), by Disorders 2024 & 2032
- Figure 88: South America Neurological Disorder Drugs Market Volume (K Unit), by Disorders 2024 & 2032
- Figure 89: South America Neurological Disorder Drugs Market Revenue Share (%), by Disorders 2024 & 2032
- Figure 90: South America Neurological Disorder Drugs Market Volume Share (%), by Disorders 2024 & 2032
- Figure 91: South America Neurological Disorder Drugs Market Revenue (Million), by Drug Type 2024 & 2032
- Figure 92: South America Neurological Disorder Drugs Market Volume (K Unit), by Drug Type 2024 & 2032
- Figure 93: South America Neurological Disorder Drugs Market Revenue Share (%), by Drug Type 2024 & 2032
- Figure 94: South America Neurological Disorder Drugs Market Volume Share (%), by Drug Type 2024 & 2032
- Figure 95: South America Neurological Disorder Drugs Market Revenue (Million), by Distribution Channels 2024 & 2032
- Figure 96: South America Neurological Disorder Drugs Market Volume (K Unit), by Distribution Channels 2024 & 2032
- Figure 97: South America Neurological Disorder Drugs Market Revenue Share (%), by Distribution Channels 2024 & 2032
- Figure 98: South America Neurological Disorder Drugs Market Volume Share (%), by Distribution Channels 2024 & 2032
- Figure 99: South America Neurological Disorder Drugs Market Revenue (Million), by Country 2024 & 2032
- Figure 100: South America Neurological Disorder Drugs Market Volume (K Unit), by Country 2024 & 2032
- Figure 101: South America Neurological Disorder Drugs Market Revenue Share (%), by Country 2024 & 2032
- Figure 102: South America Neurological Disorder Drugs Market Volume Share (%), by Country 2024 & 2032
List of Tables
- Table 1: Global Neurological Disorder Drugs Market Revenue Million Forecast, by Region 2019 & 2032
- Table 2: Global Neurological Disorder Drugs Market Volume K Unit Forecast, by Region 2019 & 2032
- Table 3: Global Neurological Disorder Drugs Market Revenue Million Forecast, by Disorders 2019 & 2032
- Table 4: Global Neurological Disorder Drugs Market Volume K Unit Forecast, by Disorders 2019 & 2032
- Table 5: Global Neurological Disorder Drugs Market Revenue Million Forecast, by Drug Type 2019 & 2032
- Table 6: Global Neurological Disorder Drugs Market Volume K Unit Forecast, by Drug Type 2019 & 2032
- Table 7: Global Neurological Disorder Drugs Market Revenue Million Forecast, by Distribution Channels 2019 & 2032
- Table 8: Global Neurological Disorder Drugs Market Volume K Unit Forecast, by Distribution Channels 2019 & 2032
- Table 9: Global Neurological Disorder Drugs Market Revenue Million Forecast, by Region 2019 & 2032
- Table 10: Global Neurological Disorder Drugs Market Volume K Unit Forecast, by Region 2019 & 2032
- Table 11: Global Neurological Disorder Drugs Market Revenue Million Forecast, by Country 2019 & 2032
- Table 12: Global Neurological Disorder Drugs Market Volume K Unit Forecast, by Country 2019 & 2032
- Table 13: United States Neurological Disorder Drugs Market Revenue (Million) Forecast, by Application 2019 & 2032
- Table 14: United States Neurological Disorder Drugs Market Volume (K Unit) Forecast, by Application 2019 & 2032
- Table 15: Canada Neurological Disorder Drugs Market Revenue (Million) Forecast, by Application 2019 & 2032
- Table 16: Canada Neurological Disorder Drugs Market Volume (K Unit) Forecast, by Application 2019 & 2032
- Table 17: Mexico Neurological Disorder Drugs Market Revenue (Million) Forecast, by Application 2019 & 2032
- Table 18: Mexico Neurological Disorder Drugs Market Volume (K Unit) Forecast, by Application 2019 & 2032
- Table 19: Global Neurological Disorder Drugs Market Revenue Million Forecast, by Country 2019 & 2032
- Table 20: Global Neurological Disorder Drugs Market Volume K Unit Forecast, by Country 2019 & 2032
- Table 21: Germany Neurological Disorder Drugs Market Revenue (Million) Forecast, by Application 2019 & 2032
- Table 22: Germany Neurological Disorder Drugs Market Volume (K Unit) Forecast, by Application 2019 & 2032
- Table 23: United Kingdom Neurological Disorder Drugs Market Revenue (Million) Forecast, by Application 2019 & 2032
- Table 24: United Kingdom Neurological Disorder Drugs Market Volume (K Unit) Forecast, by Application 2019 & 2032
- Table 25: France Neurological Disorder Drugs Market Revenue (Million) Forecast, by Application 2019 & 2032
- Table 26: France Neurological Disorder Drugs Market Volume (K Unit) Forecast, by Application 2019 & 2032
- Table 27: Italy Neurological Disorder Drugs Market Revenue (Million) Forecast, by Application 2019 & 2032
- Table 28: Italy Neurological Disorder Drugs Market Volume (K Unit) Forecast, by Application 2019 & 2032
- Table 29: Spain Neurological Disorder Drugs Market Revenue (Million) Forecast, by Application 2019 & 2032
- Table 30: Spain Neurological Disorder Drugs Market Volume (K Unit) Forecast, by Application 2019 & 2032
- Table 31: Rest of Europe Neurological Disorder Drugs Market Revenue (Million) Forecast, by Application 2019 & 2032
- Table 32: Rest of Europe Neurological Disorder Drugs Market Volume (K Unit) Forecast, by Application 2019 & 2032
- Table 33: Global Neurological Disorder Drugs Market Revenue Million Forecast, by Country 2019 & 2032
- Table 34: Global Neurological Disorder Drugs Market Volume K Unit Forecast, by Country 2019 & 2032
- Table 35: China Neurological Disorder Drugs Market Revenue (Million) Forecast, by Application 2019 & 2032
- Table 36: China Neurological Disorder Drugs Market Volume (K Unit) Forecast, by Application 2019 & 2032
- Table 37: Japan Neurological Disorder Drugs Market Revenue (Million) Forecast, by Application 2019 & 2032
- Table 38: Japan Neurological Disorder Drugs Market Volume (K Unit) Forecast, by Application 2019 & 2032
- Table 39: India Neurological Disorder Drugs Market Revenue (Million) Forecast, by Application 2019 & 2032
- Table 40: India Neurological Disorder Drugs Market Volume (K Unit) Forecast, by Application 2019 & 2032
- Table 41: Australia Neurological Disorder Drugs Market Revenue (Million) Forecast, by Application 2019 & 2032
- Table 42: Australia Neurological Disorder Drugs Market Volume (K Unit) Forecast, by Application 2019 & 2032
- Table 43: South Korea Neurological Disorder Drugs Market Revenue (Million) Forecast, by Application 2019 & 2032
- Table 44: South Korea Neurological Disorder Drugs Market Volume (K Unit) Forecast, by Application 2019 & 2032
- Table 45: Rest of Asia Pacific Neurological Disorder Drugs Market Revenue (Million) Forecast, by Application 2019 & 2032
- Table 46: Rest of Asia Pacific Neurological Disorder Drugs Market Volume (K Unit) Forecast, by Application 2019 & 2032
- Table 47: Global Neurological Disorder Drugs Market Revenue Million Forecast, by Country 2019 & 2032
- Table 48: Global Neurological Disorder Drugs Market Volume K Unit Forecast, by Country 2019 & 2032
- Table 49: GCC Neurological Disorder Drugs Market Revenue (Million) Forecast, by Application 2019 & 2032
- Table 50: GCC Neurological Disorder Drugs Market Volume (K Unit) Forecast, by Application 2019 & 2032
- Table 51: South Africa Neurological Disorder Drugs Market Revenue (Million) Forecast, by Application 2019 & 2032
- Table 52: South Africa Neurological Disorder Drugs Market Volume (K Unit) Forecast, by Application 2019 & 2032
- Table 53: Rest of Middle East and Africa Neurological Disorder Drugs Market Revenue (Million) Forecast, by Application 2019 & 2032
- Table 54: Rest of Middle East and Africa Neurological Disorder Drugs Market Volume (K Unit) Forecast, by Application 2019 & 2032
- Table 55: Global Neurological Disorder Drugs Market Revenue Million Forecast, by Country 2019 & 2032
- Table 56: Global Neurological Disorder Drugs Market Volume K Unit Forecast, by Country 2019 & 2032
- Table 57: Brazil Neurological Disorder Drugs Market Revenue (Million) Forecast, by Application 2019 & 2032
- Table 58: Brazil Neurological Disorder Drugs Market Volume (K Unit) Forecast, by Application 2019 & 2032
- Table 59: Argentina Neurological Disorder Drugs Market Revenue (Million) Forecast, by Application 2019 & 2032
- Table 60: Argentina Neurological Disorder Drugs Market Volume (K Unit) Forecast, by Application 2019 & 2032
- Table 61: Rest of South America Neurological Disorder Drugs Market Revenue (Million) Forecast, by Application 2019 & 2032
- Table 62: Rest of South America Neurological Disorder Drugs Market Volume (K Unit) Forecast, by Application 2019 & 2032
- Table 63: Global Neurological Disorder Drugs Market Revenue Million Forecast, by Disorders 2019 & 2032
- Table 64: Global Neurological Disorder Drugs Market Volume K Unit Forecast, by Disorders 2019 & 2032
- Table 65: Global Neurological Disorder Drugs Market Revenue Million Forecast, by Drug Type 2019 & 2032
- Table 66: Global Neurological Disorder Drugs Market Volume K Unit Forecast, by Drug Type 2019 & 2032
- Table 67: Global Neurological Disorder Drugs Market Revenue Million Forecast, by Distribution Channels 2019 & 2032
- Table 68: Global Neurological Disorder Drugs Market Volume K Unit Forecast, by Distribution Channels 2019 & 2032
- Table 69: Global Neurological Disorder Drugs Market Revenue Million Forecast, by Country 2019 & 2032
- Table 70: Global Neurological Disorder Drugs Market Volume K Unit Forecast, by Country 2019 & 2032
- Table 71: United States Neurological Disorder Drugs Market Revenue (Million) Forecast, by Application 2019 & 2032
- Table 72: United States Neurological Disorder Drugs Market Volume (K Unit) Forecast, by Application 2019 & 2032
- Table 73: Canada Neurological Disorder Drugs Market Revenue (Million) Forecast, by Application 2019 & 2032
- Table 74: Canada Neurological Disorder Drugs Market Volume (K Unit) Forecast, by Application 2019 & 2032
- Table 75: Mexico Neurological Disorder Drugs Market Revenue (Million) Forecast, by Application 2019 & 2032
- Table 76: Mexico Neurological Disorder Drugs Market Volume (K Unit) Forecast, by Application 2019 & 2032
- Table 77: Global Neurological Disorder Drugs Market Revenue Million Forecast, by Disorders 2019 & 2032
- Table 78: Global Neurological Disorder Drugs Market Volume K Unit Forecast, by Disorders 2019 & 2032
- Table 79: Global Neurological Disorder Drugs Market Revenue Million Forecast, by Drug Type 2019 & 2032
- Table 80: Global Neurological Disorder Drugs Market Volume K Unit Forecast, by Drug Type 2019 & 2032
- Table 81: Global Neurological Disorder Drugs Market Revenue Million Forecast, by Distribution Channels 2019 & 2032
- Table 82: Global Neurological Disorder Drugs Market Volume K Unit Forecast, by Distribution Channels 2019 & 2032
- Table 83: Global Neurological Disorder Drugs Market Revenue Million Forecast, by Country 2019 & 2032
- Table 84: Global Neurological Disorder Drugs Market Volume K Unit Forecast, by Country 2019 & 2032
- Table 85: Germany Neurological Disorder Drugs Market Revenue (Million) Forecast, by Application 2019 & 2032
- Table 86: Germany Neurological Disorder Drugs Market Volume (K Unit) Forecast, by Application 2019 & 2032
- Table 87: United Kingdom Neurological Disorder Drugs Market Revenue (Million) Forecast, by Application 2019 & 2032
- Table 88: United Kingdom Neurological Disorder Drugs Market Volume (K Unit) Forecast, by Application 2019 & 2032
- Table 89: France Neurological Disorder Drugs Market Revenue (Million) Forecast, by Application 2019 & 2032
- Table 90: France Neurological Disorder Drugs Market Volume (K Unit) Forecast, by Application 2019 & 2032
- Table 91: Italy Neurological Disorder Drugs Market Revenue (Million) Forecast, by Application 2019 & 2032
- Table 92: Italy Neurological Disorder Drugs Market Volume (K Unit) Forecast, by Application 2019 & 2032
- Table 93: Spain Neurological Disorder Drugs Market Revenue (Million) Forecast, by Application 2019 & 2032
- Table 94: Spain Neurological Disorder Drugs Market Volume (K Unit) Forecast, by Application 2019 & 2032
- Table 95: Rest of Europe Neurological Disorder Drugs Market Revenue (Million) Forecast, by Application 2019 & 2032
- Table 96: Rest of Europe Neurological Disorder Drugs Market Volume (K Unit) Forecast, by Application 2019 & 2032
- Table 97: Global Neurological Disorder Drugs Market Revenue Million Forecast, by Disorders 2019 & 2032
- Table 98: Global Neurological Disorder Drugs Market Volume K Unit Forecast, by Disorders 2019 & 2032
- Table 99: Global Neurological Disorder Drugs Market Revenue Million Forecast, by Drug Type 2019 & 2032
- Table 100: Global Neurological Disorder Drugs Market Volume K Unit Forecast, by Drug Type 2019 & 2032
- Table 101: Global Neurological Disorder Drugs Market Revenue Million Forecast, by Distribution Channels 2019 & 2032
- Table 102: Global Neurological Disorder Drugs Market Volume K Unit Forecast, by Distribution Channels 2019 & 2032
- Table 103: Global Neurological Disorder Drugs Market Revenue Million Forecast, by Country 2019 & 2032
- Table 104: Global Neurological Disorder Drugs Market Volume K Unit Forecast, by Country 2019 & 2032
- Table 105: China Neurological Disorder Drugs Market Revenue (Million) Forecast, by Application 2019 & 2032
- Table 106: China Neurological Disorder Drugs Market Volume (K Unit) Forecast, by Application 2019 & 2032
- Table 107: Japan Neurological Disorder Drugs Market Revenue (Million) Forecast, by Application 2019 & 2032
- Table 108: Japan Neurological Disorder Drugs Market Volume (K Unit) Forecast, by Application 2019 & 2032
- Table 109: India Neurological Disorder Drugs Market Revenue (Million) Forecast, by Application 2019 & 2032
- Table 110: India Neurological Disorder Drugs Market Volume (K Unit) Forecast, by Application 2019 & 2032
- Table 111: Australia Neurological Disorder Drugs Market Revenue (Million) Forecast, by Application 2019 & 2032
- Table 112: Australia Neurological Disorder Drugs Market Volume (K Unit) Forecast, by Application 2019 & 2032
- Table 113: South Korea Neurological Disorder Drugs Market Revenue (Million) Forecast, by Application 2019 & 2032
- Table 114: South Korea Neurological Disorder Drugs Market Volume (K Unit) Forecast, by Application 2019 & 2032
- Table 115: Rest of Asia Pacific Neurological Disorder Drugs Market Revenue (Million) Forecast, by Application 2019 & 2032
- Table 116: Rest of Asia Pacific Neurological Disorder Drugs Market Volume (K Unit) Forecast, by Application 2019 & 2032
- Table 117: Global Neurological Disorder Drugs Market Revenue Million Forecast, by Disorders 2019 & 2032
- Table 118: Global Neurological Disorder Drugs Market Volume K Unit Forecast, by Disorders 2019 & 2032
- Table 119: Global Neurological Disorder Drugs Market Revenue Million Forecast, by Drug Type 2019 & 2032
- Table 120: Global Neurological Disorder Drugs Market Volume K Unit Forecast, by Drug Type 2019 & 2032
- Table 121: Global Neurological Disorder Drugs Market Revenue Million Forecast, by Distribution Channels 2019 & 2032
- Table 122: Global Neurological Disorder Drugs Market Volume K Unit Forecast, by Distribution Channels 2019 & 2032
- Table 123: Global Neurological Disorder Drugs Market Revenue Million Forecast, by Country 2019 & 2032
- Table 124: Global Neurological Disorder Drugs Market Volume K Unit Forecast, by Country 2019 & 2032
- Table 125: GCC Neurological Disorder Drugs Market Revenue (Million) Forecast, by Application 2019 & 2032
- Table 126: GCC Neurological Disorder Drugs Market Volume (K Unit) Forecast, by Application 2019 & 2032
- Table 127: South Africa Neurological Disorder Drugs Market Revenue (Million) Forecast, by Application 2019 & 2032
- Table 128: South Africa Neurological Disorder Drugs Market Volume (K Unit) Forecast, by Application 2019 & 2032
- Table 129: Rest of Middle East and Africa Neurological Disorder Drugs Market Revenue (Million) Forecast, by Application 2019 & 2032
- Table 130: Rest of Middle East and Africa Neurological Disorder Drugs Market Volume (K Unit) Forecast, by Application 2019 & 2032
- Table 131: Global Neurological Disorder Drugs Market Revenue Million Forecast, by Disorders 2019 & 2032
- Table 132: Global Neurological Disorder Drugs Market Volume K Unit Forecast, by Disorders 2019 & 2032
- Table 133: Global Neurological Disorder Drugs Market Revenue Million Forecast, by Drug Type 2019 & 2032
- Table 134: Global Neurological Disorder Drugs Market Volume K Unit Forecast, by Drug Type 2019 & 2032
- Table 135: Global Neurological Disorder Drugs Market Revenue Million Forecast, by Distribution Channels 2019 & 2032
- Table 136: Global Neurological Disorder Drugs Market Volume K Unit Forecast, by Distribution Channels 2019 & 2032
- Table 137: Global Neurological Disorder Drugs Market Revenue Million Forecast, by Country 2019 & 2032
- Table 138: Global Neurological Disorder Drugs Market Volume K Unit Forecast, by Country 2019 & 2032
- Table 139: Brazil Neurological Disorder Drugs Market Revenue (Million) Forecast, by Application 2019 & 2032
- Table 140: Brazil Neurological Disorder Drugs Market Volume (K Unit) Forecast, by Application 2019 & 2032
- Table 141: Argentina Neurological Disorder Drugs Market Revenue (Million) Forecast, by Application 2019 & 2032
- Table 142: Argentina Neurological Disorder Drugs Market Volume (K Unit) Forecast, by Application 2019 & 2032
- Table 143: Rest of South America Neurological Disorder Drugs Market Revenue (Million) Forecast, by Application 2019 & 2032
- Table 144: Rest of South America Neurological Disorder Drugs Market Volume (K Unit) Forecast, by Application 2019 & 2032
Frequently Asked Questions
1. What is the projected Compound Annual Growth Rate (CAGR) of the Neurological Disorder Drugs Market?
The projected CAGR is approximately 5.60%.
2. Which companies are prominent players in the Neurological Disorder Drugs Market?
Key companies in the market include Teva Pharmaceutical Industries Ltd , Merck & Co Inc, Bayer AG, Sanofi, Novartis AG, F Hoffmann-La Roche Ltd, AstraZeneca, Abbott, Johnson & Johnson Private Limited, Pfizer Inc.
3. What are the main segments of the Neurological Disorder Drugs Market?
The market segments include Disorders, Drug Type, Distribution Channels.
4. Can you provide details about the market size?
The market size is estimated to be USD XX Million as of 2022.
5. What are some drivers contributing to market growth?
High Prevalence of Neurological Diseases; Rising Awareness for Early Disease Diagnosis; Increasing Number of Research and Development for Neurological Diseases.
6. What are the notable trends driving market growth?
The Alzheimer's Disease Segment is Expected to Hold a Significant Share in the Neurological Disorders Drugs Market Over the Forecast Period.
7. Are there any restraints impacting market growth?
High Cost for Diagnosis and Treatment; Stringent Regulations Associated with the Neurological Drugs.
8. Can you provide examples of recent developments in the market?
In March 2023, the development of an oral, brain-penetrant, dual inhibitor of TYK2 and JAK1 for treating neurological illnesses was announced by Biohaven Ltd., except for the China region.
9. What pricing options are available for accessing the report?
Pricing options include single-user, multi-user, and enterprise licenses priced at USD 4750, USD 5250, and USD 8750 respectively.
10. Is the market size provided in terms of value or volume?
The market size is provided in terms of value, measured in Million and volume, measured in K Unit.
11. Are there any specific market keywords associated with the report?
Yes, the market keyword associated with the report is "Neurological Disorder Drugs Market," which aids in identifying and referencing the specific market segment covered.
12. How do I determine which pricing option suits my needs best?
The pricing options vary based on user requirements and access needs. Individual users may opt for single-user licenses, while businesses requiring broader access may choose multi-user or enterprise licenses for cost-effective access to the report.
13. Are there any additional resources or data provided in the Neurological Disorder Drugs Market report?
While the report offers comprehensive insights, it's advisable to review the specific contents or supplementary materials provided to ascertain if additional resources or data are available.
14. How can I stay updated on further developments or reports in the Neurological Disorder Drugs Market?
To stay informed about further developments, trends, and reports in the Neurological Disorder Drugs Market, consider subscribing to industry newsletters, following relevant companies and organizations, or regularly checking reputable industry news sources and publications.
Methodology
Step 1 - Identification of Relevant Samples Size from Population Database


Step 2 - Approaches for Defining Global Market Size (Value, Volume* & Price*)

Note*: In applicable scenarios
Step 3 - Data Sources
Primary Research
- Web Analytics
- Survey Reports
- Research Institute
- Latest Research Reports
- Opinion Leaders
Secondary Research
- Annual Reports
- White Paper
- Latest Press Release
- Industry Association
- Paid Database
- Investor Presentations

Step 4 - Data Triangulation
Involves using different sources of information in order to increase the validity of a study
These sources are likely to be stakeholders in a program - participants, other researchers, program staff, other community members, and so on.
Then we put all data in single framework & apply various statistical tools to find out the dynamic on the market.
During the analysis stage, feedback from the stakeholder groups would be compared to determine areas of agreement as well as areas of divergence


