

Key Insights
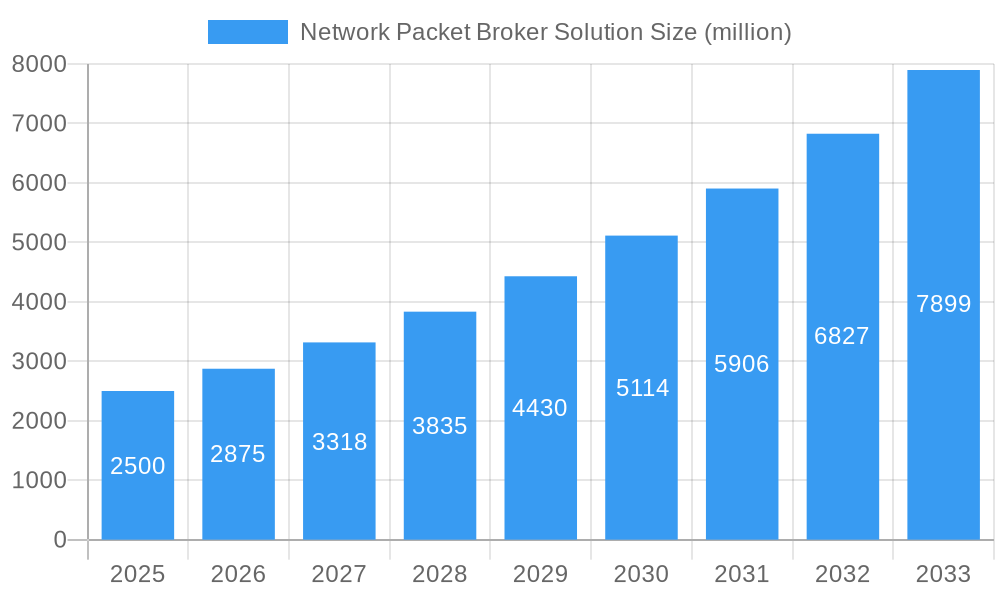
The Network Packet Broker (NPB) solution market is experiencing robust growth, driven by the increasing adoption of cloud computing, the proliferation of IoT devices, and the rising need for advanced network security. The market's expansion is fueled by the necessity for efficient network monitoring and analysis, particularly in complex and high-bandwidth environments. Businesses are increasingly reliant on real-time network visibility to optimize performance, troubleshoot issues, and detect security threats effectively. This demand is further amplified by the growing sophistication of cyberattacks and the need for advanced threat detection and response capabilities. We estimate the market size in 2025 to be approximately $2.5 billion, projecting a Compound Annual Growth Rate (CAGR) of 15% from 2025 to 2033, reaching an estimated $8 billion by 2033. This growth is being driven by factors such as the increasing adoption of 5G and the expanding use of AI and machine learning in network management.
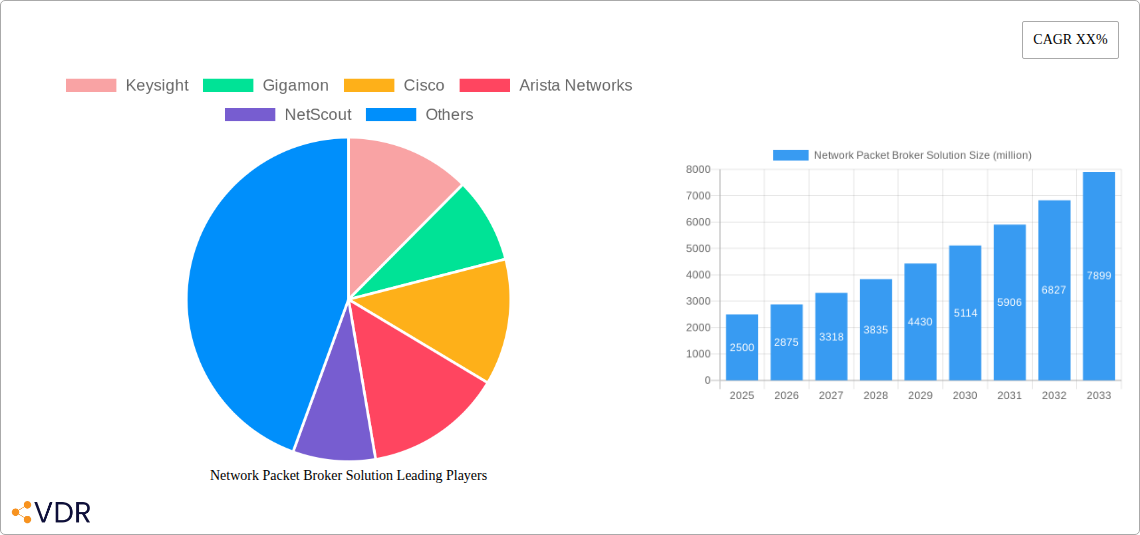
Network Packet Broker Solution Market Size (In Billion)
Key segments within the NPB market include those catering to specific industries such as finance, telecommunications, and government, along with different NPB functionalities like aggregation, filtering, and security. The competitive landscape is characterized by a mix of established players like Keysight, Gigamon, and Cisco, alongside emerging vendors offering innovative solutions. While the market faces restraints such as high initial investment costs and the complexity of deployment, the overall growth trajectory remains positive, driven by the ongoing need for enhanced network visibility and security across various industries. The market is witnessing a trend towards software-defined packet brokers and cloud-based solutions, offering greater scalability and flexibility. Furthermore, the integration of AI and machine learning into NPB solutions is improving the efficiency and effectiveness of network monitoring and threat detection.
Network Packet Broker Solution Company Market Share
Network Packet Broker Solution Market Report: 2019-2033
This comprehensive report provides a detailed analysis of the Network Packet Broker (NPB) solution market, encompassing market dynamics, growth trends, regional dominance, product landscape, key players, and future outlook. The study period covers 2019-2033, with 2025 as the base and estimated year. The forecast period spans 2025-2033, and the historical period encompasses 2019-2024. The report caters to industry professionals, investors, and stakeholders seeking insights into this rapidly evolving market. The global market size is predicted to reach xx million by 2033.
Network Packet Broker Solution Market Dynamics & Structure
The Network Packet Broker solution market is characterized by moderate concentration, with key players like Keysight, Gigamon, Cisco, and Arista Networks holding significant market share. The market is driven by technological advancements such as AI-powered analytics and the increasing adoption of cloud-based solutions. Regulatory frameworks regarding data privacy and security are influencing market growth, while competitive substitutes include traditional network monitoring tools. The end-user demographics span various industries, with increasing adoption in finance, telecom, and healthcare. M&A activity within the sector is moderate, with approximately xx deals recorded between 2019 and 2024, primarily focused on expanding capabilities and market reach.
- Market Concentration: Moderately concentrated, with top 5 players holding approximately 60% market share in 2025.
- Technological Innovation: AI-powered analytics, cloud-based solutions, and increased processing speeds are key drivers.
- Regulatory Framework: GDPR, CCPA, and other data privacy regulations influence product development and deployment.
- Competitive Substitutes: Traditional network monitoring tools, but NPBs offer superior scalability and filtering capabilities.
- End-User Demographics: Finance, telecom, healthcare, and government sectors are major adopters.
- M&A Trends: xx M&A deals between 2019 and 2024, focused on enhancing technology and geographical reach.
Network Packet Broker Solution Growth Trends & Insights
The NPB solution market experienced significant growth during the historical period (2019-2024), fueled by the increasing need for advanced network visibility and security. The market size grew from xx million in 2019 to xx million in 2024, representing a CAGR of xx%. This growth is attributed to rising adoption rates across various industries, particularly driven by the expansion of cloud infrastructure and the growing complexity of network architectures. Technological disruptions, such as the shift towards Software-Defined Networking (SDN) and Network Function Virtualization (NFV), have further accelerated market growth. Consumer behavior shifts toward enhanced security and operational efficiency are also boosting demand. The market is projected to continue its growth trajectory, reaching xx million by 2033, with a projected CAGR of xx% during the forecast period (2025-2033). Market penetration is expected to increase from xx% in 2025 to xx% by 2033.
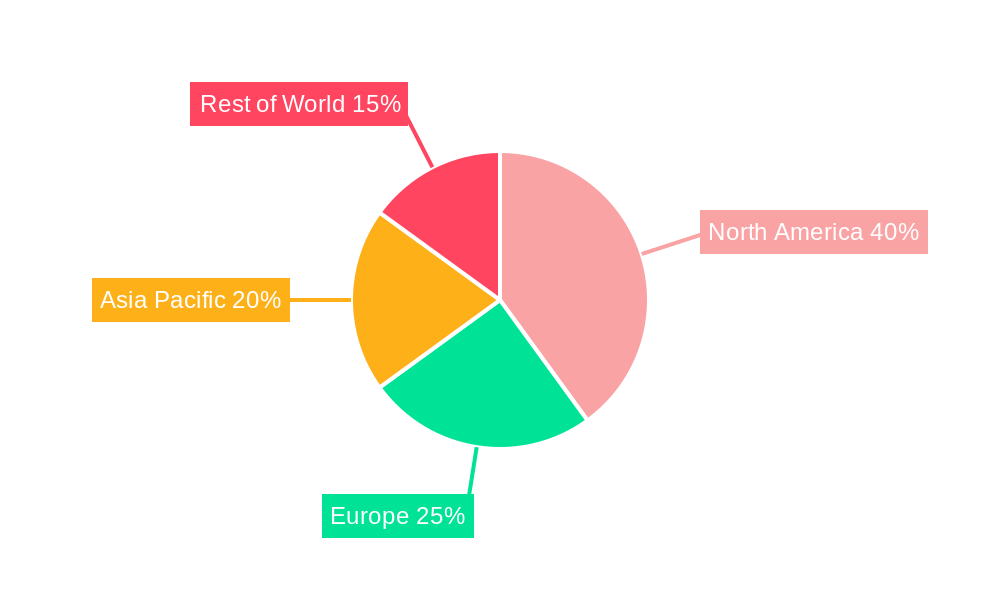
Dominant Regions, Countries, or Segments in Network Packet Broker Solution
North America currently holds the largest market share in the NPB solution market, driven by early adoption of advanced technologies, robust IT infrastructure, and strong regulatory compliance requirements. Europe follows as a significant market, experiencing steady growth due to increasing investments in digital infrastructure and stringent data security regulations. Asia-Pacific is poised for rapid growth, fueled by the rising adoption of cloud computing and the expansion of data centers.
- North America: Strong market presence due to early adoption of advanced technologies and robust IT infrastructure.
- Europe: Steady growth driven by increasing investment in digital infrastructure and stringent data security regulations.
- Asia-Pacific: Rapid growth potential driven by expanding cloud adoption, data center expansion, and increasing network complexity.
- Key Drivers: Government initiatives supporting digital transformation, investments in cybersecurity, and increasing network complexity in various industries.
Network Packet Broker Solution Product Landscape
The NPB solution market offers a range of products, from basic packet brokers to advanced solutions incorporating AI-powered analytics and deep packet inspection capabilities. These solutions are deployed across various applications, including network monitoring, security threat detection, and performance optimization. Key performance metrics include packet loss rate, latency, and throughput. The unique selling propositions are often centered around scalability, flexibility, and advanced filtering capabilities. Recent technological advancements include integration with cloud platforms and the adoption of high-speed interfaces like 400GbE and 800GbE.
Key Drivers, Barriers & Challenges in Network Packet Broker Solution
Key Drivers:
- Increasing network complexity and the need for advanced network visibility.
- Rising cybersecurity threats and the need for effective threat detection.
- Growth of cloud computing and the need for efficient network management.
- Stricter data privacy regulations driving demand for enhanced security.
Key Barriers and Challenges:
- High initial investment costs associated with deploying NPB solutions.
- Complexity of integration with existing network infrastructure.
- Skill gap in managing and maintaining NPB solutions.
- Competitive pressures from established network monitoring vendors. The competitive landscape impacts pricing strategies, leading to potential reduced profit margins for some players by approximately xx%.
Emerging Opportunities in Network Packet Broker Solution
Emerging opportunities lie in the integration of NPB solutions with AI/ML for advanced threat detection and predictive analytics. The untapped market of smaller enterprises and SMBs presents significant growth potential. Moreover, the integration of NPBs with IoT devices and 5G networks opens new avenues for growth.
Growth Accelerators in the Network Packet Broker Solution Industry
Technological advancements, strategic partnerships between NPB vendors and other technology providers, and market expansion into untapped geographical regions are crucial accelerators. Furthermore, the development of cloud-based NPB solutions simplifies deployment and reduces operational costs, further stimulating growth.
Key Players Shaping the Network Packet Broker Solution Market
- Keysight
- Gigamon
- Cisco
- Arista Networks
- NetScout
- Extreme Networks
- APCON
- CPacket Networks
- VIAVI Solutions
- Cubro Network Visibility
- Network Critical
- Datacom Systems
- Profitap
- Garland Technology
- CGS Tower Networks
- Niagara Networks
- Microtel Innovation
- Larch-Networks
Notable Milestones in Network Packet Broker Solution Sector
- 2020: Keysight launched its advanced NPB solution with AI-powered analytics.
- 2021: Gigamon acquired a smaller NPB vendor, expanding its market share.
- 2022: Cisco integrated its NPB solution with its cloud platform.
- 2023: Several vendors announced the availability of NPB solutions supporting 800GbE.
In-Depth Network Packet Broker Solution Market Outlook
The NPB solution market is poised for continued growth, driven by technological innovations, increasing network complexity, and rising cybersecurity concerns. Strategic partnerships, expansion into new markets, and the development of cloud-native solutions will further propel market expansion. The focus on AI-driven analytics and integration with emerging technologies will shape the future of the market, creating significant opportunities for vendors and fostering the growth of a more intelligent and secure network landscape.
Network Packet Broker Solution Segmentation
-
1. Application
- 1.1. Security Delivery
- 1.2. Performance Monitoring
-
2. Types
- 2.1. Inline Network Packet Broker
- 2.2. Non-inline Network Packet Broker
Network Packet Broker Solution Segmentation By Geography
-
1. North America
- 1.1. United States
- 1.2. Canada
- 1.3. Mexico
-
2. South America
- 2.1. Brazil
- 2.2. Argentina
- 2.3. Rest of South America
-
3. Europe
- 3.1. United Kingdom
- 3.2. Germany
- 3.3. France
- 3.4. Italy
- 3.5. Spain
- 3.6. Russia
- 3.7. Benelux
- 3.8. Nordics
- 3.9. Rest of Europe
-
4. Middle East & Africa
- 4.1. Turkey
- 4.2. Israel
- 4.3. GCC
- 4.4. North Africa
- 4.5. South Africa
- 4.6. Rest of Middle East & Africa
-
5. Asia Pacific
- 5.1. China
- 5.2. India
- 5.3. Japan
- 5.4. South Korea
- 5.5. ASEAN
- 5.6. Oceania
- 5.7. Rest of Asia Pacific
Network Packet Broker Solution Regional Market Share
Geographic Coverage of Network Packet Broker Solution
Network Packet Broker Solution REPORT HIGHLIGHTS
| Aspects | Details |
|---|---|
| Study Period | 2020-2034 |
| Base Year | 2025 |
| Estimated Year | 2026 |
| Forecast Period | 2026-2034 |
| Historical Period | 2020-2025 |
| Growth Rate | CAGR of 7.8% from 2020-2034 |
| Segmentation |
|
Table of Contents
- 1. Introduction
- 1.1. Research Scope
- 1.2. Market Segmentation
- 1.3. Research Objective
- 1.4. Definitions and Assumptions
- 2. Executive Summary
- 2.1. Market Snapshot
- 3. Market Dynamics
- 3.1. Market Drivers
- 3.2. Market Restrains
- 3.3. Market Trends
- 3.4. Market Opportunities
- 4. Market Factor Analysis
- 4.1. Porters Five Forces
- 4.1.1. Bargaining Power of Suppliers
- 4.1.2. Bargaining Power of Buyers
- 4.1.3. Threat of New Entrants
- 4.1.4. Threat of Substitutes
- 4.1.5. Competitive Rivalry
- 4.2. PESTEL analysis
- 4.3. BCG Analysis
- 4.3.1. Stars (High Growth, High Market Share)
- 4.3.2. Cash Cows (Low Growth, High Market Share)
- 4.3.3. Question Mark (High Growth, Low Market Share)
- 4.3.4. Dogs (Low Growth, Low Market Share)
- 4.4. Ansoff Matrix Analysis
- 4.5. Supply Chain Analysis
- 4.6. Regulatory Landscape
- 4.7. Current Market Potential and Opportunity Assessment (TAM–SAM–SOM Framework)
- 4.8. VDR Analyst Note
- 4.1. Porters Five Forces
- 5. Market Analysis, Insights and Forecast 2021-2033
- 5.1. Market Analysis, Insights and Forecast - by Application
- 5.1.1. Security Delivery
- 5.1.2. Performance Monitoring
- 5.2. Market Analysis, Insights and Forecast - by Types
- 5.2.1. Inline Network Packet Broker
- 5.2.2. Non-inline Network Packet Broker
- 5.3. Market Analysis, Insights and Forecast - by Region
- 5.3.1. North America
- 5.3.2. South America
- 5.3.3. Europe
- 5.3.4. Middle East & Africa
- 5.3.5. Asia Pacific
- 5.1. Market Analysis, Insights and Forecast - by Application
- 6. Global Network Packet Broker Solution Analysis, Insights and Forecast, 2021-2033
- 6.1. Market Analysis, Insights and Forecast - by Application
- 6.1.1. Security Delivery
- 6.1.2. Performance Monitoring
- 6.2. Market Analysis, Insights and Forecast - by Types
- 6.2.1. Inline Network Packet Broker
- 6.2.2. Non-inline Network Packet Broker
- 6.1. Market Analysis, Insights and Forecast - by Application
- 7. North America Network Packet Broker Solution Analysis, Insights and Forecast, 2021-2033
- 7.1. Market Analysis, Insights and Forecast - by Application
- 7.1.1. Security Delivery
- 7.1.2. Performance Monitoring
- 7.2. Market Analysis, Insights and Forecast - by Types
- 7.2.1. Inline Network Packet Broker
- 7.2.2. Non-inline Network Packet Broker
- 7.1. Market Analysis, Insights and Forecast - by Application
- 8. South America Network Packet Broker Solution Analysis, Insights and Forecast, 2021-2033
- 8.1. Market Analysis, Insights and Forecast - by Application
- 8.1.1. Security Delivery
- 8.1.2. Performance Monitoring
- 8.2. Market Analysis, Insights and Forecast - by Types
- 8.2.1. Inline Network Packet Broker
- 8.2.2. Non-inline Network Packet Broker
- 8.1. Market Analysis, Insights and Forecast - by Application
- 9. Europe Network Packet Broker Solution Analysis, Insights and Forecast, 2021-2033
- 9.1. Market Analysis, Insights and Forecast - by Application
- 9.1.1. Security Delivery
- 9.1.2. Performance Monitoring
- 9.2. Market Analysis, Insights and Forecast - by Types
- 9.2.1. Inline Network Packet Broker
- 9.2.2. Non-inline Network Packet Broker
- 9.1. Market Analysis, Insights and Forecast - by Application
- 10. Middle East & Africa Network Packet Broker Solution Analysis, Insights and Forecast, 2021-2033
- 10.1. Market Analysis, Insights and Forecast - by Application
- 10.1.1. Security Delivery
- 10.1.2. Performance Monitoring
- 10.2. Market Analysis, Insights and Forecast - by Types
- 10.2.1. Inline Network Packet Broker
- 10.2.2. Non-inline Network Packet Broker
- 10.1. Market Analysis, Insights and Forecast - by Application
- 11. Asia Pacific Network Packet Broker Solution Analysis, Insights and Forecast, 2021-2033
- 11.1. Market Analysis, Insights and Forecast - by Application
- 11.1.1. Security Delivery
- 11.1.2. Performance Monitoring
- 11.2. Market Analysis, Insights and Forecast - by Types
- 11.2.1. Inline Network Packet Broker
- 11.2.2. Non-inline Network Packet Broker
- 11.1. Market Analysis, Insights and Forecast - by Application
- 12. Competitive Analysis
- 12.1. Company Profiles
- 12.1.1 Keysight
- 12.1.1.1. Company Overview
- 12.1.1.2. Products
- 12.1.1.3. Company Financials
- 12.1.1.4. SWOT Analysis
- 12.1.2 Gigamon
- 12.1.2.1. Company Overview
- 12.1.2.2. Products
- 12.1.2.3. Company Financials
- 12.1.2.4. SWOT Analysis
- 12.1.3 Cisco
- 12.1.3.1. Company Overview
- 12.1.3.2. Products
- 12.1.3.3. Company Financials
- 12.1.3.4. SWOT Analysis
- 12.1.4 Arista Networks
- 12.1.4.1. Company Overview
- 12.1.4.2. Products
- 12.1.4.3. Company Financials
- 12.1.4.4. SWOT Analysis
- 12.1.5 NetScout
- 12.1.5.1. Company Overview
- 12.1.5.2. Products
- 12.1.5.3. Company Financials
- 12.1.5.4. SWOT Analysis
- 12.1.6 Extreme Networks
- 12.1.6.1. Company Overview
- 12.1.6.2. Products
- 12.1.6.3. Company Financials
- 12.1.6.4. SWOT Analysis
- 12.1.7 APCON
- 12.1.7.1. Company Overview
- 12.1.7.2. Products
- 12.1.7.3. Company Financials
- 12.1.7.4. SWOT Analysis
- 12.1.8 CPacket Networks
- 12.1.8.1. Company Overview
- 12.1.8.2. Products
- 12.1.8.3. Company Financials
- 12.1.8.4. SWOT Analysis
- 12.1.9 VIAVI Solutions
- 12.1.9.1. Company Overview
- 12.1.9.2. Products
- 12.1.9.3. Company Financials
- 12.1.9.4. SWOT Analysis
- 12.1.10 Cubro Network Visibility
- 12.1.10.1. Company Overview
- 12.1.10.2. Products
- 12.1.10.3. Company Financials
- 12.1.10.4. SWOT Analysis
- 12.1.11 Network Critical
- 12.1.11.1. Company Overview
- 12.1.11.2. Products
- 12.1.11.3. Company Financials
- 12.1.11.4. SWOT Analysis
- 12.1.12 Datacom Systems
- 12.1.12.1. Company Overview
- 12.1.12.2. Products
- 12.1.12.3. Company Financials
- 12.1.12.4. SWOT Analysis
- 12.1.13 Profitap
- 12.1.13.1. Company Overview
- 12.1.13.2. Products
- 12.1.13.3. Company Financials
- 12.1.13.4. SWOT Analysis
- 12.1.14 Garland Technology
- 12.1.14.1. Company Overview
- 12.1.14.2. Products
- 12.1.14.3. Company Financials
- 12.1.14.4. SWOT Analysis
- 12.1.15 CGS Tower Networks
- 12.1.15.1. Company Overview
- 12.1.15.2. Products
- 12.1.15.3. Company Financials
- 12.1.15.4. SWOT Analysis
- 12.1.16 Niagara Networks
- 12.1.16.1. Company Overview
- 12.1.16.2. Products
- 12.1.16.3. Company Financials
- 12.1.16.4. SWOT Analysis
- 12.1.17 Microtel Innovation
- 12.1.17.1. Company Overview
- 12.1.17.2. Products
- 12.1.17.3. Company Financials
- 12.1.17.4. SWOT Analysis
- 12.1.18 Larch-Networks
- 12.1.18.1. Company Overview
- 12.1.18.2. Products
- 12.1.18.3. Company Financials
- 12.1.18.4. SWOT Analysis
- 12.1.1 Keysight
- 12.2. Market Entropy
- 12.2.1 Company's Key Areas Served
- 12.2.2 Recent Developments
- 12.3. Company Market Share Analysis 2025
- 12.3.1 Top 5 Companies Market Share Analysis
- 12.3.2 Top 3 Companies Market Share Analysis
- 12.4. List of Potential Customers
- 13. Research Methodology
List of Figures
- Figure 1: Global Network Packet Broker Solution Revenue Breakdown (undefined, %) by Region 2025 & 2033
- Figure 2: North America Network Packet Broker Solution Revenue (undefined), by Application 2025 & 2033
- Figure 3: North America Network Packet Broker Solution Revenue Share (%), by Application 2025 & 2033
- Figure 4: North America Network Packet Broker Solution Revenue (undefined), by Types 2025 & 2033
- Figure 5: North America Network Packet Broker Solution Revenue Share (%), by Types 2025 & 2033
- Figure 6: North America Network Packet Broker Solution Revenue (undefined), by Country 2025 & 2033
- Figure 7: North America Network Packet Broker Solution Revenue Share (%), by Country 2025 & 2033
- Figure 8: South America Network Packet Broker Solution Revenue (undefined), by Application 2025 & 2033
- Figure 9: South America Network Packet Broker Solution Revenue Share (%), by Application 2025 & 2033
- Figure 10: South America Network Packet Broker Solution Revenue (undefined), by Types 2025 & 2033
- Figure 11: South America Network Packet Broker Solution Revenue Share (%), by Types 2025 & 2033
- Figure 12: South America Network Packet Broker Solution Revenue (undefined), by Country 2025 & 2033
- Figure 13: South America Network Packet Broker Solution Revenue Share (%), by Country 2025 & 2033
- Figure 14: Europe Network Packet Broker Solution Revenue (undefined), by Application 2025 & 2033
- Figure 15: Europe Network Packet Broker Solution Revenue Share (%), by Application 2025 & 2033
- Figure 16: Europe Network Packet Broker Solution Revenue (undefined), by Types 2025 & 2033
- Figure 17: Europe Network Packet Broker Solution Revenue Share (%), by Types 2025 & 2033
- Figure 18: Europe Network Packet Broker Solution Revenue (undefined), by Country 2025 & 2033
- Figure 19: Europe Network Packet Broker Solution Revenue Share (%), by Country 2025 & 2033
- Figure 20: Middle East & Africa Network Packet Broker Solution Revenue (undefined), by Application 2025 & 2033
- Figure 21: Middle East & Africa Network Packet Broker Solution Revenue Share (%), by Application 2025 & 2033
- Figure 22: Middle East & Africa Network Packet Broker Solution Revenue (undefined), by Types 2025 & 2033
- Figure 23: Middle East & Africa Network Packet Broker Solution Revenue Share (%), by Types 2025 & 2033
- Figure 24: Middle East & Africa Network Packet Broker Solution Revenue (undefined), by Country 2025 & 2033
- Figure 25: Middle East & Africa Network Packet Broker Solution Revenue Share (%), by Country 2025 & 2033
- Figure 26: Asia Pacific Network Packet Broker Solution Revenue (undefined), by Application 2025 & 2033
- Figure 27: Asia Pacific Network Packet Broker Solution Revenue Share (%), by Application 2025 & 2033
- Figure 28: Asia Pacific Network Packet Broker Solution Revenue (undefined), by Types 2025 & 2033
- Figure 29: Asia Pacific Network Packet Broker Solution Revenue Share (%), by Types 2025 & 2033
- Figure 30: Asia Pacific Network Packet Broker Solution Revenue (undefined), by Country 2025 & 2033
- Figure 31: Asia Pacific Network Packet Broker Solution Revenue Share (%), by Country 2025 & 2033
List of Tables
- Table 1: Global Network Packet Broker Solution Revenue undefined Forecast, by Application 2020 & 2033
- Table 2: Global Network Packet Broker Solution Revenue undefined Forecast, by Types 2020 & 2033
- Table 3: Global Network Packet Broker Solution Revenue undefined Forecast, by Region 2020 & 2033
- Table 4: Global Network Packet Broker Solution Revenue undefined Forecast, by Application 2020 & 2033
- Table 5: Global Network Packet Broker Solution Revenue undefined Forecast, by Types 2020 & 2033
- Table 6: Global Network Packet Broker Solution Revenue undefined Forecast, by Country 2020 & 2033
- Table 7: United States Network Packet Broker Solution Revenue (undefined) Forecast, by Application 2020 & 2033
- Table 8: Canada Network Packet Broker Solution Revenue (undefined) Forecast, by Application 2020 & 2033
- Table 9: Mexico Network Packet Broker Solution Revenue (undefined) Forecast, by Application 2020 & 2033
- Table 10: Global Network Packet Broker Solution Revenue undefined Forecast, by Application 2020 & 2033
- Table 11: Global Network Packet Broker Solution Revenue undefined Forecast, by Types 2020 & 2033
- Table 12: Global Network Packet Broker Solution Revenue undefined Forecast, by Country 2020 & 2033
- Table 13: Brazil Network Packet Broker Solution Revenue (undefined) Forecast, by Application 2020 & 2033
- Table 14: Argentina Network Packet Broker Solution Revenue (undefined) Forecast, by Application 2020 & 2033
- Table 15: Rest of South America Network Packet Broker Solution Revenue (undefined) Forecast, by Application 2020 & 2033
- Table 16: Global Network Packet Broker Solution Revenue undefined Forecast, by Application 2020 & 2033
- Table 17: Global Network Packet Broker Solution Revenue undefined Forecast, by Types 2020 & 2033
- Table 18: Global Network Packet Broker Solution Revenue undefined Forecast, by Country 2020 & 2033
- Table 19: United Kingdom Network Packet Broker Solution Revenue (undefined) Forecast, by Application 2020 & 2033
- Table 20: Germany Network Packet Broker Solution Revenue (undefined) Forecast, by Application 2020 & 2033
- Table 21: France Network Packet Broker Solution Revenue (undefined) Forecast, by Application 2020 & 2033
- Table 22: Italy Network Packet Broker Solution Revenue (undefined) Forecast, by Application 2020 & 2033
- Table 23: Spain Network Packet Broker Solution Revenue (undefined) Forecast, by Application 2020 & 2033
- Table 24: Russia Network Packet Broker Solution Revenue (undefined) Forecast, by Application 2020 & 2033
- Table 25: Benelux Network Packet Broker Solution Revenue (undefined) Forecast, by Application 2020 & 2033
- Table 26: Nordics Network Packet Broker Solution Revenue (undefined) Forecast, by Application 2020 & 2033
- Table 27: Rest of Europe Network Packet Broker Solution Revenue (undefined) Forecast, by Application 2020 & 2033
- Table 28: Global Network Packet Broker Solution Revenue undefined Forecast, by Application 2020 & 2033
- Table 29: Global Network Packet Broker Solution Revenue undefined Forecast, by Types 2020 & 2033
- Table 30: Global Network Packet Broker Solution Revenue undefined Forecast, by Country 2020 & 2033
- Table 31: Turkey Network Packet Broker Solution Revenue (undefined) Forecast, by Application 2020 & 2033
- Table 32: Israel Network Packet Broker Solution Revenue (undefined) Forecast, by Application 2020 & 2033
- Table 33: GCC Network Packet Broker Solution Revenue (undefined) Forecast, by Application 2020 & 2033
- Table 34: North Africa Network Packet Broker Solution Revenue (undefined) Forecast, by Application 2020 & 2033
- Table 35: South Africa Network Packet Broker Solution Revenue (undefined) Forecast, by Application 2020 & 2033
- Table 36: Rest of Middle East & Africa Network Packet Broker Solution Revenue (undefined) Forecast, by Application 2020 & 2033
- Table 37: Global Network Packet Broker Solution Revenue undefined Forecast, by Application 2020 & 2033
- Table 38: Global Network Packet Broker Solution Revenue undefined Forecast, by Types 2020 & 2033
- Table 39: Global Network Packet Broker Solution Revenue undefined Forecast, by Country 2020 & 2033
- Table 40: China Network Packet Broker Solution Revenue (undefined) Forecast, by Application 2020 & 2033
- Table 41: India Network Packet Broker Solution Revenue (undefined) Forecast, by Application 2020 & 2033
- Table 42: Japan Network Packet Broker Solution Revenue (undefined) Forecast, by Application 2020 & 2033
- Table 43: South Korea Network Packet Broker Solution Revenue (undefined) Forecast, by Application 2020 & 2033
- Table 44: ASEAN Network Packet Broker Solution Revenue (undefined) Forecast, by Application 2020 & 2033
- Table 45: Oceania Network Packet Broker Solution Revenue (undefined) Forecast, by Application 2020 & 2033
- Table 46: Rest of Asia Pacific Network Packet Broker Solution Revenue (undefined) Forecast, by Application 2020 & 2033
Frequently Asked Questions
1. What is the projected Compound Annual Growth Rate (CAGR) of the Network Packet Broker Solution?
The projected CAGR is approximately 7.8%.
2. Which companies are prominent players in the Network Packet Broker Solution?
Key companies in the market include Keysight, Gigamon, Cisco, Arista Networks, NetScout, Extreme Networks, APCON, CPacket Networks, VIAVI Solutions, Cubro Network Visibility, Network Critical, Datacom Systems, Profitap, Garland Technology, CGS Tower Networks, Niagara Networks, Microtel Innovation, Larch-Networks.
3. What are the main segments of the Network Packet Broker Solution?
The market segments include Application, Types.
4. Can you provide details about the market size?
The market size is estimated to be USD XXX N/A as of 2022.
5. What are some drivers contributing to market growth?
N/A
6. What are the notable trends driving market growth?
N/A
7. Are there any restraints impacting market growth?
N/A
8. Can you provide examples of recent developments in the market?
N/A
9. What pricing options are available for accessing the report?
Pricing options include single-user, multi-user, and enterprise licenses priced at USD 3350.00, USD 5025.00, and USD 6700.00 respectively.
10. Is the market size provided in terms of value or volume?
The market size is provided in terms of value, measured in N/A.
11. Are there any specific market keywords associated with the report?
Yes, the market keyword associated with the report is "Network Packet Broker Solution," which aids in identifying and referencing the specific market segment covered.
12. How do I determine which pricing option suits my needs best?
The pricing options vary based on user requirements and access needs. Individual users may opt for single-user licenses, while businesses requiring broader access may choose multi-user or enterprise licenses for cost-effective access to the report.
13. Are there any additional resources or data provided in the Network Packet Broker Solution report?
While the report offers comprehensive insights, it's advisable to review the specific contents or supplementary materials provided to ascertain if additional resources or data are available.
14. How can I stay updated on further developments or reports in the Network Packet Broker Solution?
To stay informed about further developments, trends, and reports in the Network Packet Broker Solution, consider subscribing to industry newsletters, following relevant companies and organizations, or regularly checking reputable industry news sources and publications.
Methodology
Step 1 - Identification of Relevant Samples Size from Population Database


Step 2 - Approaches for Defining Global Market Size (Value, Volume* & Price*)

Note*: In applicable scenarios
Step 3 - Data Sources
Primary Research
- Web Analytics
- Survey Reports
- Research Institute
- Latest Research Reports
- Opinion Leaders
Secondary Research
- Annual Reports
- White Paper
- Latest Press Release
- Industry Association
- Paid Database
- Investor Presentations

Step 4 - Data Triangulation
Involves using different sources of information in order to increase the validity of a study
These sources are likely to be stakeholders in a program - participants, other researchers, program staff, other community members, and so on.
Then we put all data in single framework & apply various statistical tools to find out the dynamic on the market.
During the analysis stage, feedback from the stakeholder groups would be compared to determine areas of agreement as well as areas of divergence